GBPUSD Long!!! Very nice UP TREND.You can see super nice up channel with amazing tests of S/R zones.
Definitely LONG.
Supertrend

Colored Directional Movement IndexWhat Is the Colored Directional Movement Index (CDMI)?
The Directional Movement Index, or DMI, is an indicator developed by J. Welles Wilder that identifies the direction of the price movements and the trend strength. DMI is a collection of three separate indicators (ADX, +DI, -DI) combined into one
ADX's purposes is to define whether or not there is a trend present and the other two indicators ( +DI and -DI ) serve the purpose of determining trend direction. By combining all three, a technical analyst has a way of determining and measuring a trend's strength as well as its direction
What to look for :
Trend Strength - Analyzing trend strength is the most basic use for the DMI.
Crosses : When +DI is above -DI, there is more upward pressure than downward pressure in the price. If -DI is above +DI, then there is more downward pressure in the price
DMI can provide quality information and even trading signals, but it is not an easy indicator to master and not easy to read within multiple lines
Here comes Colored Directional Movement Index (CDMI)
CDMI is still the same indicator but visualized on the top of the price chart with single line of coloured triangles. CDMI requires additional setting to be provided by user which are Strong Trend and Week Trend threshold levels. Wilder believed that a DMI reading above 25 indicated a strong trend, while a reading below 20 indicated a weak or non-existent trend. Hence the default values for strong trend is set to 25 and week trend set to 17
How to read CDMI , it is simply to read colours and shapes of the triangles
Tringle Shapes indicates the direction of the move and are calculated by comparing the values of +DI and -DI
triangle up shape when +DI is above -DI (+DI > -DI)
triangle down shape when +DI is below -DI (+DI < -DI)
Triangle Colours, there are four main colours:
Strong Bullish : Green is printed when ADX value is bigger than the Strong Trend Threshold +DI is above -DI (ADX > StrongThesh and +DI > -DI)
Strong Bearish : Red is printed when ADX value is bigger than the Strong Trend Threshold +DI is below -DI (ADX > StrongThesh and +DI < -DI)
Weak Trend : Black is printed when ADX value is lower than the Strong Trend Threshold and bigger than Week Trend Threshold ( ADX > WeekThesh and ADX < StrongThesh)
Even Weaker Trend : Yellow is printed when ADX value is lower than the Week Trend Threshold ( ADX < WeekThesh)
Additionally, Intensity changes of colours (between light and dark) will allow you to follow how ADX value is changing comparing it to its previous values.
If current value of ADX is bigger than the previous value of ADX a dark colour will be printed, otherwise when ADX value decrease a lighter colour will be printed
Please check links below for different usages of CDMI
Hope you enjoy this post and find it useful

GBPUSD Potential BUYExpecting price to retrace to the golden zone. Once price reaches the golden zone (50-60% Fib) I will look for a long position expecting price to reach Resistance Zone 1.26710. If price continues passed golden zone I will look for a short position. At that point I will look for price to reach Support Zone 1.23407.

Bitcoin to decide directionColored DMI indicates no stenght at the major historical support trendl line (orange line), being tested frequantly since May 07 and few times in the past.
PS : Colored DMI - customized interpratation of ADX +DI-DI, or shortly DMI
Momentum is squuezed
When looking of the formations it is defenetly rising wedge (purple lines), a sign for down trend ,
The price action is still within a channel (linear scale, could be useful for short term analysis. For this case the log scale shows channel broken but the price action does not support the same idea, hence assuming the linear scale and channel still not broken)
Ichimoku colored SuperTrend indicates range where the price action is above Kumo Cloud and TenkenSen line above KujinSen
My mid term bias will be for long expecially if the historical trend line is brokken (short term : may be some down movement or range for a while)
Some similarity can be observed when comparing with Stellar and Stellar moved above having nearly the same view of chart patterns

NZDUSD Buy Long Term (Daily TImeframe)Expecting Price to hit Resistance Zone 0.67829 Long Term. Price may continue to pull back to Support Zone 0.62373 than make its way up to Resistance Zone 0.67829 Long Term.


BITCOIN - Ascending Channel - SuperTrend reversal - 17% targetMy test bot triggered a buy signal about one hour ago on Bitcoin: BINANCE:BTCUSDT
It is good to see that we are in an Ascending Channel
The SuperTrend reversed, the take profit target is 17%, which has been a good number in the backtests I made.
The trade could have been filtered out by the ADX filter I included in the strategy but it was not, meaning we are in a trending market.
The SuperTrend will be used as a natural trailing stop loss, securing our trades.
Stay tuned!
Backtest below.

SuperTrend Factor 2 called the bottom and top of BTC perfectlyAll you had to do was take this trade when the SuperTrend turned bullish on the daily, and sold when it closed bearish on the daily.

Introduction to the BEST Trade ManagerHello traders
Let me highlight what the BEST Trade Manager can do for you.
The Trade Manager adds another layer to your own systems, enabling custom user-defined stop-loss/take-profits and real-time analysis with risk-to-reward ratios.
We made it as such the visual rendering is also very nice on mobile devices.
Reviewing:
- How to connect your own indicator(s)
- How to read the graphical elements
- The 8 Stop-Loss options
- The 4 Take-profit options
- The alerts and dynamic alerts for trading automation
Links are in my signature for more information about it
Wishing you all the BEST for your trading using it.
Dave


SUPER TREND SCALPING / EURUSD SCALPINGBY THE HELP OF TWO TREND WE CAN TAKE THE POSITIONS
BUY ENTRY : WAIT FOR MAIN TREND CHANGE TO GREEN / THEN TAKE A LONG FROM THE FIRST GREEN ARROW IN SHORT TREND YOU CAN EXIT ON NEXT RED ARROW . YOU CAN REPEAT THE SAME UNTIL THE MAIN TREND CHANGES
SELL ENTRY : WAIT FOR MAIN TREND CHANGE TO RED/ THEN TAKE A SHOT FROM THE FIRST RED ARROW IN SHORT TREND YOU CAN EXIT ON NEXT GREEN ARROW . YOU CAN REPEAT THE SAME UNTIL THE MAIN TREND CHANGES
TIMES FRAMES 15 /30 /1 HOUR

NIFTY50,1H Heikin Ashi BullishThe hourly Heikin-Ashi chart of NSE:NIFTY has retested the prior top at 11100 area.
There is a bullish signal (3 green arrows) on the Multiple Super-trend indicator that I use.
These arrows need not be on consecutive candles but when they are the signal strength is higher.

BATTLE OF THE SUPERTRENDS. And The Winner Is...BATTLE OF THE SUPERTRENDS
Here is an interesting comparison of many of the Top "Supertrend Strategies" that are published here on Tradingview (Including my own: "SUPER SMART ST") . Please note that all test shown here were done using Heikin Ashi candles, which seem to improve Supertrends functionality ...
15 MINUTE (BTC/USD) COMPARISONS
ONE HOUR (BTC/USD) COMPARISONS
FOUR HOUR (BTC/USD) COMPARISONS
Recently I released several SUPERTREND based indicators, studies and strategies. In fact, I created an entire " Trading Toolkit " that incorporates Supertrend along with many other built-in Indicators, Oscillators and Technical Analysis Tools.
--- SCROLL TO BOTTOM HERE FOR LINKS TO THEM ALL ---
I decided to compare my "Super Smart" SuperTrend with the SuperTrend strategies others had published. As you can see in screenshots above, the results were very interesting. What follows is a summary of my experiences and journey surrounding this super topic.
IT STARTED WITH BACKTESTING
After a lot of thought and "playing around" with SuperTrend over the past few months, I was compelled to perform hundreds of backtests across many cryptocurrencies and all the common timeframes. I was seeking to improve upon SuperTrend (if I could) without degrading any of it's many inherent qualities.
But before I jump into my personal journey toward a "Smart" Supertrend, let me share a few thoughts with those of you who are new to Supertrend...
WHAT IS SUPERTREND?
As the name suggests (and as many of you likely already know) , 'Supertrend' is a trend-following indicator that is notably popular.
WHY?
Well, it does a remarkably great job of recognizing a trend (once in progress) and signaling you to when to jump into a trade after the trend is clear. However, many traders feel the greater value of Supertrend is that it helps KEEP YOU IN your position until that trend is over by ignoring minor dips and retracements along the way. Yes, supertrend has it's short comings (detailed later) , but boy... when it's right, it can be very profitable.
IT SOUNDS SO EASY
When you look at any Supertrend chart (in history) it looks so impressive. You begin to fantasize about gains and profits. After all, Supertrend maps out many impressive price movements. It just seems so easy, right? But you soon realize that "trusting" what Supertrend is telling you is hard... "BUY, BUY, BUY... this is a friggin' trend." But you doubt yourself and what Supertrend is telling you and you hesitate. Been there?
Then you finally get in and Supertrend starts yelling... "STAY IN, STAY IN, STAY IN"... but you're up a percentage point (or two) already and you don't want to lose your profit. You exit. Usually way too soon. You're super happy until you see Supertrend continuing to track along with a monster trend. You missed out! Bummer.
SECRETS OF SUPERTREND
You have to remember a couple of secrets to get Supertrend to work the way you've fantasized:
1) Trust it, get in when it signals and stay in until it signals you to exit.
2) Accept the fact that Supertrend does not work well in sideways markets, so if you detect that this is what is forthcoming in the market... lay back, go do some GRID TRADING or have a beer. Wait for a trending market (unfortunately this is usually less than 30% of the time).
3) Should you enter on a Supertrend signal and discover after-the-fact you are in a flat or sideways market, exit as soon as this is clear or at the latest, when Supertrend signals an exit. Yes, you might have a loss. But don't assume Supertrend didn't work, it did work but the market did not have a trend worth following, so you'll have to enter again on the next signal. For every big Supertrend trade you nail, you'll have to wade through perhaps 6 or 7 not so great trades.
4) To improve your odds, try combining Supertrend with other indicators. Often it's a combination of things that gives you your optimal ins and outs.
Speaking of combinations...
STONEHENGE SUPERTREND PLUS (Toolkit)
It was "Secret #4" (above) that lead me to create the " Stonehenge Supertrend Plus Toolkit. "
This features THREE Supertrends:
A CURRENT timeframe Supertrend,
A HIGHER timeframe Supertrend and
My exclusive SUPER SMART Auto-Adjusting Supertrend.
In addition, it is closely integrated with dozens of other indicators and data points.
BUT WHY THE FUNNY MEGALITHIC NAME?
Well, it looks like Stonehenge! Check it out... it displays an array of stones arranged in a manner that does a pretty good job of predicting the future. Learn to read these stones and you can sometimes predict the future!
And best of all, these Stonehenge "predictive stones" not only incorporate Supertrend data but they also enhance Supertrend as you consider entry and exit points along the way.
LET ME CLARIFY
1) There is Supertrend (the standard indicator)
2) There is SUPER SMART SUPERTREND (a version I optimized)
3) Then there is STONEHENGE (a multi-indicator toolset that incorporates Supertrend and Super Smart Supertrend)
LET ME CLARIFY FURTHER
My indicators here have TWO parts that work together:
1) An overlay that appears on the chart with your candles.
2) A separate stand-along indicator that presents data as an array of colored "stones" which help predict future price movement.
AND YET FURTHER CLARIFICATION
1) I have both free and paid versions of everything.
2) I have both Strategy and Study versions of everything.
3) Strategy versions allow BACKTESTING, while Study versions have ALARMS.
IT MIGHT SOUND COMPLICATED, BUT...
If you're confused, just install a free version ( part 1 and part 2 ) and explore this for a few days. If you like what you see, you might consider the more advanced STONEHENGE TOOLKIT . That's all there is to it!
Now back to our regularly scheduled programming!!!
WHAT'S SO SMART ABOUT SUPER SMART SUPERTREND?
As I built the Stonehenge Toolkit, I kept noticing that the Supertrend part had a very annoying downside: Entry signals lagged and Exit signals came late. If those two things could be improved, Supertrend would be really "Super."
After much trial and error and even more backtesting I developed a solution that achieved my goals without OVER modifying Supertrends' inherent qualities. In a nutshell, I made Supertrend smarter!
MANY PEOPLE ASK...
What's the best ATR period and multiplier setting for Supertrend? After all, there are typically only two important data points we must enter for Supertrend to work, namely the 'period (ATR number of candles or days)' and the 'multiplier (value by which ATR is multiplied).' BTW, in case you don't know, ATR signals the degree of price volatility. A common default setting is 10 for the ATR period and 3 for the multiplier.
While this is good to know, Super Smart Supertrend already has well tested default settings built-in, so you can install it and use it right away, without adjusting settings in the beginning. Just plug and play.
HOW IT WORKS
So here's what I did. Using data from other indicators I came up with a SMART SUPERTREND that auto-adjusts as the market changes. It still has settings so you can fine tune for specific assets and timeframes (if you like) , but once the settings are entered, it auto-adjusts as the market and prices evolve.
With "Super Smart SuperTrend" there is no ATR period setting (ATR is determined programmatically) and now there are TWO multipliers you can experiment with... (a lower one set at 1.7 default and a higher one at 2.5). These multiplier settings create a multiplier range that can be used programmatically to adjust the multiplier automatically as the market and prices evolve.
BTW, there is also a separate STANDARD Supertrend that you can run parallel or turn on/off to compare things if you like.
THE RESULTS
Across all time frames and assets I've tested, I generally get better results with my "Smart" version. Better entries, better exits and well defined trends. However, when compared with a STANDARD Supertrend, "Super Smart" is not radically different, but when it does differ it is almost always better. All this is substantiated by backtesting of course.
BATTLE OF THE SUPERTRENDS
How good is SUPER SMART SUPERTREND? You can decide for yourself. I ran backtests on 8 Supertrend strategies I found here at Tradingview (sample results posted above). I set my charts to use Heikin Ashi candles as these seem to improve Supertrend in general. These comparisons were the best 8 I could find and I commend each author/coder for their fine work. I was not trying to out-do any one, I just wanted to improve my trading results. I'm also rather sure some other strategy will eventually out perform Super Smart Supertrend. And if they do, great! I believe in making more money, not making more indicators!
I tested all of the scripts found here:
www.tradingview.com
I used the timeframes of 15 minutes, 1 hour and 4 hours (as published above) . And I used the default settings built-in to each script strategy and again, with Heikin Ashi candles. I fully understand that you can tweak the settings on any Supertrend strategy and get different results.
I hope you have as much fun with this "BATTLE OF THE SUPERTRENDS" as I had creating it. But at the end of the day, I hope you install and try one of my indicators in the very near future and try the Supertrend indicators by these other authors (linked above).
#########################################
MY SUPERTREND BASED INDICATORS
#########################################
The free versions are extremely powerful and will serve you well, they will also give you a preview of the even more powerful "STONEHENGE SUPERTREND PLUS TRADING TOOLKIT." I recommend you use both Stonehenge AND a Companion overlay.
###################################################
STONEHENGE SUPERTREND PLUS TOOLSET (paid versions)
###################################################
DH: (Strategy) Stonehenge SuperTrend Plus Toolkit / Stones
DH: (Companion) Stonehenge SuperTrend Plus Toolkit / Overlay
#########################################
STONEHENGE BASIC TOOLSET (free versions)
#########################################
STONEHENGE SUPERTREND BASIC (Double Stone Indicator Version)
(You may use either of the SUPERTREND overlays below as a companion with this "double stone" indicator)
DH: (Study) Basic Stonehenge SuperTrend - Double Stone Version
SUPER SMART SUPERTREND (Overlay Companion Indicators)
DH: (Study) Super Smart SuperTrend: Self Adjusting
DH: (Strategy) Super SmartSuper Trend: Backtest Version
#########################################
That's it. Get "SMART" Today!
PLEASE HIT THE LIKE BUTTON (and follow me... lots of other SMART STUFF in the works!)
As always, I appreciate your support. Please share with others.
ENJOY!
Dan Hollings
Master Crypto Grid Trader
Stonehenge Master Mason
Host of the "High Leverage Lounge"
Please Explore My Other Indicators, Scripts, Grids and Educational Ideas.
@DanHollings on Tradingview.
Additional Links Below...

SuperTrend (Self-Adjusting Parameters for Highest Profitability)How to scan scan across multitple timeframes at once :)
Used timeframes:
15min____|____3h
30min____|____4h
1h_______|____8h
2h_______|____1D
It appears that the 1h is the most profitable one.

What is an Hard Exit ? and a few notes on trading managementHi everyone
Today I'm traveling so can't really share a script because A) it's not coded B) I'm tired C) no inspiration today so instead, I'll be spreading a bit of wisdom (if I may call it like that)
I see a lot of traders out there solely depending on two main signals to exit a position :
1) A signal in the opposite direction
2) A stop loss to exit a position (fixed, or trailing)
Those two points are a very good practice but what if you could exit a position before "sh*t will hit the fan" (pardon my french).
For instance, you enter a trade, you see it's going against you, you're down 2% and your stop-loss is only a few % more away.
Thanks to your experience, you know that when one of your trade goes down below a given threshold, it will wreck (= rekt in crypto terminology) you even deeper with a high probability. Obviously, sometimes it will, sometimes it won't and you'll never figure out the right stop loss level to handle all the edge cases...
Let's now introduce the concept of a hard exit . What is it exactly? In short (no pun intended.... actually yes it was...), now thanks to your experience, you know that whenever a given indicator gives an opposite signal, you'll have to exit your trade if you don't have a positive trade balance. If positive, you know, that you should either set your stop loss to breakeven (entry-level of your trade) or exit it completely.
When such a scenario happens, maybe sometimes, it's better to exit a trade completely when you have that signal before going to bed...
Hands up anyone who took a trade before sleeping, thinking they'll wake up way richer and finally discovered they got margin called? or lost way too much money because their stop loss wasn't hit because that mean broker decided to use the "SUPER WRECKING SLIPPAGE" function to go beyond your stop loss... Your stop loss is looking at those candlesticks going above and doesn't understand what's going on...
The example in the screenshot is very interesting. Let's assume a very simple strategy using the supertrend. When it's green, we go long, when it's red, you go..... (finish it)
You noticed that the MACD Zero Lag will often allow you to exit the position before your stop loss will be hit and before the trade will go in the opposite direction. Sometimes, it won't save you any $$ doing so... but most of the time it will save you a few % of capital per trade and this will add up very quickly. (imagine saving a few percents or capital per trade multiplied by dozens of trades)
I'm not advising to use the correlation between the Supertrend and the MACD Zero Lag here. This is just an educational example :)
Warren Buffett said this: “Rule No. 1: Never lose money. Rule No. 2: Never forget rule No.1”.
We all believe we're smarter than the average but 95% of us is losing on the market... this doesn't add up :) 95% is losing... let that sinks in.
Does it mean that most of the things you read on Trading Twitter about guys taking leveraged trades and waking up with a brand new Lamborghini might be a fake story? (rhetoric question)
Am I saying that you should close your trades before sleeping if not already winning? (rhetoric question again)
"But sir I'm sure of those trades, I know the market, I'll be promised to go to the Valhalla by John McCaffee if I hold this XVG, XRP and TRX positions" (no one actually told me this that way but that's what I hear when someone finds reasons to keep losing trades overnight/over weekends)
Those people generally have a plan in mind and they want to stick with it. Either because they're scared to exit and to see then their trade going in the desired direction... or because they're too stubborn. And even then, if you have a system giving you a few signals and you count on each of them to pay your rent.... you're doing that trading thing wrong my friend
Either way, you have the choice between not losing or risking to lose big but maybe winning when you'll wake up. The best traders I know constantly doubt, optimize their strategies but never assume the market will favor them, not even once. However when they see a great potential profitable setup with an amazing Risk:Reward, they know that's with those trades, they'll have to go real BIG (betting the house, the wife, the kids, the car, ...) but certainly not with the already losing trades and hedging before sleeping ... (who...came up with those expert advisors using martingale during sleeping hours...very dangerous... )
If you wonder who I am to give all those lessons and scripts.
I worked in a bank alongside traders for years, and I saw hundreds of traders/investors losing everything and I mean they lost more than their trading capital.
This is truly sad because trading is a psychological game between you and the casino (market). We surely have more hedge than playing cards in a casino for sure thanks to technical analysis and that's why I got so deep into TA 6 years ago, made it a full-time job in a bank and learned everything I could to secure my trades/investments and become an emotionless machine when trading.
That's why I made the Algorithm Builder, to remove most of the psychological aspect. This made my own and my clients' trading way more enjoyable.
More to come about it tomorrow or the day after.
Wishing you a great end of your day
Dave
____________________________________________________________
Be sure to hit the thumbs up
- I'm an officially approved PineEditor/LUA/MT4 approved mentor on codementor. You can request a coaching with me if you want and I'll teach you how to build kick-ass indicators and strategies
Jump on a 1 to 1 coaching with me
- You can also hire for a custom dev of your indicator/strategy/bot/chrome extension/python
- if you like my work and wants to buy me some coffee :
- BTC TipJar: 3MKDve7stWTe1io99oFxeQXvP8XB4zCQ8m
- LTC TipJar: MC5oeBAhw9BLqyi65TR3J1Lid8io9uHADw

SuperTrend TestThis is a strategy to test the supertrend by mejialucas, to see if the signals are able to hit a ATR take profit before a 1.5*ATR stop loss.

S&P 500 Economic Supercycles: What Are They and What Lies Ahead?Here's my modest attempt to identify S&P 500 Supercycles.
The chart shows the S&P 500 (monthly bars) since 1872 on a log scale.
Maybe it is not as bad as they say, and we are currently "just" in the Supercycle Wave 2.
Before us would be the longest Wave 3. Hopefully that's true. I can dream, can't I? ;-)


Deutsche Bank: Upside opportunity Upside opportunity towards 15 euros for Deutsche Bank. On the weekly we have a positive divergence both on the RSI (also on the monthly) and on the Chaikin Oscillator. Possible retracement in area 10 euros. Volume Profile confirms the resistance levels.

USDJPY; The pair is positively up.TREND; Up
STRENGTH; Very strong
STATUS; Retracing/ approaching overbought
Entry; Current price or retracement to 109.360
STOP; 109.122
TARGET; 109.880 & 110.450
All the best.

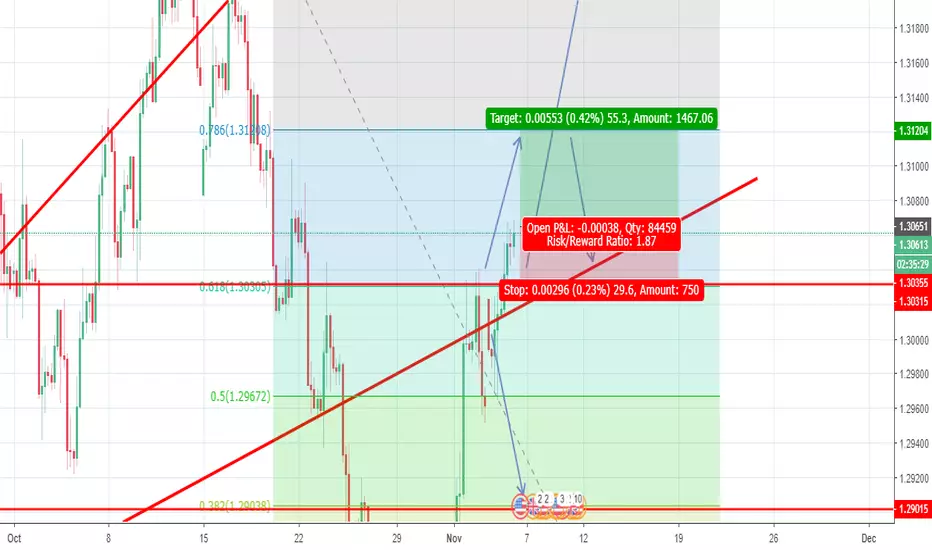
GBPUSD LONG NOWHere we saw at 1.30300 area a trap of bearish , but broke again now we can long from here to the first resistance of 1.31200 , and do not forget to put stop lost on it , we already took big profit from tthis pair at past week ... this analyse for the person who has position on this
trust for this transaction %83 ...
Supertrend v3 with Alerts & EMA on high and low basisThis is modified script for Supertrend with Alerts and EMA for lows and high

Huge earnings surpriseEPS of $1.58 (beat by $1.13) and rev of $5.46B (beat by $350M). Positive trend line on the monthly should hold, IMO. Chart is currently oversold and should begin a new uptrend.
