GBPUSD - Also continued downside continuationLooking at GU. This is a little bit ahead of its time in comparison to EU.
And what i mean by that is EU is a lot further away from its 4H demand zone compared to GBP so it will be super interesting to see how we react at the level we are fast approaching on GU.
I am in a short position as of Friday. I will be posting a video tomorrow showing exactly how and why i got short on GU so stay tuned for that one.
As always if there is anything else i can be of assistance with give me a message and i will be happy to answer any questions you may have
Supply_and_demand

EURUSD - Still Orderflow remains bearishLooking at EU. The 1H Orderflow is still maintaining that bearish intent. My area is set now for where i want to take a potential sell to the downside seeing as everything else is pretty much mitigated.
The only issue with this potential sell of is that we never really had a sweep of liquidity before we rolled over and moved to the downside.
We do have a level of inducement before our POI but i think in an ideal world i would love to see us build up a bit more liquidity before the POI just to induce the early sellers before making that move to the downside.
For now. On the lower TF's i will be looking to take short term long positions back up to our POI before looking for the longer terms short. to our 4H POI in which i will be looking to get long once again.
Any questions feel free to give me a message

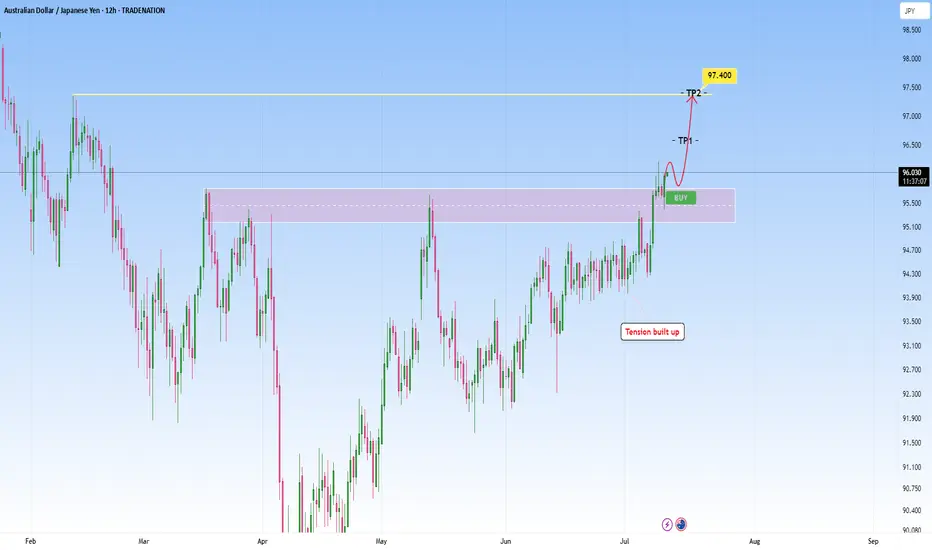
AUDJPY Technical Breakout - Targeting 97.400 Next?TRADENATION:AUDJPY has recently broken decisively above a key resistance zone that had previously capped price for several months. This breakout was preceded by a period of compression and range-bound price action, where bullish momentum steadily built up, indicated by higher lows pressing against the resistance level. This type of structure typically leads to an explosive breakout, which we are now seeing unfold.
After the breakout, price came back for a clean retest of the broken resistance zone, which has now flipped into support. The retest held firmly, suggesting strong buyer interest at this level and confirming the validity of the breakout.
With this structure in place, the bullish momentum is likely to extend further toward the next target zone around 97.400, provided price remains above the current support.
As long as the price holds above the retested zone, the bullish outlook remains intact. A breakdown back below this area, however, would be a warning sign and could open the door to a deeper pullback.
Remember, always wait for confirmation before entering trades, and maintain disciplined risk management.
GBPUSD - 2 Selling opportunitiesLooking at GBPUSD
We have 2 opportunities to get short. Both have a build of liquidity before the areas of supply before them. This means we are looking for the early seller to get into the market before we get in so that all the early seller get stopped out.
As we can see the order flow on this is still bearish. So until the market shows me it want to go higher then we will remain bearish
Keep a close eye on this for tomorrow
EURUSD Bearish SMC Setup | Premium Supply Rejection + CHoCH +FVGPair: EUR/USD
Timeframe: 4H
Price reacted strongly from a Premium Selling Zone, forming multiple CHoCH (Change of Character) and BOS (Break of Structure) confirmations.
🔻 Red Zones indicate strong institutional selling
🔺 Weak High is now likely to remain protected
Market structure has shifted bearish, and price is targeting imbalances (IMB) and Fair Value Gaps (FVG) below.
⸻
✅ Entry: Taken from the premium supply rejection
🎯 Target 1: 1.16000 – Minor imbalance fill
🎯 Target 2: 1.15000 – Mid-level demand
🎯 Final Target: 1.14500 – Major liquidity zone
❌ Invalidation: Clean break above 1.18000
⸻
📉 Smart Money Confirmation Setup:
• Premium Supply
• CHoCH
• BOS
• FVG & IMB below
🔄 Missed the entry? Wait for a pullback into lower OB or supply zone.
#EURUSD #SmartMoney #SMC #CHoCH #BOS #FVG #OrderBlock #Forex #LiquiditySweep #SupplyDemand


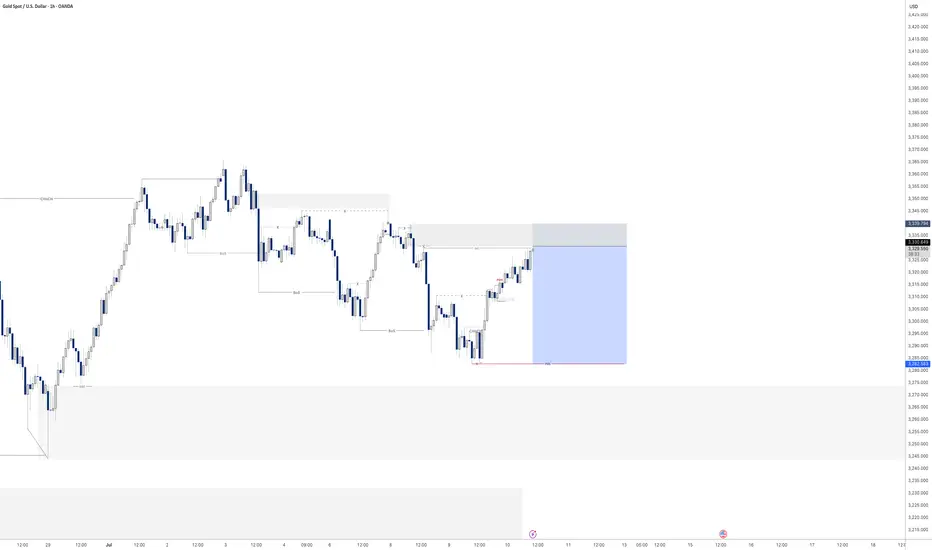
Gold - Sell before longer term buyLooking at gold we are a matter of a few pips away from entry. looking to play gold down till our larger 4H area of demand seeing as we have had a CHoCH to the upside.
There for i will be looking to take my sell position down to 3283.5 at a bare minimum as it was the previous structure level in which we turned around.
Lets see if we get tagged in. If not i will jump down to the lower TF and see if we can get a confirmation that price is going to turn from here.
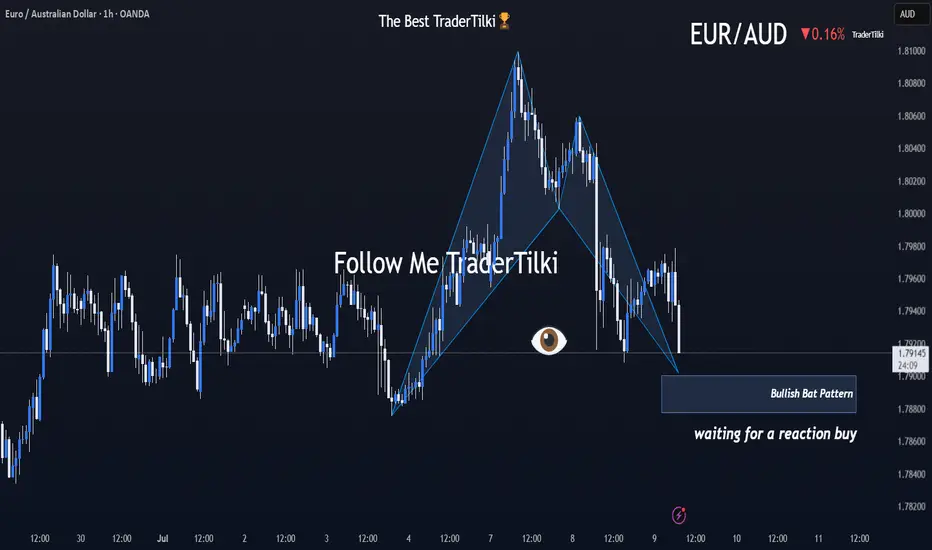
Brace Yourselves: EURAUD’s Harmonic Storm Is Coming!Good morning, Traders ☀️
I've identified a bullish harmonic Bat pattern on the EURAUD pair.
At this stage, I'm only anticipating a reactional buy from the marked zone.
I'll determine my target level after observing the market's response from that area.
📌 I’ll be sharing the target details under this post once the reaction unfolds.
Your likes and support are what keep me motivated to share these analyses consistently.
Huge thanks to everyone who shows love and appreciation! 🙏
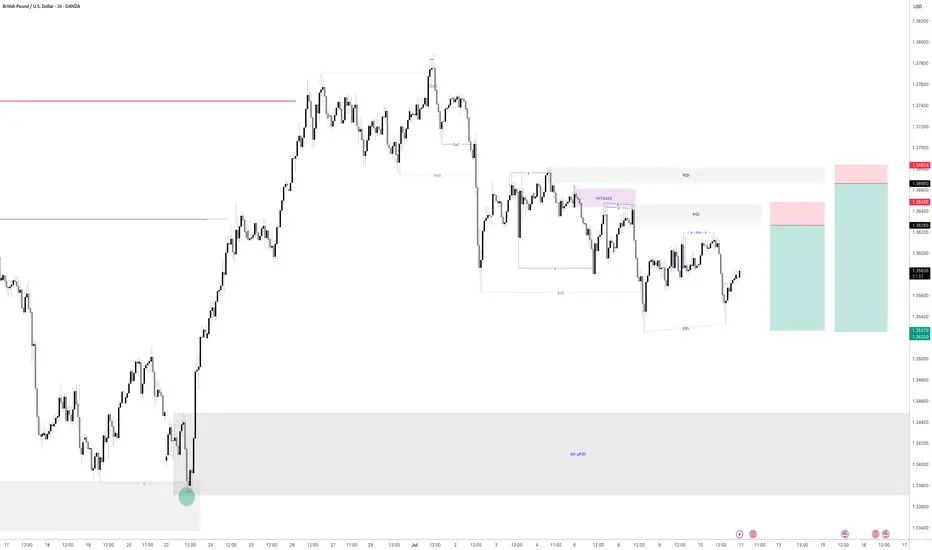
GBPUSD - 2 potential selling opportunitiesLooking at GBPUSD
We have 2 potential selling POI's.
The first one being a point in which we will need to sit on our hands for a little bit to see what price does at there is no inducement in the push down in the impulse leg. With that being the case we will need to see some sort of inducement built before we enter that POI
IF we clear the first POI I think I will take a more aggressive entry on the secondary POI that sits a little bit higher. This is due to us having already put in some sort of liquidity in and around that POI before pushing lower.
Will wait and see what happens.
Tomorrow could be a very good trading day

30M Insight: EURUSD Buy Limit ReadyGood Mornıng Traders;☀️
Based on a 30-minute analysis, I’ve identified a shift in EURUSD market structure. I’ll be waiting for price to reach my level with a buy limit order.
📥 BUY LIMIT ORDER: 1.17180
🛑 STOP LOSS: 1.16946
🎯 TP1: 1.17275
🎯 TP2: 1.17412
🎯 TP3: 1.17649
📊 Risk / Reward Ratio: 2.00
Patience meets precision. Let the market come to you.
🧠 Master your mindset with iron discipline.
Never fear the trade—let the trade fear you.
Keep your motivation high and your focus sharper than ever.
-----
Your likes and support are what keep me motivated to share these analyses consistently.
Huge thanks to everyone who shows love and appreciation! 🙏

Gold sell off before continuation higher? Pending order set on this one before bed
Will see what develops overnight

EURUSD - Potential sell at LDN or NY openLooking for sell from the POI highlighted
We have raided buy side liquidity so now its time to look at the origin of the move and see if we can further capitalise on a similar set up I took yesterday in order to bank a lovely 8.5% profit on this single trade.
Will post the trade below

GBPJPY sitting at resistance – Is a drop to 193.360 likely?GBPJPY is sitting right at a key daily resistance zone. This is a level where it has struggled to break through and reversed strongly to the downside. So this makes it definitely one to monitor, especially if you’re eyeing potential short setups.
If we start seeing signs that the price is getting rejected here: like long wicks, strong bearish candles, it could be the early indication of another move lower. My focus is on a moderate drop toward the 193.360 area, similar to what we’ve seen in past pullbacks. Nothing too dramatic, just a simple downside play if sellers step in again.
But if we get a strong breakout? That changes everything: it would hint that bulls are taking full control. This area is pretty important and could give us a better idea of where price is headed next.
Just sharing my thoughts on support and resistance, this isn’t financial advice. Always confirm your setups and manage your risk properly.
Disclosure: I am part of Trade Nation's Influencer program and receive a monthly fee for using their TradingView charts in my analysis.

What’s EURUSD Telling Us on the 30-Minute Chart?🌅 Good morning, my friends,
EURUSD just made a pullback within the last 30 minutes, so I entered a sell position based on that move.
🎯 Targets:
- TP1: 1.17607
- TP2: 1.17475
- TP3: 1.17174
🛑 Stop Loss: 1.17938
📊 Risk/Reward Ratio: 2.00
Your likes and support are what keep me motivated to share these analyses consistently.
Huge thanks to everyone who shows love and appreciation! 🙏

On Swing Traders’ Radar: Gold Pattern Alert on the Daily Chart!Dear Traders,
In my daily gold analysis, I’m observing a Head and Shoulders pattern nearing completion. The neckline is currently positioned around the 3,247.00 level.
If this neckline breaks to the downside, gold could potentially drop toward the 3,150.00 area.
Since this is a one-day analysis—aligned with a swing trading style—it may take some time for the setup to fully play out.
I meticulously prepare these analyses for you, and I sincerely appreciate your support through likes. Every like from you is my biggest motivation to continue sharing my analyses.
I’m truly grateful for each of you—love to all my followers💙💙💙

GOLD - POTENTIALLooking at gold. Its still in a bit of limbo after the NFP reaction on Friday. However it is looking like the draw on liquidity is higher. Therefore my bias on gold for the start of the week is bullish so will be looking to get the most optimal entry to take some buys to the upside.
If we can manage to find a decent enough move price really could rally upwards.

EURUSD - Where next?Looking at EURUSD
I still feel like we are due some sort of deeper retracement to the downside considering how bullish the 4H and Daily time frame have been in recent times.
Although the market does not care how I feel in all honesty haha. I will play the short term short until the 15min orderflow switches bullish once again.
The expansion that is currently happing right now is very interesting and makes a good watch to see what we will do come market open as we are engineering liquidity for both a buy and sell with both POI's looking primed for entries.
Will be keeping a close and keen eye on EURUSD when the market opens
Any questions feel free to give me a message

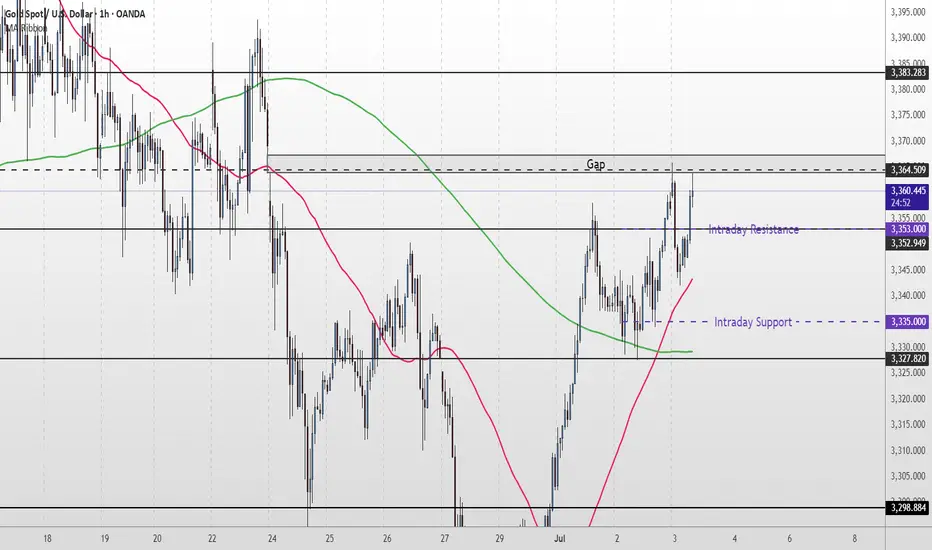
Gold Short Term OutlookYesterday, we highlighted that gold had reclaimed the 200MA and that the $3,327 support level needed to hold for further upside. Since then, price has steadily climbed and is now testing the $3,364 resistance — a level that also aligns with an unfilled gap.
Price action remains bullish for now, with price holding firmly above both the 50MA and 200MA.
If buyers manage to clear and hold above $3,364, we could see further upside toward $3,383 and $3,400, with possible extension into $3,418.
However, if price fails to break above $3,364, we may see a pullback into the $3,335–$3,327 zone. A break below there could open the door for a deeper drop into $3,298 or even $3,270.
📌 Key Levels to Watch:
Resistance:
$3,364 • $3,383 • $3,400 • $3,418
Support:
$3,352 •$3,335 - $3,327 • $3,298 • $3,270
🧠 Fundamental Focus:
📌 ADP Non-Farm Employment Change
📌 Initial Jobless Claims
📌 ISM Services PMI
📌 ISM Non-Manufacturing PMI
⚠️ With multiple red folder events on the calendar, expect elevated intraday volatility. Manage risk accordingly.
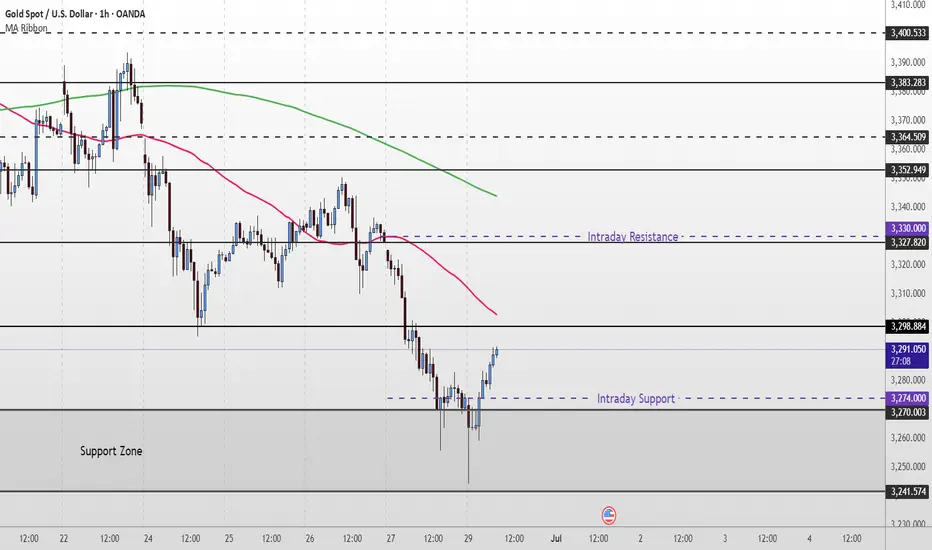
Gold Short Term OutlookYesterday, we noted that gold was attempting a recovery from the Support Zone but remained below both the 50 and 200 MAs, meaning bearish pressure was still intact.
Since then, price has broken and held above $3,298, and is now trading around $3,330, just beneath the 200MA.
This marks a shift in short-term momentum — gold has reclaimed the 50MA and is now challenging the 200MA.
If bulls manage to break and hold above the $3,327 resistance, it could open the path toward $3,352 - $3,364 and potentially higher resistance zones.
However, if price rejects the 200MA and fails to hold above $3,327, we may see a pullback toward $3,298 or deeper into $3,270, where bulls could look to reload.
📌 Key Levels to Watch:
Resistance:
$3,327 • $3,364 • $3,383 • $3,400
Support:
$3,298 • $3,270 • $3,241
🧠 Fundamental Focus:
📌 Fed Chair Powell speaks today at the ECB Forum in Portugal.
Markets will closely watch for any shift in tone on inflation or rate outlook. His comments may influence USD direction and gold volatility.
📌 ISM Manufacturing PMI – a key gauge of economic activity. A strong print may pressure gold; a weak reading could support it.
📌 JOLTS Job Openings – offers insight into labor market strength. A tighter market could delay rate cuts and weigh on gold.
With multiple risk events packed into today, expect increased volatility across the board.

BTCUSDT in a sell zone Let's keep it simple.
The IOF is bearish on the H4 timeframe.
Price has retraced to a premium zone.
Technically, once we see a lower timeframe confirmation from these zones, we take a sell.
While I'm eyeing the liquidity at 109050, any break below 106415 will usher us into a sell towards 99000.
Use your proper entry confirmation and risk management.

Gold Short to Medium Term Outlook
Last week, gold bounced from the lower Support Zone after briefly breaching $3,270. Price is now attempting a recovery, currently trading near $3,290, but remains below both the 50 EMA and 200 EMA — confirming bearish pressure is still intact.
For bulls to gain momentum, we need to see a clean break and hold above $3,298–$3,327which would open the path toward $3,352 and possibly higher resistance levels like $3,364 and $3,383.
Until then, this move may simply be a short-term pullback within a broader downtrend. If price fails to reclaim $3,327, watch for a drop back toward $3,270, with a deeper correction targeting the $3,241–$3,211 zone.
📌 Key Levels to Watch:
Resistance:
$3,298 • $3,327 • $3,352 • $3,364 • $3,383
Support:
$3,270 • $3,241 • $3,211 • $3,179
🧠 Fundamental Focus:
This week is packed with high-impact events — including FOMC minutes on Wednesday and Non-Farm Payrolls on Friday. Both events could trigger sharp moves in gold, so stay cautious and manage risk wisely.
Market Re-Cap and Outlook for NEXT WEEKHere I am giving you a little insight as to what trades I am currently in, taken & looking to take for the week just gone and the week coming.
1 Winning trade on EU
1 Current open position on EU
EURGPB - Breakdown
AUDUSD - Breakdown
NZDUSD - Breakdown
Gold - Breakdown
If there are any pairs you would like me to share my feedback on give me a message and I will be happy to try and do so.
Thanks
Happy Hunting

EURUSD - Potential buying opportunityLooking at EURUSD
We are still very bullish with no sign of it slowing.
I am aware of a potential weekly liquidity point to the left, however, until EURUSD shows its hand it's important that we still remain bullish.
We have set up a lovely liquidity point before a lovely demand area.
So I will be setting a pending order at the demand area after the New York close and the Asian session begins.
