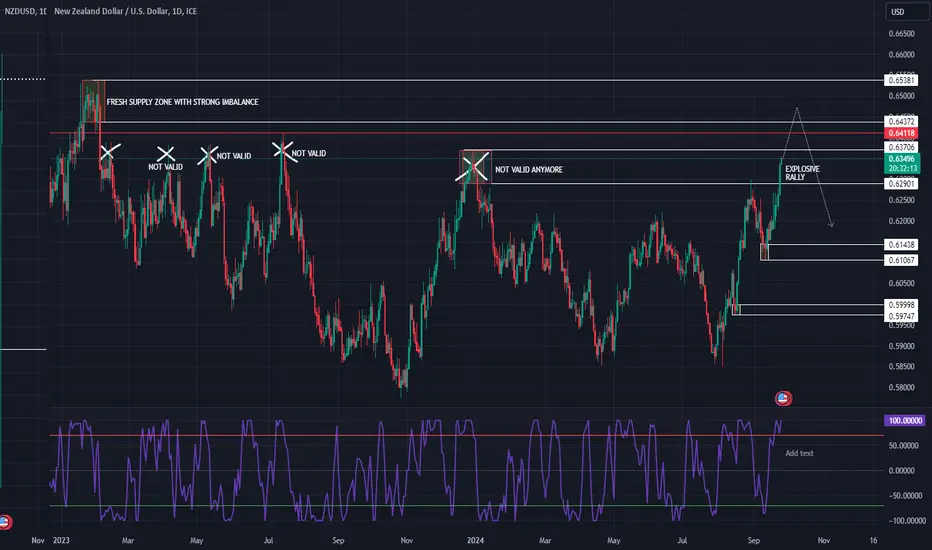
NZDUSD STILL BEARISH >The New Zealand Dollar had an explosive rally last week, deeply penetrating and ultimately invalidating the highlighted supply zone, indicating the exhaustion of any remaining unfilled orders.
>We can now observe five invalidated supply zones lined up on the chart.
>Above these zones lies a high-quality, fresh supply zone, where significant stop-loss orders and a large volume of sell orders could potentially accumulate in anticipation of the upcoming FED speech on Thursday, which may act as a catalyst for a sharp drop.
>The US Dollar Index remains undervalued (refer to my USD analysis for more insights).
>Given that the NZD is currently overvalued, the price may soon seek reasons to turn bearish. For this to happen, a considerable volume of sell orders will be needed to trigger a downward move.
***As always, trade safe and make sure to do your due diligence when analyzing the charts.***
Supply_and_demand

TSLA SHORT TRADE IDEA**STOCKS VS USD & TREASURY BONDS - Currently Oversold signaling a bearish sentiment. Price would need a reason to for a bearish move and could take the highlighted Supply Zone.
Supply and Demand Analysis:
>Price could take the the daily Supply Zone and the PRICE GAP within the supply zone could get filled.
>Price could fill the Gap before a bearish move and go to the highlighted opposing Demand Zone
***As always, trade safe and make sure to do your due diligence when analyzing the charts.***

GOOG (Google) Short Idea**STOCKS VS USD & TREASURY BONDS - Currently Oversold signaling a bearish sentiment.
Supply and Demand Analysis:
>Price already took the daily Supply Zone but the PRICE GAP is not yet filled.
>Price could fill the Gap first before a bearish move filling orders on multiple price gaps below
***As always, trade safe and make sure to do your due diligence when analyzing the charts.***

GBPUSD BEARISH FOR THIS WEEK **CHECK MY EURUSD ANALYSIS FOR THE CFTC COT REPORT BIAS
CFTC COT Report Bias: BEARISH
**British Pound's value against the Dollar is still at the over-sold region
**Supply and Demand Analysis - Price Is accumulating at Supply Zone #1 and could reach Zupply Zone #2 before the bearish move and could target the opposing demand zones highlighted on the chart.
**Others - the catalyst for the bearish move could be the US FED news release on Monday.
***As always, trade safe and make sure to do your due diligence when analyzing the charts.***

EURUSD STILL BEARISH FOR THIS WEEK**BIG BOYS BIAS (CFTC COT INDEX REPORT)
>Commercials are still long term Bearish
>Retailers are long term Bullish (Always Wrong)
>Fund Managers are Diverging from price chart (Trend Followers)
**EURO Valuation Against USD
>We are still in at the Oversold region
Others:
>Price already took the Daily Supply Zone, price is now accumulating and the catalyst for the bearish move could be the US FED news and the EURO Inflation Rate news release on Monday.
***As always, trade safe and make sure to do your due diligence when analyzing the charts.***

61.69% Probability for Bullish USOIL TP!Key Fundamentals Supporting a Bullish Outlook:
- OPEC+ Production Cuts: OPEC+ has implemented production cuts to stabilize oil prices, which can lead to a tighter supply and potentially higher prices for crude oil.
- Geopolitical Tensions: Ongoing geopolitical issues, particularly in oil-producing regions, can disrupt supply chains, leading to increased prices as markets react to potential shortages.
- Economic Recovery Signals: As global economies continue to recover from the pandemic, demand for oil is expected to rise, further supporting bullish sentiment in the market.
By combining a bullish bias with a probabilistic approach to trading, I aim to position myself advantageously in the market while managing risks effectively.
Feel free to share your thoughts in the comments below!
2W:
2H:

AUDUSD. Medium and short term analysisHello traders and investors!
The price reached the target of the forecast from April.
Some medium-term forecasts take a long time to come to fruition. It creates the impression that medium-term forecasts always come true. You can use the following criterion to consider a forecast fulfilled: ensure that the price does not break the last local extreme before reaching the target. If this condition is met, the forecast can be considered successfully realized. In the April forecast, the last local extreme is point 5 of the sideways range (0.62701).
Weekly Timeframe Analysis
Let me remind you that on the weekly timeframe (TF), a sideways range has been forming since January 2023 (point 4). The lower boundary is 0.61699, and the upper boundary is 0.71577. Formally, the buyer has reached the target of the 5-6 vector (0.69205), and there are no signs of reversal yet. The last two weekly candles show increased volume, with small buying wicks. However, the price is currently in the seller's contextual area (the upper range of the weekly TF sideways movement), but the seller is not utilizing this volume yet.
Daily Timeframe Analysis
On the daily TF, a sideways range has been forming since August 24 (point 4). The lower boundary is 0.63478, and the upper boundary is 0.67985.
The buyer's 4-5 vector has broken through the upper boundary of the range. For three days, the price has been unable to break through the level marking the start of the last seller's sub-impulse on the weekly TF (0.68996). Below, the buyer is defending the breakout of the last sub-impulse seller level on the daily TF (0.68239). For the last two days, the buyer has applied increased volume with no result. On the other hand, the price is in the seller’s contextual area (the upper range of the weekly TF sideways movement), so the seller should be evaluated first—and so far, the seller is absent.
Highlight:
• There are no signs of the seller on either the weekly or daily TFs to justify looking for mid-term sales. A sign of the seller could be a return of the price to the daily TF sideways range and the seller defending that return.
• There is no context for mid-term buys, as the price is in the upper part of the weekly TF range (a seller's contextual area).
2H Timeframe Analysis
For short-term buys or sells, you can use, for example, the 2-hour TF. On this TF, there is a sideways range, with the seller’s 7-8 vector being active and the potential target at 0.68179.
The seller has returned the price to the range (below 0.69081), forming a seller’s zone above (marked by a red rectangle on the chart). Sales can be considered. When selling, monitor the price's movement around 0.6868 and 0.68625.
Purchases can be considered from the lower boundary of the range (0.68144) if the buyer defends it.
Good luck with your trading and investments!

EXPECT POSSIBLE SELL OPPORTUNITY IN GOLD ANYTIME SOON Price has been maintaining a bullish-like structure for quite some time now and in past week, we saw how some bearish momentum set in around the price of 2685.34 this a sign that sellers are around the corner and there’ll be a possible profit taking activity soon. This. Coming week, we’d be monitoring price closely for a time it’ll change from intraday bullish to intraday bearish to take some short-term bearish sentiment .

Alikze »» BAND | Descending channel failure🔍 Technical analysis: Descending channel failure
- It has been moving in a downward channel on the daily time frame.
- It is currently in the supply zone with the breakdown of the descending channel.
- In case of a pullback to the broken structure and maintaining the 1.17 area, it can continue its growth until the next supply area of the 1.75-1.95 range.
In addition, in case of failure of the supply zone of 1.75-1.95 range, the upward movement will continue towards the next supply zone, which can touch the 2.60 range.
💎 Alternative scenario: In addition, if the 1.17 range is broken down, the bullish scenario will be invalidated and can continue the correction up to the 0.97 area.
»»»«««»»»«««»»»«««
Please support this idea with a LIKE and COMMENT if you find it useful and Click "Follow" on our profile if you'd like these trade ideas delivered straight to your email in the future.
Thanks for your continued support.
Best Regards,❤️
Alikze.
»»»«««»»»«««»»»«««
BINANCE:BANDUSDT

Alikze »» DOGE | channelized bullish wave 3 scenario🔍 Technical analysis: channelized bullish wave 3 scenario
- Following the analysis of the previous post , Dogecoin managed to experience growth in a downward channel until the ceiling of channel one, after which it entered a short-term correction.
- Currently, it has left the descending channel and is moving in a short-term ascending channel.
- Now it is at the ceiling of the ascending channel, it can meet the demand with the pullback to the broken structure and the middle range of the ascending channel and continue its growth until the supply area.
- According to the current momentum, the rising wave can grow as much as the previous wave or up to 1.618 supply range.
💎 In addition, if the green box is broken, this correction can continue until the origin of the movement and the range of 100 fibo.
»»»«««»»»«««»»»«««
Please support this idea with a LIKE and COMMENT if you find it useful and Click "Follow" on our profile if you'd like these trade ideas delivered straight to your email in the future.
Thanks for your continued support.
Best Regards,❤️
Alikze.
»»»«««»»»«««»»»«««
BINANCE:DOGEUSDT

Analysis-NAS100-H4_September-2024In my vision, the next week we see the price return in this supply zone.
For then continue the drop and returning to the psychological zone of 20,000$.
The final target would be marked by the 125.00% on screen.

Alikze »» ORDI | Ascending channel - 1D🔍 Technical analysis: Ascending channel - 1D
- In the analysis presented in the previous post , after reaching the ceiling of the channel, selling pressure was encountered, which led to correction up to the green box area.
- There was a demand in the green box area, which has led to the failure of the supply area and neck line.
- Currently, it has exited the daily medium-term descending channel and is currently moving in a short-term ascending channel.
- It is currently in the supply zone, which can continue its growth with a pullback to the broken structure until the next supply zone.
- Short-term goals are 50, 53, 56, 60 dollars. In case of failure of the 53 dollar area, which is the ceiling area of the ascending channel, it can continue its growth until the supply area equal to the width of the channel.
💎 Alternative scenario: In addition, if it faces selling pressure in the supply range and loses the range of 37.5, it can continue the correction up to the green box range of the bottom of the channel.
»»»«««»»»«««»»»«««
Please support this idea with a LIKE and COMMENT if you find it useful and Click "Follow" on our profile if you'd like these trade ideas delivered straight to your email in the future.
Thanks for your continued support.
Best Regards,❤️
Alikze.
»»»«««»»»«««»»»«««
BINANCE:ORDIUSDT

EURAUD new bearish expectations after todays EU events
EURAUD strong bearish in last peirods, currently after todays EU events we can see EUR is start weakening more.
Currently price action visible BEARISH FLAG pattern, its breaked and we can see strong momentum.
From here bearish continuation till next zone expecting
TP1: 1.59650
TP2: 1.58650

Alikze »» INJ | Ascending channel - 12H🔍 Technical analysis: Ascending channel - 12H
- In the analysis presented in the previous post , a corrective wave was carried out up to the green box area, which has entered an upward phase in the green box area after the demand.
- Currently, in the 12H time frame, it can have a growth up to the range of $25, which in case of a pullback to the middle of the channel, it will have the ability to continue growing up to the top of the channel.
- If the $25 zone fails, it will have the ability to continue growing up to the supply zone.
💎 Alternative scenario: In addition, if it faces selling pressure in the range of $25 and loses the middle of the channel, it can continue to correct at least up to the Fibo range of 1.618 and the price range of 18.75.
»»»«««»»»«««»»»«««
Please support this idea with a LIKE and COMMENT if you find it useful and Click "Follow" on our profile if you'd like these trade ideas delivered straight to your email in the future.
Thanks for your continued support.
Best Regards,❤️
Alikze.
»»»«««»»»«««»»»«««
BINANCE:INJUSDT

Buy NZD/JPY Bullish ChannelThe NZD/JPY pair on the M30 timeframe presents a potential Buying opportunity due to a recent downward breakout from a well-defined Bullish Channel pattern. This suggests a shift in momentum towards the Upside in the coming Hours.
Key Points:
Buy Entry: Consider entering a Long position around the current price of 90.80, positioned close to the breakout level. This offers an entry point near the perceived shift in momentum.
Target Levels:
1st Support – 91.49
2nd Support – 91.92
Stop-Loss: To manage risk, place a stop-loss order below 90.35. This helps limit potential losses if the price unexpectedly reverses and breaks back upwards.
Your likes and comments are incredibly motivating and will encourage me to share more analysis with you.
Best Regards, KABHI FOREX TRADING
Thank you.

XAGUSD. Trading opportunityHello traders and investors!
Daily Timeframe Analysis
On the daily timeframe, the price has formed a sideways range that began in April. The upper boundary is 32.5185, and the lower boundary is 26.0185. The buyer's vector 8-9 has reached the target of 31.755 (see the previous post). There are no signs of a reversal yet to indicate the realization of the seller's vector 9-10, with a potential target of 26.471.
4H Timeframe Analysis
On the 4-hour timeframe, the price has formed a sideways range below the level of 31.755. The upper boundary is 31.4335, and the lower boundary is 29.7085.
Currently, the buyer has broken through the upper boundary of the range. If the buyer defends the 31.4335 – 31.755 range, it is possible to look for buying opportunities, with a potential target of 32.5185.
Good luck with your trading and investments!

BNBUSDT. Trading opportunityHello traders and investors!
Daily Timeframe Analysis:
On the daily timeframe, the sideways movement that began in March continues. The upper boundary is 721.8, and the lower boundary is 495.8. The buyer's vector 10-11 is relevant, with a potential target of 645.2.
Two days ago, the buyer overcame 598 and reached 605.6, where volume accumulation started. If the buyer defends 598, the next targets are 635 and 645.
Hourly Timeframe Analysis:
On the hourly timeframe, there is an uptrend. The level marking the beginning of the last buyer's impulse is 587.9. I will be watching the buyer's reaction at the levels of 598 and 587.9.
Good luck with your trading and investments!

NZDUSD SHORT TRADE OUTLOOK (SEPT. 24-27)>The New Zealand Dollar experienced an explosive rally today, deeply penetrating and ultimately invalidating the highlighted supply zone, indicating the exhaustion of any remaining unfilled orders.
>We can now observe five invalidated supply zones lined up on the chart.
>Above these zones lies a high-quality, fresh supply zone, where significant stop-loss orders and a large volume of sell orders could potentially accumulate in anticipation of the upcoming FED speech on Thursday, which may act as a catalyst for a sharp drop.
>The US Dollar Index remains undervalued ( refer to my USD analysis for more insights ).
>Given that the NZD is currently overvalued, the price may soon seek reasons to turn bearish. For this to happen, a considerable volume of sell orders will be needed to trigger a downward move.
***As always, trade safe and make sure to do your due diligence when analyzing the charts.***

Trade idea - EURAUD Long4H
Bullish impulse / break of last LH: indication.
Inverse Head & Shoulders pattern: confirmation.
Clear support & resistance zone is there.
From 1H perspective: Corrective approach towards entry zone.
= Buy limit.
1.5% risk.

What Hidden Forces Are Reshaping the Soybean Market’s Future?The soybean market stands at a crossroads, where familiar patterns of supply and demand are being challenged by a web of global forces. U.S. crops, though abundant, face domestic difficulties as adverse weather threatens yield projections. South America, poised to increase production, is battling its climate concerns, leaving traders and analysts questioning what the true state of global supply will be. Despite the current pessimistic outlook, is there more to this story than meets the eye?
On the demand side, the rising global appetite for vegetable oils, fueled by population growth and the biofuel industry, adds another layer of complexity. Yet, regulatory changes like the EU’s deforestation rules and China’s ongoing economic struggles continue to shape the trade landscape. How will these evolving dynamics impact global soybean trade flows, and what are the risks and opportunities hidden within?
As technological advancements in biotechnology and precision agriculture push the boundaries of efficiency and productivity, the soybean market finds itself on the cusp of transformation. Investors and traders must decipher this intricate puzzle, where geopolitical shifts, weather risks, and innovation collide. Will those who grasp the nuances of these forces be the ones to seize the emerging opportunities?

Sell GBPCHF Channel BreakoutThe GBP/CHF pair on the M30 timeframe presents a potential selling opportunity due to a recent downward breakout from a well-defined Bearish Channel pattern. This suggests a shift in momentum towards the downside in the coming Hours.
Key Points:
Sell Entry: Consider entering a short position around the current price of 1.1304, positioned close to the breakout level. This offers an entry point near the perceived shift in momentum.
Target Levels:
1st Support – 1.1220
2nd Support – 1.1188
Stop-Loss: To manage risk, place a stop-loss order above 1.1350. This helps limit potential losses if the price unexpectedly reverses and breaks back upwards.
Your likes and comments are incredibly motivating and will encourage me to share more analysis with you.
Best Regards, KABHI FOREX TRADING
Thank you.

Sell EUR/AUD Bearish ChannelThe EUR/AUD pair on the M30 timeframe presents a potential selling opportunity due to a well-defined Bearish Channel pattern. This suggests a shift in momentum towards the downside in the coming Hours.
Key Points:
Sell Entry: Consider entering a short position around the current price of 1.6370, positioned close to the breakout level. This offers an entry point near the perceived shift in momentum.
Target Levels:
1st Support – 1.6300
2nd Support – 1.6260
Stop-Loss: To manage risk, place a stop-loss order above 1.6400. This helps limit potential losses if the price unexpectedly reverses and breaks back upwards.
Your likes and comments are incredibly motivating and will encourage me to share more analysis with you.
Best Regards, KABHI FOREX TRADING
Thank you.
