Trade idea - AUDUSD short4H
Corrective approach towards entry zone.
-68 Fibonacci completion aligning with entry zone .
= Sell limit.
Bearish Fake Out flag also there as extra evidence.
0.5% risk.
Aiming to take full profit at Daily TP.
Supply_and_demand

AAEVE 1W | HTF UpdateThis is a good time to accumulate ( DCA ) AAEVE here at this level.
Do not bee greedy DCA is the king.
Happy Trading

EurUsd BuyThe pair has followed its bullish path as in my previous anylisis i have identified its crucial point from the pair has shot up and moving in its bullish path we have also witnessed a FVG over daily bullish move which has been mitigated by the pair in last week the weekend is over and back to the market we are ready to catch up a awaiting bullish move confluence for the bullish move is first FVG and 2nd is price has completed its retracement to the 50% of Fibbo level on daily TF so there are higher probabilities for price to go higher to its historical cum physiological resistance so we are monitoring price very closely so that we can save our capital and gain profits
Good for the week guys

Gold Buying opportunity As i said previously in my previous anylisis gold has made a beautiful rally downards and will fly over again from its physiological H4 to H1 support level at 2500 and gold also did that it rejected the level and now will move upwards to its immediate resistance level of 2519 and if price breaks above 2519 level it will shoot for 2530 physiological level then it could go for 2550 physiological level so we are bullish this week on gold 🪙

Ethereum - Bearish M-Pattern, DEMAND Zone ApproachingETH is still correcting after the bearish chart pattern (M-Pattern) formed.
The next major demand zone is identified two ways:
✅- Connected with the longstanding diagonal trendline, which acts as a support
✅- Bounce zone for previous major candle wick
✅- Previous resistance, then support, now about to be retested as support
As a first stop, the lower white trendline can be used as a price range guage:
Remember that the price will remain bearish until daily candles start to close ABOVE the red trendline, in which event it will turn green.
________________________
COINBASE:ETHUSD BINANCE:ETHUSDT

AAVE. Trading opportunityHello traders and investors!
The token has reached all targets, and the previous analysis is no longer relevant. It's time to create a new one.
Daily Timeframe
On the daily timeframe, the price has formed a sideways range, which started in March. The upper boundary is at 133.94, and the lower boundary is at 70. The current seller's vector is 12-13, with a potential target of 71.06 (70).
On August 21, the price broke above the upper boundary of the range with significant volume. However, the seller pushed the price back into the range and established a seller's zone at the upper boundary of the range on August 27 (red rectangle on the chart). At the same time, the seller tested the buyer's candle from August 19 (which was on increased volume) at the test level of 117.15. Yesterday, the buyer moved up to test the seller's zone, and the seller resumed from the 129 level. This might become the test level if a bearish candle forms today.
Hourly Timeframe
On the hourly timeframe, the price has also formed a range. The upper boundary is at 129, and the lower boundary is at 117.15 (which coincides with the daily test level). The current seller's vector is 6-7, with a potential target of 121.32. In ranges, it's advisable to trade from boundary to boundary if the boundary is defended.
Sell opportunities can be looked for from the seller's defense of the upper boundary at 129.
Buy opportunities can be considered from the buyer's defense at 121.32 and 117.15.
Good luck with your trading and investing!

Trade idea - EURUSD Long1H
Corrective approach towards entry zone.
Market moving in Bull Flag formation.
= Instant market execution Buy.
0.5% risk.

Bullish on GBPJPYLooking for price to trade to the discount price. Wait for candle stick entry to take to the buy side liquidity.

Trade idea - EURCAD Long1H
Corrective approach towards entry zone.
-68 Fibonacci completion aligning with entry zone.
= Instant market execution Buy.
0.5% risk.

NEARUSDT. Buying opportunitiesHello traders and investors!
If you are looking to buy, I suggest considering NEAR. I believe there is a good potential for growth of 20-40%.
Daily Time Frame
On the daily time frame, the price has formed a sideways range that started in March. The upper boundary is at 8.52, and the lower boundary is at 4.279.
The price has touched the lower boundary twice. The second interaction, which occurred on August 5, was marked by impressive volume, which was absorbed by the buyer on August 13, pushing the price back into the range. This candle was pivotal (the largest volume, marked with “KC” on the chart) in the seller’s impulse, which forms vector 4-5 of the range. By absorbing this candle, the buyer established a buying zone (green rectangle on the chart) from which buyer's vector 5-6 started, with a potential target of 6.89.
The buyer faces a significant obstacle beginning at the 50% level of the last seller's impulse, at 5.798. At this same level, a seller’s zone (red rectangle on the chart) has formed, and the level 5.798 is the start of the last sub-impulse of the seller's last impulse.
Interestingly, the last sub-impulse of the buyer started at the 4.000 level (low of the sub-impulse at 4.000, high of the sub-impulse at 6.489), and on August 5, liquidity was taken below the 4.000 level.
4-Hour Time Frame
There is a long trend. The starting level of the buyer's last impulse is at 4.738. A seller's zone formed at the end of this impulse. Currently, the buyer is testing this zone. If the price returns to 4.738 and the buyer defends this level, there may be buying opportunities, as the seller resumed action from the seller’s zone at the end of the impulse (meaning the zone has been tested), and the seller could not defeat the buyer at the beginning level of the last impulse.
Buying Strategy
It makes sense to look for buys from the daily candle of August 23, which showed a surge in volume. The targets are 6.000 and 6.489.
Good luck with your trading and investments!

Origins in Supply and Demand - Flag Chain ConceptsI have been using approaches like this for some time now. I hope you find it useful.
Thanks

Euro can rebound up from buyer zone to 1.1190 pointsHello traders, I want share with you my opinion about Looking at the chart, we can see how the price hit the support level, broke through it, but then quickly turned around and dropped to the lower part of the range. After that, the EUR reversed and bounced back up to the 1.0960 level, broke it again, exiting the range, and then climbed to the resistance line. The price then reversed and made a correction move to the support line, after which it started to rise near this line to the current support level. When the Euro reached this level, it broke through and kept rising until it hit the resistance line, but not long ago it turned around and made a correction move to the buyer zone. Right now, the price is trading near this zone, and I think the EUR might drop to the buyer zone before rebounding up. So, that's why I set my TP at 1.1190 points. Please share this idea with your friends and click Boost 🚀

Trade idea - AUDCHF Long4H
Corrective approach towards entry zone.
-27 Fibonacci completion aligning with entry zone.
= Instant market execution Buy.
1% risk.
Aiming to take full profit at Daily TP.

MATICUSD tested the June 2022 Historic SupportMATICUSD has reached a demand zone last tested in June 2022. The market formed a long-tailed bar on the weekly timeframe, signaling a rejection of this level and the potential for a bullish move. Additionally, it broke and closed above the accumulation zone, which is another encouraging sign. If the price stays above the 0.400 level, the market could rise to retest the resistance. There’s potential for a breakout from the channel, continuing its bullish trend. Pay attention to the August close, as the monthly chart is shaping another significant long-tailed bar. The target is the resistance at 0.500

Some ES Intrady Supply Demand TradingIn all of my price reading adventures, I like to really keep things simple. I use methods from an old supply and demand community I was once apart of back in 2013 known as RTM (Read the Market).
Fun stuff. Hope you like it.

XAGUSD. Trading opportunity Hello traders and investors!
I reviewed the assets and highlighted silver as an interesting opportunity for trades next week. For example, in gold, on the daily timeframe, the price has broken out of a range, and it’s hard to predict how far it will go. In silver, the targets are clearer.
Weekly Timeframe
On the weekly timeframe, there’s a bullish trend. The last upward impulse started from the 17.559 level. The most recent sub-impulse within that impulse began at the 26.0185 level. At the end of the impulse, a seller's zone formed after the seller absorbed a buyer's candle with growing volume, which has already been tested by the buyer—the test level is 29.2285 (seller's zone marked by a red rectangle on the chart). The seller's candle at the test level had the highest volume in a year, but the result was just a shadow: the body of the candle couldn’t close below the shadow of the previous candle. The latest weekly candle, with falling volume, absorbed the seller’s candle. This indicates that although the seller tried to resume the downward movement from their zone, they have been unsuccessful so far.
Daily Timeframe
On the daily timeframe, the price has formed a range that began in April. The upper boundary is 32.5185, and the lower boundary is 26.0185.
The seller’s 7-8 impulse has played out, and now the buyer's 8-9 impulse is active, with a potential target of 31.755. A buyer's zone has formed at the base of the new 8-9 buyer’s impulse after the buyer absorbed the seller's candle from August 5th, which had growing volume (buyer’s zone marked by a blue rectangle on the chart). Note the volume of the seller’s candle from August 5th—it’s the highest in several months.
Thus, on both the weekly and daily timeframes, the priority is on buying .
There are obstacles on the buyer's path that need to be monitored. The first obstacle is the start of the last sub-impulse in the seller's 7-8 impulse (29.2285), and the second obstacle is the previous weekly high (30.1365), where a seller's zone has also formed.
Buying Strategy
For trade setups, you could consider the 4-hour timeframe. On this timeframe, the price has formed a range with an upper boundary of 29.2285 and a lower boundary of 26.4710.
You could, for example, look for buying opportunities from the buyer’s defense of the lower boundary of the range or after a breakout to the upside and the buyer's defense of that breakout.

Trade idea - AUDCAD Long4H
Bullish impulse: indication.
Pattern within pattern: confirmation.
Inverse Head & Shoulders pattern + Bullish Fake Out flag pattern.
Clear support & resistance zone is there.
-68 Fibonacci completion aligning with entry zone.
Corrective approach towards entry zone.
= Buy limit.
1% risk.
RBA Gov Bullock speaks at 1.30 AM. Be aware.

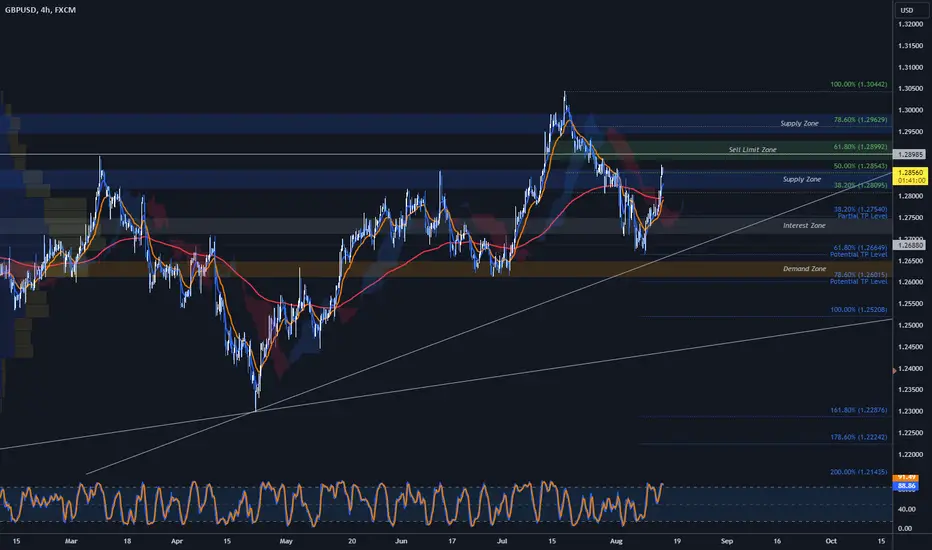
$GBPUSD | Sell Trade H4 | Execute & Sell Limits |Technical Confluences:
- Price action is between a 50 - 61% Fibo retracement range
- Horizontal trendline coincides with the 61% Fibo retracement levels
- Price is also at a Supply Zone range
- Stochastics on the H4 is in Overbought conditions
Fundamental Confluences:
- Market is reeling with the optimism of incoming FED cuts but FED seems to feel differently based on the few FED speaker's speeches
- The riots in the UK will definitely have some economic drag on the GDP
________________________________
Will be executing my 1st sell entry into FX:GBPUSD and set Sell Limit orders as show in the charts.
Targeting to TP approximately half the position at the 38% Fibo Extension levels (in blue) and move my SL levels to B/E.
Full TP are the 61%/78% Fibo Extension levels.
Remember, DYOR.
________________________________
Boosts 🚀, Follows ✌️, Shares 🙌 & Comments ✍️ are much appreciated!
If you have any ideas or charts, do share them in the 'Comments' section below and we can discuss our perspectives to improve or strengthen our strategies.
If you want something analyzed, do drop me a DM. :D
________________________________
Disclaimer: The above suggestion is an personal opinion in general and does not constitute as investment advice. Any decisions taken based on the above suggestion is purely your own risks. DYOR.
XAUUSD - Resistance Sell Short Term, Long Term BuysXAUUSD is trading at key areas, this is a great time to intra-day trade gold.
Personally i'm waiting for XAUUSD to either breakout at the higher level, there i would be looking for new key zones to trade off, or reject the key level and drop down to the support zone.
I believe dropping to the support zone will happen, regardless if the market breaks out above, as there is non liquidation candle sticks near the lower key resistance level that will be tapped given enough time.

The Leap Week 2Gold Swing Zone set.
But price action determines trades
Currently sitting @ 5879: www.tradingview.com

GOLD | supply zone in control Am expecting gold to tap in to 2458.50 - 2432.42 supply zone to 2390.18 - 2381.28 demand zone

Bullish Reversal on USD/JPY"Based on the demand and supply zones strategy, we anticipate a bullish reversal in USD/JPY. After a significant downward movement, the price has reached a key demand zone, where buyers typically step in, creating upward pressure. Historically, these zones have acted as strong support, leading to substantial rebounds. Current market sentiment, combined with the oversold condition, suggests that buyers will overpower sellers, pushing the price upwards. This spike is likely to gain momentum as more traders recognize the opportunity and enter the market."
"Please note that the information provided is for educational purposes only and should not be considered as financial advice. Market predictions are inherently uncertain, and trading involves risk. I am not responsible for any financial losses or damages that may result from trading decisions based on this analysis. Always conduct your own research or consult with a professional financial advisor before making any investment decisions."

Alikze »» XAUUSD| Reverse pattern🔍 Technical analysis: Reverse pattern
- It was mentioned in the 1H time frame according to the analysis presented before . that wave C can extend as a three-wave or five-wave to the green box range target.
- As you can see, wave C has corrected in three waves and accelerated to the green box.
- Currently, there has been a return wave after creating demand in the green box.
- Considering that it has had a three-wave correction up to the golden zone, it can be expected to have a movement cycle up to the 0.78 Fibo range.
💎 In addition, in case of failure of Fibo 0.78, it can advance to the specified supply area.
»»»«««»»»«««»»»«««
Please support this idea with a LIKE and COMMENT if you find it useful and Click "Follow" on our profile if you'd like these trade ideas delivered straight to your email in the future.
Thanks for your continued support.
Best Regards,❤️
Alikze.
»»»«««»»»«««»»»«««
OANDA:XAUUSD
