GBP/USD|HTF Analysis| Monday, 15 April 2024GBP/USD
-gbp/usd have supply above the price
-price have IMB and lq above it
-If the price mitigate our supply don't enter without confirmations
Supply_and_demand

Sell EURCAD ECB Interest RateThe EUR/CAD pair on the M30 timeframe presents a potential selling opportunity due to the presence of a well-defined bearish channel pattern. This pattern suggests ongoing selling pressure and a higher likelihood of further declines in the coming minutes or hours.
Key Points:
Sell Entry: Consider entering a short position (selling) below the broken support level of the channel, ideally around 1.4700. This offers an entry point close to the perceived shift in momentum.
Target Levels: Initial bearish targets lie at the previous support levels within the channel, now acting as potential resistance zones:
1.4656: This represents the first level of support within the channel.
1.4628: This is a further extension of the downside target, based on the height of the recent price movement before the breakout.
Stop-Loss: To manage risk, place a stop-loss order above the broken support line of the channel, ideally around 1.4720. This helps limit potential losses if the price unexpectedly reverses and breaks back upwards.
Thank you

Alikze > FIL | Wave 3 or C continues bullishIn time D1 and W1, it is moving in an ascending channel. In continuation of the analysis of the previous post, where we examined the upward micro-waves of wave C, in this post, the long-term trend of the currency is placed in the 3rd big wave or C, in the long term. Pay attention to this wave, regardless of the fact that it will have small corrections in the low times, the target of $12.5 must touch 100% of the wave. It has completely broken the supply area of 6.25 and is currently in the supply area of its previous ceiling, which you can enter the upward trend until the target range of 1.28 and 12.5 dollars.
So I will try to provide the necessary updates for the post in the low times.
🟩Sup: 6.25 ~ 7.03
⛳️Tp 1:10.28
⛳️ Tp2 : 12.5
⛳️ Tp3 : 16.886 ~ 19.530
-----------------
Please support this idea with a LIKE and COMMENT if you find it useful and Click "Follow" on our profile if you'd like these trade ideas delivered straight to your email in the future.
Thanks for your continued support.
Sincerely.❤️

EURUSD SELL SETUPEU gave a solid break of structure here on the daily. Going in line with bullish DXY; watch for the pull back or retest for the next bearish wave down!

ETHUSDT. Are waiting for a buyerOn the daily timeframe we have a sideways market. The bearish vector 5-6 has been played out. After the price interacts with the level of 3200 and the buyer’s strength shows, we can consider long positions with a target of 3722.

AVAXUSDT. Looking for salesHello traders and investors!
On the daily timeframe, we observe a sideways trend. The buyer's vector 4-5 has played out. The price is at the upper boundary of the sideways trend, and we can consider looking for sales as an idea to implement the seller's vector 5-6 with the first target at 40.07 (then 34.83, 32.3). After the previous review, we notice a strong resumption of the seller from the upper boundary of the sideways trend at 49.96. I anticipate that the price will test the local minimum of 44.97.
On the daily timeframe, we also see a sideways trend. The current seller's vector is 8-9 with the first target at 45.17.
It's preferable to look for sales from the upper boundary of the sideways trend on the hourly timeframe, ideally from the seller's protection level at 48.17. Alternatively, look for sales below the level of 44.97 in the absence of buyers there.

ORDIUSDT. Looking for salesOn the daily timeframe, there is sideways movement. The bearish vector 7-8 is relevant.
On the hourly timeframe, there is sideways movement. The bearish vector 11-12 is relevant.
I believe that we will see a bearish movement.
Sales should be looked for in the red zones - seller zones (blue zones - buyer zones).
Targets on the hourly timeframe - 61, 60.
Targets on the daily timeframe - 55.2, 49.

EURUSD. Medium-term analysisOn the weekly timeframe, we have a sideways market. The current short-term trend vector is 5-6

Alikze »» UNI | Pullback to broken structureIn the daily and weekly time, a motivational wave has taken place after the break of the dynamic trigger, which has been extended to the area of the weekly supply of this wave after the pullback.
🔰 Currently, after the failure of the area, there is a correction that this correction form can be in the green box area, after completing it, it can retest the supply area, which in case of failure can continue until the next area of the supply area.
🔰 If the green box is broken, this correction can continue up to 0.50 fibo of the previous wave, which can touch it if the next area continues.
Therefore, according to the correction structure, this form can continue up to the green box area after an upward correction.
»»»«««»»»«««»»»«««
Please support this idea with a LIKE and COMMENT if you find it useful and Click "Follow" on our profile if you'd like these trade ideas delivered straight to your email in the future.
Thanks for your continued support.
Sincerely.❤️
»»»«««»»»«««»»»«««

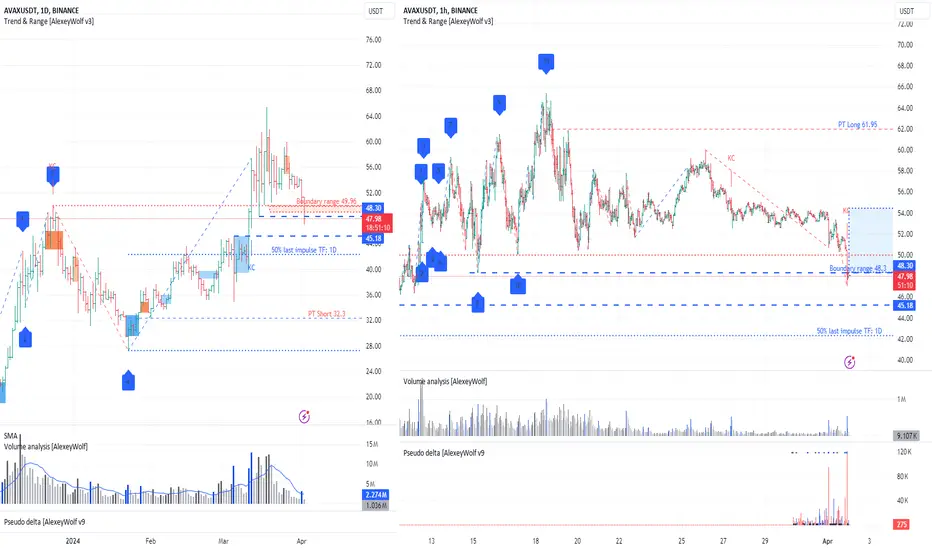
AVAUSDT. We have context for both selling and buying. It's an interesting situation. We have context for both selling and buying.
On the daily timeframe, there's a sideways movement (upper boundary - 49.96). The price has now returned to it, but the daily candle has not yet closed. If the daily candle closes inside the sideways movement, then we can look for sales, and the bearish vector 5-6 with a target at 32.3 will be relevant. There are two threats for the bears along the way in the form of buyer zones (blue background). The first one is at 48.3, which is currently being interacted with. The second threat is the buyer zone with the upper boundary at 45.18.
On the hourly timeframe, the price is at the lower boundary of the sideways movement (48.3). The bearish vector 11-12 has played out. The launch of the bullish vector 12-13 with a target at 61.95 is possible.
In summary, the daily and hourly buyer levels coincide (48.3). If the buyer shows itself at this level, then we can consider buying, taking into account the seller zones on the daily chart (red background). If the seller defends the breakout of the level 48.3, then we can consider selling, taking into account the daily buyer zone (upper boundary 45.18), inside which, by the way, lies 50% of the last daily buyer impulse.
For a more detailed explanation of how to read charts and consider different timeframes when looking for trades, you can refer to the article
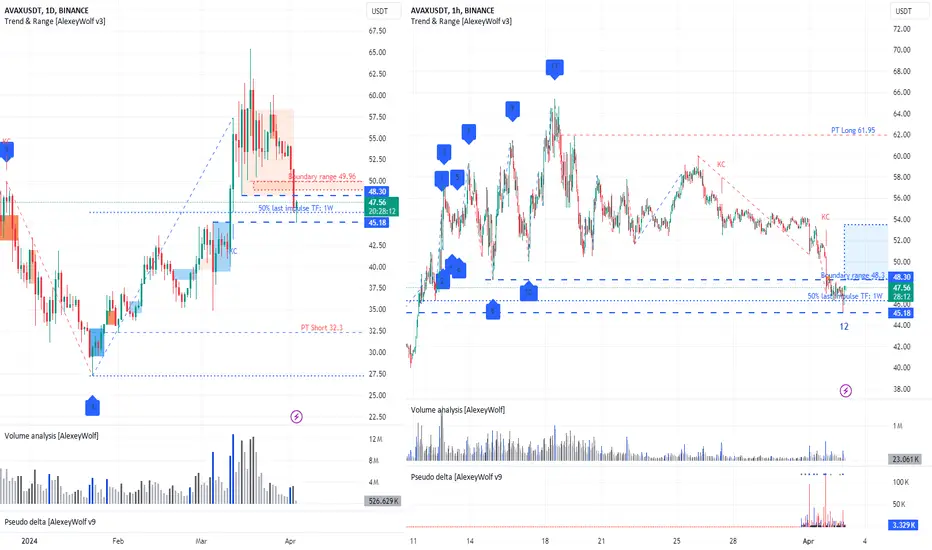
AVAXUSDT. On the Daily timeframe, selling takes precedenceOn the daily timeframe, we see a sideways movement with the upper boundary at 49.96. The price has been above the upper boundary for the last 20 days, but yesterday it returned to it and stopped at the 50% level of the last buyer's impulse on the weekly timeframe. This is clearly visible on the hourly timeframe:
At the top, a seller's zone has formed with the upper boundary at 48.3 (red background), and at the bottom, a buyer's zone with the upper boundary at 45.18 (blue background). I anticipate price interaction with the seller's zone of interest. If the seller defends the range of 48-50, we can consider the possibility of sales, and the bearish vector 5-6 will become relevant with a target at 32.3. However, on the way to this target, sellers may be hindered by the buyer's zone, with which there was just interaction and a bullish reaction began, as clearly seen on the hourly timeframe.
On the hourly timeframe, the price is below the lower boundary of the sideways movement at the level of 48.3. The bearish vector 11-12 has already played out, and we can expect the launch of the bullish vector 12-13 with an ambitious target at the level of 61.95 (ambitious, because the buyer will have to overcome the seller's zone on the daily timeframe). To launch the bullish vector, the buyer needs to raise the price above the range of 48-50 and protect it.
For a more detailed explanation of how to read charts and consider different timeframes when looking for trades, you can refer to the article
BTCUSDT. Monitoring the seller's actions.Hello traders and investors!
It's time to update the forecast. During the last review (23/03/2024), we observed a short vector 7-8 within the sideways movement on the daily timeframe. The target of the long vector 8-9 was 72419 (see the chart from the previous review). Currently, the long vector 8-9 has reached this target.
It is advisable to look for sales at the upper boundary of the sideways movement. However, for short positions, the first threat is the buyer zone (blue color) with the upper boundary at 69674, which formed on the daily timeframe. And the seller has not yet shown itself on the hourly timeframe - the price at 17 hours is near the level of 72419.
There is a high probability that the buyer will reach the upper boundary of the sideways movement at 73777. I am waiting for a reinteraction of the price with the level of 72419.
For a more detailed explanation of how to read charts and consider different timeframes when looking for trades, you can refer to the article

BTCUSDT. Short term analysisHello traders and investors!
On the daily timeframe we see a resumption of buyers from the buyer's zone (blue background) with an upper boundary of 69674.
On the hourly timeframe, a sideways trend has formed, where the buyer's vector 4-5 has already reached the obligatory target. Searching for sales is risky because there is a resumption from the buyer's zone on the daily timeframe. It is not systematic to look for purchases at the upper boundary of the sideways.
It is better to look for purchases at the lower boundary of the sideways trend, for example, from the buyer's protection levels at 69071, 67518.
Sales are advisable to look for below the level of 67518 as an idea for implementing the seller's vector 9-10 of the sideways trend on the daily timeframe with the first target at 64493 (second - 60775).
As before, I am waiting for a repeated interaction of the price with the level of 72419.
By the way, purchases could be found yesterday on the 30-minute timeframe (see the chart).

Buy EURJPY Bullish ChannelThe EUR/JPY pair on the M30 timeframe presents a potential buying opportunity due to the presence of a well-defined bullish channel pattern. This pattern suggests ongoing buying pressure and a higher likelihood of further gains in the coming minutes or hours.
Key Points:
Buy Entry: Consider entering a long position (buying) above the broken resistance level of the channel, ideally around 164.75. This offers an entry point close to the perceived shift in momentum.
Target Levels: Initial bullish targets lie at the previous resistance levels within the channel, now acting as potential support zones:
165.40: This represents the first level of resistance within the channel.
165.70: This is a further extension of the upside target, based on the height of the recent price movement before the breakout.
Stop-Loss: To manage risk, place a stop-loss order below the broken resistance line of the channel, ideally around 164.50. This helps limit potential losses if the price unexpectedly reverses and breaks back downwards.
Thank you

BTC/USD Short position #1Price reacted to the higher timeframe supply zone and it breaks the bullish trendline.
Now we have a fresh FTR zone - $70398 / $70948 .
any reactions to this zone my be a good chance to enter a short positions

ETHUSDT. Looking for purchasesOn the daily timeframe we have a sideways market. The bearish vector 5-6 has been played out. The price has already interacted with the level of 3200. Priority is given to considering purchases, preferably from the zone between 3200 and 3400, with the initial target at 3722.

ETHUSDT. Monitoring the seller's actions.Hello traders and investors!
It's time to update the forecast. During the last review (22.03.2024), we observed a short vector 5-6 in the sideways trend on the daily timeframe. The target of the long vector 6-7 was 3722 (see the chart from the last review). Currently, the long vector 6-7 has reached this target. At the top, there is a seller's zone with a lower boundary of 3722 (red background). So far, we haven't seen any reaction from the seller in this zone.
It is advisable to look for sales at the upper boundary of the sideways trend. However, for short positions, the first threat is the buyer's zone (blue color) with an upper boundary of 3505, which formed on the daily timeframe. There is a high probability that the buyer will reach the level of 3822.
On the hourly timeframe, a sideways trend has formed with boundaries of 3727 and 3665. I am waiting for the price to interact with these boundaries. We can look for a trade opportunity based on the protection of these boundaries.
For a more detailed explanation of how to read charts and consider different timeframes when looking for trades, you can refer to the article

$CRYPTO:PEELUSD long (based on SMC)CRYPTO:PEELUSD (Peel) is a cryptocurrency renowned for its high volatility, presenting both significant risks and lucrative opportunities for investors. The coin's volatility is central to its appeal, attracting traders looking to capitalize on price fluctuations. The investment strategy behind Peel/USD is grounded in the Smart Money Concept (SMC), a methodology that seeks to exploit market inefficiencies and capitalize on shifts in supply and demand dynamics.
At the time of entry, Peel/USD is positioned at 0.01240, leveraging the demand zone identified within the daily timeframe. This strategic entry point is crucial, as it aligns with the principles of SMC, aiming to enter the market at opportune moments to maximize profit potential.
The primary profit-taking strategy involves setting a target price (TP) at 0.03642, representing a substantial upside potential from the entry point. However, it's imperative to adopt a staggered approach to profit-taking, securing gains at intervals leading up to the full TP. This mitigates risk and ensures that profits are locked in along the way, safeguarding against sudden market reversals.
Given the inherent volatility of Peel/USD, implementing a manual stop-loss (SL) strategy is advisable. While a predefined SL based on a 3% loss can be considered, it's crucial to acknowledge the heightened likelihood of SL triggers due to the coin's erratic price movements. Traders must exercise caution and monitor market conditions closely to adjust SL levels accordingly, minimizing potential losses while maximizing profit potential within this dynamic trading environment.

GBP/JPY|HTF Analysis| Sunday, 7 April 2024GBP/JPY
-gbp/jpy have imb under the price
-if this demand get broken then more analysis is needed for bias
-If the price mitigate our demand don't enter without confirmations

Fib Retracement - better/important than most believeFibonacci.
introduced by Italian mathematician "father of the Fibonacci sequence" Leonardo Da Pasa (born around A.D. 1170) in 1202 in his book Liber Abaci "book of calculations" which he handwrote as the printing was not yet invented, which also became the first book to be introduced to the Hindu-Arabic numeral system as it was a new way to write numbers and do calculations.
Fibonacci in trading.
the most important/popular fib tool in the trading/investing community is the Fibonacci Retracement applied from the Fibonacci sequence which is a set of steadily increasing numbers where each number is the sum of the preceding 2 numbers.
Fibonacci retracement, is derived based on high and low price/ valley and peak in supply and demand terms.
The most important Fibonacci ratios/percentage of the retracement measure is - 23.6%, 38.2%, 50%, 61.8%, 100%, with the ratio/percentage being represented by horizontal lines on the price chart.
calculated by :
in bull market, high price - (high price-low price) x percentage
in bear market, low price + (high price-low price) x percentage
Significance of Fib Retracement.
these are very important too traders as the indicate significant price levels/areas like :
- support and resistance
- liquidity pool - using rectangle drawing tool to connect two fib retracement levels together as a zone not a singular ratio level. based on current market conditions and trading criteria.
- price targets, exit price (Take Profit)
- Stop Loss
- stop and limit orders (set and forget for supply and demand traders)
Fibonacci retracement also compliments other trading tool and indicators well and can be used by all sorts of traders, from position traders to scalpers. it works best on trending market conditions to identify reversals, corrections, pullbacks continuation moves.
important note :
- Leonardo did not invent Fibonacci, it was actually used and known to Indian mathematicians since the 6th century.
- the 50% is not really a Fibonacci number instead is taken from Dow theory that assets usually retrace half their prior move.
put together by : Pako Phutietsile as @currencynerd

Why did HPE Breakout?As shown on the one-hour chart, in the last trading session, HPE broke out of its usual trading
the range being the blue high-volume area on the profile. This is with increased volatility as
shown by the indicator and the large top wicks on the rising green candles. Why did this
occur? Were traders simply buying anything in the IT sector vaguely related to AI after the
NVDA breakout? Does HPE have a role in artificial intelligence? Was this a sympathy play?
The Luxalgo Supply / Demand indicator shows supply immediately overhead. The wicks on the
last several candles show a defined level. This might be called a " tweezer top " Overall,
I see this as an excellent short setup to be played with either short selling or a put option as the
retracement seems inevitable.

Alikze »» Yooshi | Breaking dynamic triggerIn time 1W, it is breaking the dynamic trigger and according to the guard it took in the first step, it will have the ability to grow up to the specified supply area. If the area fails, it will have the ability to reach its high supply areas. According to the momentum in the 3rd rising wave, this guard will continue until the initial areas.
»»»«««»»»«««»»»«««
Please support this idea with a LIKE and COMMENT if you find it useful and Click "Follow" on our profile if you'd like these trade ideas delivered straight to your email in the future.
Thanks for your continued support.
Sincerely.❤️

EURUSD EURUSD will continue to be affected by the release of US dollar news. Wait for the price to rebound from the support level to execute a successful buy deal.
