BITCOIN Outlook: Watch for a Drop Toward $85100COINBASE:BTCUSD has reached a key resistance level, an area that has been a key point of interest where sellers have regained control, leading to notable reversals in the past. Given this, there is potential for a bearish reaction if price action confirms rejection, such as a bearish engulfing candle, long upper wicks or increased selling volume.
If the resistance level holds, I anticipate a downward move toward 85,100$, which represents a logical target based on previous price behavior and market structure.
However, if the price breaks above this zone and sustains above it, the bearish outlook may be invalidated, leading to further upside.
Just my take on support and resistance zones, not financial advice. Always confirm your setups and trade with solid risk management.
Supply_and_demand

XAUUSD / GOLD | 15M | BULL | SCALPING TIMEHey There My Friend
SIGNAL ALERT
🚨BUY ( GOLD & XAUUSD ) 3091,0 / 3078,0 / 3066,0 / 3053,0
🟢TP1: 3093,0
🟢TP2: 3096,0
🟢TP3: 3156,0
🔴SL: 3043,0
High Risk - Yüksek Risk
Hey Guys, Please don't forget to like 🙏🏻

GBPUSD Discretionary Analysis: Going Up Like TariffsI’m not entirely sure, but something(or some news) tells me GBPUSD is heading up like tariffs – quick and sharp. If not, guess it got delayed at the border. Profit if I’m right, lesson if I’m wrong!
Just my opinion, not financial advice.

EURUSD Discretional Analysis: It's Going Up, BroIt's more of a gut feeling; I think it's headed up. If I'm right I'll make some money and if I'm wrong I'll lose some money.
Just my opinion, not financial advice.
NZDUSD Discretionary Analysis: No Parachute, Just GravityNo deep analysis here, just think it’ll fall without a parachute. If I’m right, I make some, if I’m not, I’ll just grab a coffee and wait for the next pair to make its move.
Just my opinion, not financial advice.

AUDCAD Discretionary Analysis: Taking the Elevator DownIt’s more of a sixth sense(like when you just know the milk is bad before you smell it). I think it’s headed down, like an elevator with a broken cable . If I’m right, I’ll make some money. If I’m wrong, well… guess I’ll take the stairs next time.
Just my opinion, not financial advice.

GOLD Technical Analysis - Correction Incoming?OANDA:XAUUSD is trading within a well-defined ascending channel, with price action now testing the upper boundary. This level could act as dynamic resistance, and a rejection here could trigger a corrective move toward the 3,035 support zone.
If buyers defend this support, the bullish structure remains intact, with a potential move back toward higher levels. However, if price breaks below this zone, a deeper pullback toward the lower boundary of the channel could come into play.
Monitoring candlestick patterns and volume at this critical zone is essential for identifying buying opportunities. Proper risk management is advised, always confirm your setups and trade with solid risk management.
If you have any thoughts on this setup or additional insights, drop them in the comments!

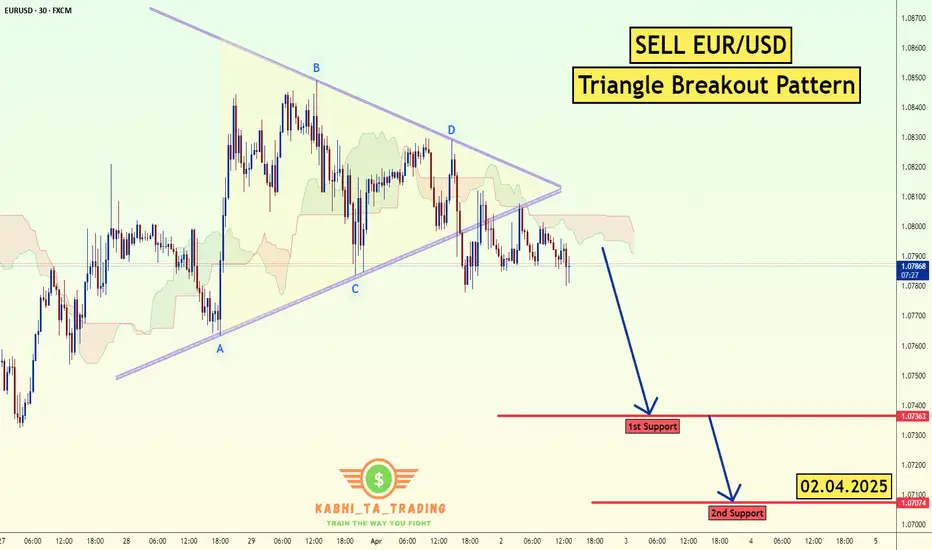
EUR/USD Triangle Breakout (02.04.2025)The EUR/USD Pair on the M30 timeframe presents a Potential Selling Opportunity due to a recent Formation of a Triangle Breakout Pattern. This suggests a shift in momentum towards the downside in the coming hours.
Possible Short Trade:
Entry: Consider Entering A Short Position around Trendline Of The Pattern.
Target Levels:
1st Support – 1.0736
2nd Support – 1.0707
🎁 Please hit the like button and
🎁 Leave a comment to support for My Post !
Your likes and comments are incredibly motivating and will encourage me to share more analysis with you.
Best Regards, KABHI_TA_TRADING
Thank you.
AUDUSD Discretional Analysis: It's Going Down, BroI don't know man, I have a feeling it's gonna go down. If I'm right I'll make some money and if I'm wrong I'll lose some money.
Just my opinion, not financial advice.

ALUMINIUM Discretionary Analysis: Sinking Like the TitanicI’m not entirely sure, but my gut says aluminium will sink even lower, faster than the Titanic. If not, guess it learned to float. Profit if I’m right, lesson if I’m wrong!
Just my opinion, not financial advice.

GBPJPY | 15M | SCALPING TIME | LIMIT ORDER Hey There;
SIGNAL ALERT
BUY LIMIT GBPJPY / 192,900 , 193,740
🟢TP1: 193,200
🟢TP2: 193,550
🟢TP3: 194,400
🔴SL: 192,257
RISK REWARD - 2,41
Please don't forget to like 🙏🏻💙

BITCOIN | 4H | KEY POINTS Hey traders, what's up
I've marked the key levels for Bitcoin on the chart. Right now, it's holding within the 4-hour supply and demand zone. But if this level breaks, I expect Bitcoin to drop all the way down to around $78K.
For spot buyers, there’s no real risk at the moment. But if you're trading on margin and currently in the red, be extra cautious.
The market will liquidate you first, then move on its way.
Big thanks to everyone supporting my analysis with likes
I will provide continuous updates under this analysis.

DOGEUSDT | 1H | NOW IN SUPPORT ZONEHey traders
📉 Right now, Dogecoin is at a key support level. The 0.17514 zone is a critical support area, and we need to 👀 watch how it reacts from here.
📊 I believe this sharp drop happened due to the breakdown of the Head and Shoulders pattern.
⚠️ No need to panic—just wait for my analysis update!
⭐ Don’t forget to like 👍 so you don’t miss the next Dogecoin update! 🔔

EURCAD POSSIBLE BUY OPPORTUNITY Price has potentially reversed from the H4 perspective and is looking promising for a buy. The recent pullback that occurred, found support around 1.53000 and price currently trade at 1.55666. we are likely to see more growth in EURCAD upto the price level of

EURJPY Approaching Key Resistance — Potential Sell SetupOANDA:EURJPY is approaching a key resistance level, an area that has been a key point of interest where sellers have regained control, leading to notable reversals in the past. Given this, there is potential for a bearish reaction if price action confirms rejection, such as a bearish engulfing candle, long upper wicks or increased selling volume.
If the resistance level holds, I anticipate a downward move toward 161.20, which represents a logical target based on previous price behavior and market structure.
However, if the price breaks above this zone and sustains above it, the bearish outlook may be invalidated, opening the door for further upside.
Just my take on support and resistance zones—not financial advice. Always confirm your setups and trade with solid risk management.
Best of luck!

NZDJPY Approaching Key Resistance — Potential Sell SetupOANDA:NZDJPY is approaching a key resistance zone, a level where sellers have consistently stepped in, leading to notable bearish reversals in the past. This area is marked by strong selling pressure, increasing the likelihood of a bearish move if sellers regain control.
The current price action suggests that if the pair confirms resistance through signals like bearish engulfing candles, long upper wicks, or increased selling volume, we could see a downward move toward 86.100, which represents a logical target based on previous price behavior and market structure.
However, if the price breaks above this zone and sustains, the bearish outlook may be invalidated, opening the door for further upside.
Just my take on support and resistance zones—not financial advice. Always confirm your setups and trade with solid risk management.
Best of luck!

XAUUSD Breaking Records: Bull & Bear Setups for the New Month 🔥 Attention all traders!🔥
XAUUSD is on fire, breaking records with power! Here’s the latest update:
🔻 Bearish Outlook: Watch for a potential dip below the 3076-3078 range. If it falls, targets like 3050 and 3030 could be in play. Keep an eye on these support zones! 👀
🔺 Bullish Outlook: A breakout above this range could open up buying opportunities! Look for price action above 3084 with targets at 3097 and 3110. 🚀
New Month Open Candle: As we step into a new month, keep a close watch on the market open candle 📅. This could set the tone for the next move!
💡 Risk Management** is key! Always trade smart and protect your capital! 💰
Join the discussion and share your thoughts! Let's ride this golden wave together! 🌟

NZDUSD Discretional Analysis: It’s Gonna Drop, BroNo deep analysis here, just think it’ll go lower. If I’m right, I make some, if not, I lose.
Just my opinion, not financial advice.

BTC USD Time Frame Daily March 30, 2025The price has been at the Support Line & DBR Zone (SnD Board) and will rise until it touches Supply at $ 85,500 then will fall again to look for the next Demand

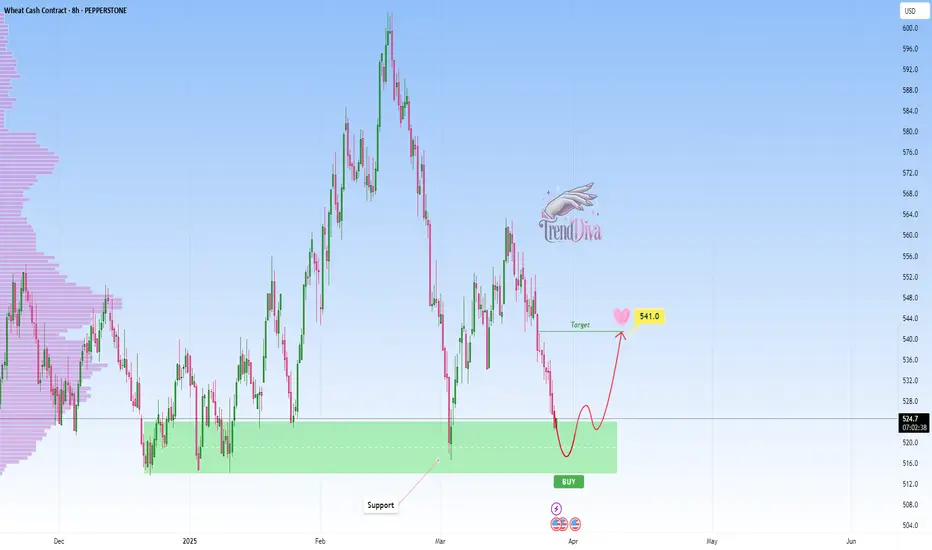
WHEAT at Key Support Level - Will Price Rebound to 541$?PEPPERSTONE:WHEAT has reached a major support level, an area where buyers have previously shown strong interest. This area has previously acted as a key demand zone, increasing the likelihood of a bounce if buyers step in.
A bullish confirmation, such as a strong rejection pattern, bullish engulfing candles, or long lower wicks, would strengthen the case for a move higher. If buyers step in, the price could rally toward the 541$ target. However, a decisive breakdown below this support would invalidate the bullish scenario and could lead to further downside.
This is not financial advice but rather how I approach support/resistance zones. Remember, always wait for confirmation, like a rejection candle or volume spike before jumping in.
Best of luck , TrendDiva
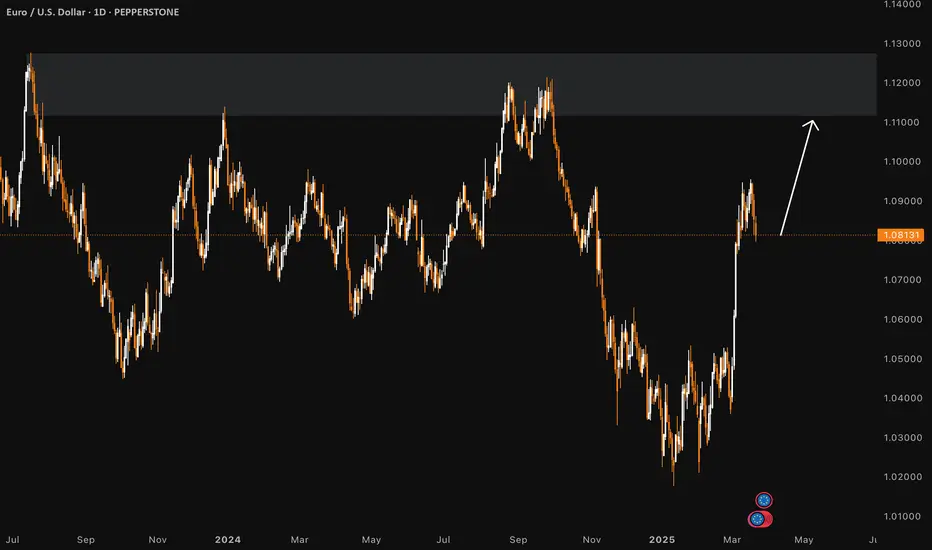
EurUsd- The "big" move is down, not upLast week, TRADENATION:EURUSD reached a high of around 1.09 and has been consolidating ever since, now for the fifth consecutive trading day. Despite some weak upward spikes, the pair remains in a range-bound phase.
From a technical perspective, multiple resistance levels lie ahead, with the psychological 1.10 mark acting as a key barrier. Given the current price action, I believe this consolidation is more likely to result in a downside breakout rather than a continuation of the uptrend.
There is a strong possibility that EUR/USD will correct the impressive rally that began in early March.
With this outlook in mind, I see more downside potential than upside and I am considering selling into rallies, targeting a move toward 1.07.
Disclosure: I am part of Trade Nation's Influencer program and receive a monthly fee for using their TradingView charts in my analyses and educational articles.

EURJPY Discretional Analysis: It's Gonna Go UpHonestly, I can’t fully explain it, but my intuition says it’s gonna go up. If I’m right, I’ll make a profit, and if not, I’ll take the loss and move on to the next trade.
Just my opinion, not financial advice.

CADCHF Discretionary Analysis: We're heading north!I don’t know how to explain it, but everything in me says, “this is going up!” 🚀 If I’m right—sweet profits! 💰 If not, I’ll take the loss like a champ and move on.
Just my opinion, not financial advice.
