Update gold time 1 hourI checked on the 15 minute time frame and saw liquidity points for us to consider trading, Gold price is being supported, candlestick patterns are showing signs of breaking resistance so consider volume for the sell-off plan. If you do not have a buy order in the idea below 👇
then set up a buy order according to this trading idea, good luck to you and us.
Supply and Demand
NASDAQ: Time For A Pullback?In this Weekly Market Forecast, we will analyze the NASDAQ for the week of July 14 - 18th.
The NASDAQ had a strong week, until Tariff Tensions Friday arrived.
This by itself doesn't mean we should start looking for sells. Just like the S&P 500, I'm expecting short term bearishness, as price goes from ERL to IRL.
With Tuesday CPI Data coming, this short term consolidation is to be expected until the news is announced.
Let the markets pick a direction, and flow with it.
Have a plan of action in place so you can react to the price action promptly!
Enjoy!
May profits be upon you.
Leave any questions or comments in the comment section.
I appreciate any feedback from my viewers!
Like and/or subscribe if you want more accurate analysis.
Thank you so much!
Disclaimer:
I do not provide personal investment advice and I am not a qualified licensed investment advisor.
All information found here, including any ideas, opinions, views, predictions, forecasts, commentaries, suggestions, expressed or implied herein, are for informational, entertainment or educational purposes only and should not be construed as personal investment advice. While the information provided is believed to be accurate, it may include errors or inaccuracies.
I will not and cannot be held liable for any actions you take as a result of anything you read here.
Conduct your own due diligence, or consult a licensed financial advisor or broker before making any and all investment decisions. Any investments, trades, speculations, or decisions made on the basis of any information found on this channel, expressed or implied herein, are committed at your own risk, financial or otherwise.

EUR/USD Sells from 1.17200 back downWeekly Outlook: EUR/USD (EU)
This week, my bias on EUR/USD is similar to GBP/USD, as both pairs have been following a consistent bearish trend. Based on this structure, I’ll be watching to see if price begins a retracement back into an area of supply.
I’ve marked out the 8-hour supply zone, which sits at a premium level and was responsible for the last break of structure to the downside. If price retraces into this zone, I’ll look for potential sell confirmations on the lower time frames.
If price doesn’t tap into the supply zone first, I’ll then shift my focus to the 8-hour demand zone below. In that case, I’ll watch closely for signs of accumulation and a bullish reaction from this level, which could signal the start of a rally.
Confluences for EUR/USD Sells:
✅ Bearish trend has been consistent for the past few weeks.
✅ Breaks of structure have formed new supply zones to trade from.
✅ Liquidity exists below current price, which may be targeted first.
✅ The lower demand zone remains unmitigated, suggesting further downside movement.
📌 On the way down toward demand, I expect price to form another break of structure to the downside. The plan is to ride the sells down into demand, then look for potential buy opportunities if price begins to accumulate and react.
Let’s stay sharp and disciplined — have a solid trading week, everyone! 📊

GBP/USD Shorts from 3hr/5hr supply zoneMy analysis this week centers around the continuation of the bearish trend we've been observing. Recently, there was a break of structure, and a new supply zone has formed—indicating a potential continuation of the downtrend.
I’ll be waiting for price to retrace back into these Points of Interest (POIs), where I’ll look for lower time frame confirmations to catch potential sell entries and ride the move down.
I believe there’s still some bearish pressure left, and I expect price to continue falling until it reaches the 6-hour demand zone. Once we approach that area, I’ll begin looking for Wyckoff accumulation patterns as a signal for a potential reversal or rally to the upside.
Confluences for GBP/USD Sells:
✅ GBP/USD has been bearish over the past few weeks, and this trend may continue.
✅ Breaks of structure have occurred, forming fresh supply zones ideal for entries.
✅ Liquidity exists below current price, which may get swept before a reversal.
✅ The lower demand zone still needs to be mitigated, suggesting more downside movement first.
📌 If price fails to react properly at the 3-hour supply, I’ll be watching for a move into the 5-hour supply zone, which sits in a more premium area and may offer a cleaner reaction.
Let’s stay patient and focused — wishing everyone a profitable trading week ahead! 📉💼

S&P 500: Time For A Pullback??
In this Weekly Market Forecast, we will analyze the S&P 500 for the week of July 14 - 18th.
The S&P 500 had a strong week, until Tariff Tensions Friday arrived.
This by itself doesn't mean we should start looking for sells. With Tuesday CPI Data coming, this short term consolidation is to be expected until the news is announced.
Let the markets pick a direction, and flow with it.
Have a plan of action in place so you can react to the price action promptly!
Enjoy!
May profits be upon you.
Leave any questions or comments in the comment section.
I appreciate any feedback from my viewers!
Like and/or subscribe if you want more accurate analysis.
Thank you so much!
Disclaimer:
I do not provide personal investment advice and I am not a qualified licensed investment advisor.
All information found here, including any ideas, opinions, views, predictions, forecasts, commentaries, suggestions, expressed or implied herein, are for informational, entertainment or educational purposes only and should not be construed as personal investment advice. While the information provided is believed to be accurate, it may include errors or inaccuracies.
I will not and cannot be held liable for any actions you take as a result of anything you read here.
Conduct your own due diligence, or consult a licensed financial advisor or broker before making any and all investment decisions. Any investments, trades, speculations, or decisions made on the basis of any information found on this channel, expressed or implied herein, are committed at your own risk, financial or otherwise.

SHORT ON SILVER XAG/USDSilver has given us a CHOC (change of character) on the lower timeframe with a nice retest to the supply zone.
Bears have shown up and I expect silver to drop seeking sell side liquidity to the next demand level.

XAU/USD analysis & outlookWeekly Outlook: GOLD (XAUUSD)
This week, I’ll be monitoring different scenarios, as price is currently far from any of my key Points of Interest (POIs).
My nearest potential buy is around the 3-hour demand zone. While it's not the most ideal entry—since it isn’t located in a discounted area—I’ll still keep an eye on it.
That said, I would prefer to see a deeper retracement into the 6-hour demand zone, which is in a far more discounted region. This zone offers a stronger setup, and I could see price launching from there again if tapped.
We’ve already seen a strong bullish reaction from last week’s demand zone, and based on current momentum, I could see price continuing upward until it reaches my next sell opportunity—the 3-hour supply zone, which sits at a premium level.
Confluences for GOLD Buys:
✅ Bullish structure — price has broken to the upside and remains overall bullish.
✅ Fresh 3H and 6H demand zones formed, which price could return to.
✅ Liquidity above — including trendline liquidity and previous Asia highs.
✅ Fundamentals — potential tariff cuts could fuel long-term bullish momentum for gold.
✅ Bearish Dollar Index (DXY) aligns with the bullish gold outlook.
📌 If price doesn’t retrace and instead continues to push higher, I’ll wait for another break of structure to the upside on the way toward the supply zone before reassessing entries.
Let’s stay focused and let the market come to us. Wishing everyone a great trading week ahead! 👊📈

AUDUSD Cautiously Bullish As US PI Data Looms This is the Weekly FOREX Forecast for the week of July 14 - 18th.
In this video, we will analyze the following FX market: AUDUSD
The AUDUSD has been grinding higher for weeks. Only Friday closed with a hint of a pullback starting. The RBA is looking for the US CPI Data to post. If the inflation numbers are a bit hot, this will strengthen the USD against the AUD. A soft CPI should see the market pricing back in higher chances of a third cut by year-end and weigh on the US dollar.
We'll see how the market reacts on Tuesday.
Enjoy!
May profits be upon you.
Leave any questions or comments in the comment section.
I appreciate any feedback from my viewers!
Like and/or subscribe if you want more accurate analysis.
Thank you so much!
Disclaimer:
I do not provide personal investment advice and I am not a qualified licensed investment advisor.
All information found here, including any ideas, opinions, views, predictions, forecasts, commentaries, suggestions, expressed or implied herein, are for informational, entertainment or educational purposes only and should not be construed as personal investment advice. While the information provided is believed to be accurate, it may include errors or inaccuracies.
I will not and cannot be held liable for any actions you take as a result of anything you read here.
Conduct your own due diligence, or consult a licensed financial advisor or broker before making any and all investment decisions. Any investments, trades, speculations, or decisions made on the basis of any information found on this channel, expressed or implied herein, are committed at your own risk, financial or otherwise.

AUDUSD Selling Trading IdeaHello Traders
In This Chart AUDUSD HOURLY Forex Forecast By FOREX PLANET
today AUDUSD analysis 👆
🟢This Chart includes_ (AUDUSD market update)
🟢What is The Next Opportunity on AUDUSD Market
🟢how to Enter to the Valid Entry With Assurance Profit
This CHART is For Trader's that Want to Improve Their Technical Analysis Skills and Their Trading By Understanding How To Analyze The Market Using Multiple Timeframes and Understanding The Bigger Picture on the Chart

EURCAD Breakdown and Retest , All Eyes on SellingHello Traders
In This Chart EURCAD HOURLY Forex Forecast By FOREX PLANET
today EURCAD analysis 👆
🟢This Chart includes_ (EURCAD market update)
🟢What is The Next Opportunity on EURCAD Market
🟢how to Enter to the Valid Entry With Assurance Profit
This CHART is For Trader's that Want to Improve Their Technical Analysis Skills and Their Trading By Understanding How To Analyze The Market Using Multiple Timeframes and Understanding The Bigger Picture on the Charts

GBPCHF is Ready for a breakthroughHello Traders
In This Chart GBPCHF HOURLY Forex Forecast By FOREX PLANET
today GBPCHF analysis 👆
🟢This Chart includes_ (GBPCHF market update)
🟢What is The Next Opportunity on GBPCHF Market
🟢how to Enter to the Valid Entry With Assurance Profit
This CHART is For Trader's that Want to Improve Their Technical Analysis Skills and Their Trading By Understanding How To Analyze The Market Using Multiple Timeframes and Understanding The Bigger Picture on the Charts

Natural Gas is in the Buying DirectionHello Traders
In This Chart NATGAS HOURLY Forex Forecast By FOREX PLANET
today NATGAS analysis 👆
🟢This Chart includes_ (NATGAS market update)
🟢What is The Next Opportunity on NATGAS Market
🟢how to Enter to the Valid Entry With Assurance Profit
This CHART is For Trader's that Want to Improve Their Technical Analysis Skills and Their Trading By Understanding How To Analyze The Market Using Multiple Timeframes and Understanding The Bigger Picture on the Charts

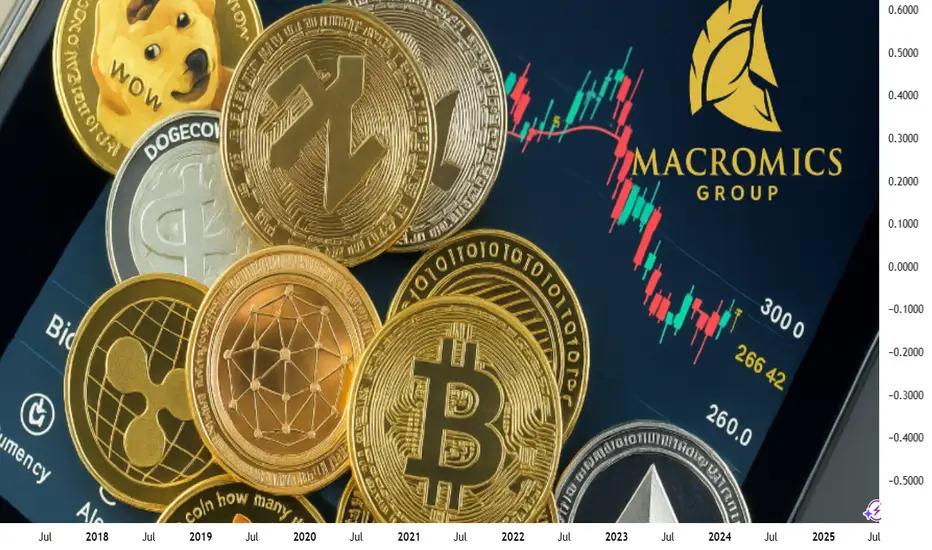
Crypto in July 2025: A Financial Reset from Macromics GroupThe world of cryptocurrencies in July 2025 is experiencing more than just another growth cycle — it’s undergoing a fundamental transformation of the global financial system. Amid geopolitical instability, tighter control over digital assets, and growing interest from institutional investors, digital currencies are once again in the spotlight. Macromics Group shares its latest analytical insights on the key events and trends.
A New Bull Run: Ethereum 3.0 and Bitcoin Network Upgrade
Since the start of summer 2025, Ethereum has shown strong growth, largely due to the launch of Ethereum 3.0, which reduced transaction fees and made the network more scalable. Bitcoin, in turn, has undergone another major security upgrade, attracting new institutional investors, including funds from Japan and Saudi Arabia.
CBDCs and Regulation: Governments Shift Approach
Central banks are actively rolling out central bank digital currencies (CBDCs). China, India, Brazil, and the EU have expanded pilot programs for their national digital currencies. This has led to increased interest in stablecoins backed by fiat currencies and greater demands for transparency on DeFi platforms.
Macromics Group helps clients navigate these new dynamics, offering up-to-date analytical resources and capital protection strategies across both regulated and unregulated sectors of the crypto market.
NFTs Make a Comeback — In the Corporate World
A new wave of interest in NFTs is emerging, not from artists, but from the corporate sector. Companies are using tokens for intellectual property, document verification, and digital rights management. Macromics Group is investing in startups building infrastructure for business-focused NFTs — a clear sign of the technology’s long-term potential.
AI + Blockchain: A Union of Future Technologies
In 2025, two mega-trends are converging: artificial intelligence and blockchain. AI-powered protocols are automating trading, cybersecurity, and even smart contract audits. Macromics Group is already implementing these technologies into its analytical tools and services.
What’s Next? Macromics Group Forecast
According to our data, the crypto market has entered a phase of "conscious growth" — where technology, regulation, and real-world utility are evolving in harmony. In the coming months, we anticipate increased attention toward:
DePIN projects (decentralized physical infrastructure)
Tokenized real-world assets (real estate, gold)
ESG-focused cryptocurrencies
Conclusion: Don’t Just Invest — Understand
Macromics Group urges investors to go beyond participation — to become informed decision-makers. We provide deep analytics, access to unique tools, and expert support at every stage of crypto investing. July 2025 is the perfect time to rethink your strategy and take a step into the future.
Macromics Group — your expert in the world of digital assets.
GBPUSD is in the Selling DirectionHello Traders
In This Chart GBPUSD HOURLY Forex Forecast By FOREX PLANET
today GBPUSD analysis 👆
🟢This Chart includes_ (GBPUSD market update)
🟢What is The Next Opportunity on GBPUSD Market
🟢how to Enter to the Valid Entry With Assurance Profit
This CHART is For Trader's that Want to Improve Their Technical Analysis Skills and Their Trading By Understanding How To Analyze The Market Using Multiple Timeframes and Understanding The Bigger Picture on the Charts

USD Strengthens Against GBP With New Tariff AnnouncementsThis is the Weekly FOREX Forecast for the week of July 14 - 18th.
In this video, we will analyze the following FX market: GBPUSD
The latest headlines tell the story. The tariffs are triggering a slow run to the USD safe haven. The previous week showed the USD Index closed pretty strong, while GBPUSD weakened.
There's a good chance we'll see more of the same this coming week.
Look for the strength in USD to continue to be supported by fundamental news, and outperform the other major currencies, including the GBP.
Buy USD/xxx
Sell xxx/USD
Enjoy!
May profits be upon you.
Leave any questions or comments in the comment section.
I appreciate any feedback from my viewers!
Like and/or subscribe if you want more accurate analysis.
Thank you so much!
Disclaimer:
I do not provide personal investment advice and I am not a qualified licensed investment advisor.
All information found here, including any ideas, opinions, views, predictions, forecasts, commentaries, suggestions, expressed or implied herein, are for informational, entertainment or educational purposes only and should not be construed as personal investment advice. While the information provided is believed to be accurate, it may include errors or inaccuracies.
I will not and cannot be held liable for any actions you take as a result of anything you read here.
Conduct your own due diligence, or consult a licensed financial advisor or broker before making any and all investment decisions. Any investments, trades, speculations, or decisions made on the basis of any information found on this channel, expressed or implied herein, are committed at your own risk, financial or otherwise.

Gold is in the Bearish DirectionHello Traders
In This Chart GOLD HOURLY Forex Forecast By FOREX PLANET
today Gold analysis 👆
🟢This Chart includes_ (GOLD market update)
🟢What is The Next Opportunity on GOLD Market
🟢how to Enter to the Valid Entry With Assurance Profit
This CHART is For Trader's that Want to Improve Their Technical Analysis Skills and Their Trading By Understanding How To Analyze The Market Using Multiple Timeframes and Understanding The Bigger Picture on the Charts

EURUSD Weakened By New Tariff Tensions With US This is the Weekly FOREX Forecast for the week of July 14 - 18th.
In this video, we will analyze the following FX market: EURSUD
The latest headlines tell the story. The tariffs are triggering a slow run to the USD safe haven. The previous week showed the USD Index closed pretty strong. There's a good chance we'll see more of the same this coming week.
Look for the strength in USD to continue to be supported by fundamental news, and outperform the other major currencies, including the EURO.
Buy USD/xxx
Sell xxx/USD
Enjoy!
May profits be upon you.
Leave any questions or comments in the comment section.
I appreciate any feedback from my viewers!
Like and/or subscribe if you want more accurate analysis.
Thank you so much!
Disclaimer:
I do not provide personal investment advice and I am not a qualified licensed investment advisor.
All information found here, including any ideas, opinions, views, predictions, forecasts, commentaries, suggestions, expressed or implied herein, are for informational, entertainment or educational purposes only and should not be construed as personal investment advice. While the information provided is believed to be accurate, it may include errors or inaccuracies.
I will not and cannot be held liable for any actions you take as a result of anything you read here.
Conduct your own due diligence, or consult a licensed financial advisor or broker before making any and all investment decisions. Any investments, trades, speculations, or decisions made on the basis of any information found on this channel, expressed or implied herein, are committed at your own risk, financial or otherwise.

Tariff Wars Pushing USD HigherThis is the Weekly FOREX Forecast for the week of July 14 - 18th.
In this video, we will analyze the following FX market: USD Index
The latest headlines tell the story. The tariffs are triggering a slow run to the USD safe haven, but the inflows from investors are moving the needle. The previous week closed strong, with buyers in control. There's a good chance we'll see more of the same this coming week.
Look for the strength in USD to continue to be supported by fundamental news, and outperform the other major currencies.
Buy USDxxx
Sell xxxUSD
Enjoy!
May profits be upon you.
Leave any questions or comments in the comment section.
I appreciate any feedback from my viewers!
Like and/or subscribe if you want more accurate analysis.
Thank you so much!
Disclaimer:
I do not provide personal investment advice and I am not a qualified licensed investment advisor.
All information found here, including any ideas, opinions, views, predictions, forecasts, commentaries, suggestions, expressed or implied herein, are for informational, entertainment or educational purposes only and should not be construed as personal investment advice. While the information provided is believed to be accurate, it may include errors or inaccuracies.
I will not and cannot be held liable for any actions you take as a result of anything you read here.
Conduct your own due diligence, or consult a licensed financial advisor or broker before making any and all investment decisions. Any investments, trades, speculations, or decisions made on the basis of any information found on this channel, expressed or implied herein, are committed at your own risk, financial or otherwise.

SPX500USD | Retesting All-Time HighsThe index has extended its bullish rally, printing a new local high at 6,286.5 before showing signs of slight hesitation with consecutive small-bodied candles.
Support at: 6,134.5 / 6,026.0 / 5,926.2 🔽
Resistance at: 6,286.5 🔼
🔎 Bias:
🔼 Bullish: Sustains above 6,134.5 and breaks 6,286.5 for new highs.
🔽 Bearish: Break below 6,134.5 could trigger a retracement toward 6,026.0.
📛 Disclaimer: This is not financial advice. Trade at your own risk.

ETHUSDTThis movement downtrend. If breake 2.790 movr to 3.500$ but breke 2.200 move trend to 1.500$.

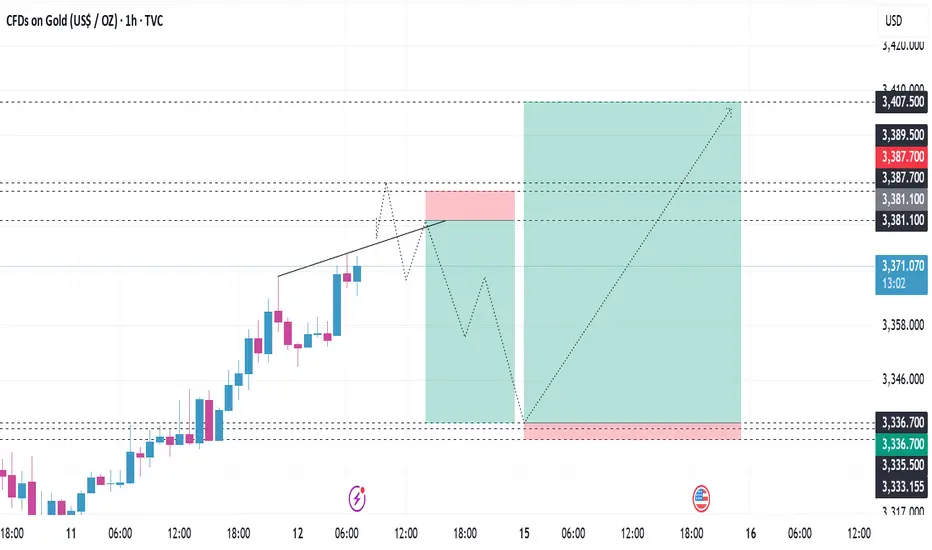
GOLD continue bull? Hye guys. based on my previous mapping , market gave us almost 800pips , I expecting gold to reach price around 3395.
Clearly, market did a breakout in bullish flag pattern. So we can wait for retracement around 3330 fresh zone. if price break near support and make it as liquidity, it will continue to 3302..
dyor =)

ZRX Looks Bullish (2D)From the point where we placed the red arrow on the chart, it appears that a triangle is forming.
Now, considering the formation of a double bottom at the low and the break of the bearish trendline, it seems that the price is ready to complete wave E of this triangle.
As long as the new demand zone holds, the bullish move can continue.
The targets are marked on the chart.
A daily candle closing below the invalidation level will invalidate this analysis.
For risk management, please don't forget stop loss and capital management
When we reach the first target, save some profit and then change the stop to entry
Comment if you have any questions
Thank You

#LINKUSDT: Distribution Phase Has Started! Will It Hit $45? The accumulation phase has just ended, and the distribution phase has just begun. Our current concern is whether the bullish volume holds on and the trend continues to remain bullish. Please do your own research before blindly following the analysis, as this is just our bias and does not guarantee that the price will exactly follow the chart.
Thank you for your support throughout. We wish you the best!
Team Setupsfx_
