GOLD continue bull? Hye guys. based on my previous mapping , market gave us almost 800pips , I expecting gold to reach price around 3395.
Clearly, market did a breakout in bullish flag pattern. So we can wait for retracement around 3330 fresh zone. if price break near support and make it as liquidity, it will continue to 3302..
dyor =)
Supply and Demand

ZRX Looks Bullish (2D)From the point where we placed the red arrow on the chart, it appears that a triangle is forming.
Now, considering the formation of a double bottom at the low and the break of the bearish trendline, it seems that the price is ready to complete wave E of this triangle.
As long as the new demand zone holds, the bullish move can continue.
The targets are marked on the chart.
A daily candle closing below the invalidation level will invalidate this analysis.
For risk management, please don't forget stop loss and capital management
When we reach the first target, save some profit and then change the stop to entry
Comment if you have any questions
Thank You

#LINKUSDT: Distribution Phase Has Started! Will It Hit $45? The accumulation phase has just ended, and the distribution phase has just begun. Our current concern is whether the bullish volume holds on and the trend continues to remain bullish. Please do your own research before blindly following the analysis, as this is just our bias and does not guarantee that the price will exactly follow the chart.
Thank you for your support throughout. We wish you the best!
Team Setupsfx_

Feeling the waves (Ripple $XRP)Setup
The price has been consolidating since the explosive move from ~50c to $3 last year. There has been a wide $1 price range between $2 and $3. A failed breakdown below a still rising 30-week moving average and new 4-month high suggest underlying bullishness.
Signal
Should there be any follow-through to last week's big up-move, then any pullback to the golden pocket between the 50% and 61.8% Fibonacci retracement levels could trigger a rebound.

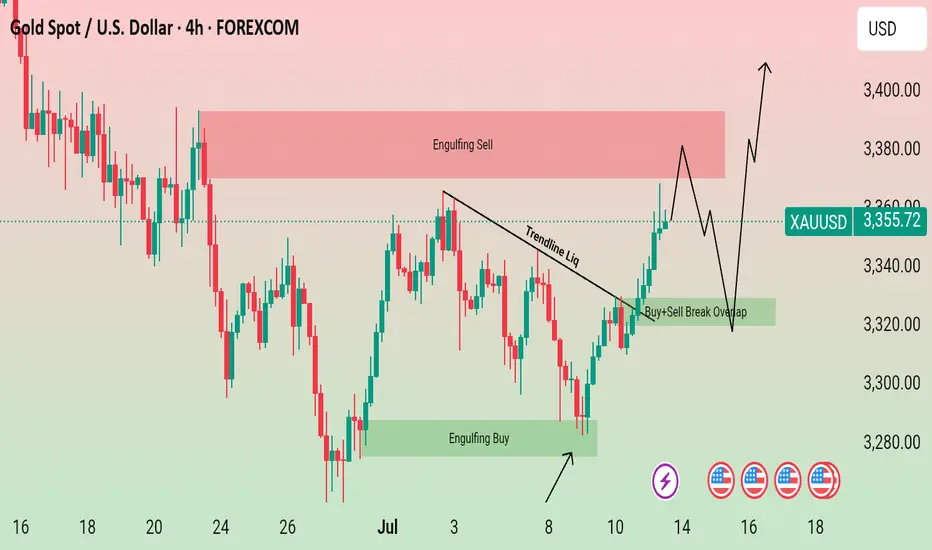
Gold just played an interesting game on the 4-hour chart!🚨 GOLD Technical Outlook – 4H Chart Insight! 🕵️♂️✨
📉 First, we spotted a Bearish Engulfing pattern that created a strong Sell Zone, signaling downward pressure. But guess what? The market wasn't ready to give up just yet…
📈 From the lower end, a powerful Bullish Engulfing stepped in like a hero, offering solid support and pushing the market back up!
Now here's where it gets exciting:
🔥 Gold has formed another bullish engulfing pattern, and the price is once again knocking on the door of that Sell Zone.
🤔 What's next?
A rejection from this sell zone could trigger another drop 📉
But keep an eye on the overlapping support zone below — if price revisits and holds there, we could see a bullish bounce toward the upside again! 🚀
📌 Key takeaway: We’re at a decision point. The next move could be explosive — up or down. Stay sharp! 🔍
⚠️ DYOR – Do Your Own Research! 🚫 This is not financial advice — just a trader's perspective.
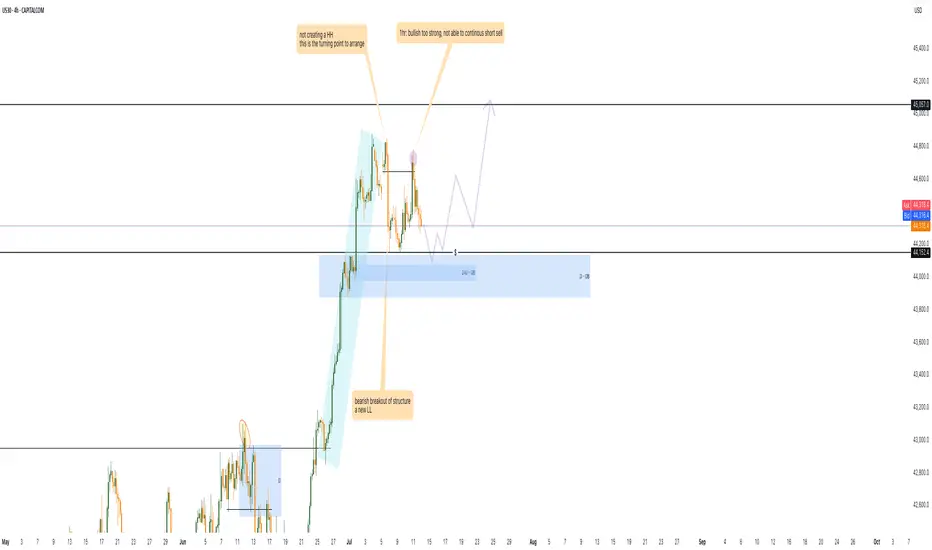
US30 prepare for the bullish 1. there is double bottom at 44152 level, i will tend to wait for the sweep meaning the price go down and hit the 4hr order block.
2. wait for 15m/ 30m TF a strong bullish momentum.
3. retest the 44152 around level or 0.618 to enter the market to long
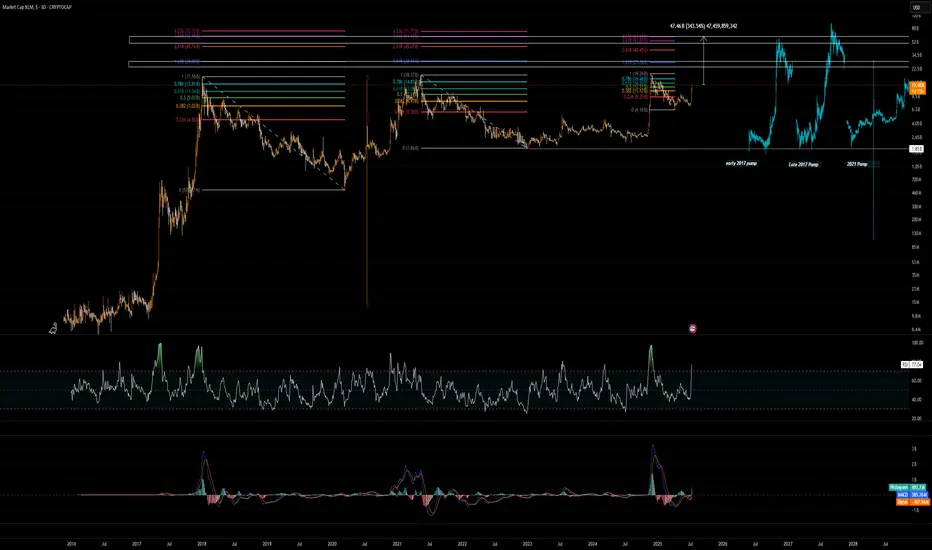
XLM potentialXLM shows a great performance this cycle so far and it finally show some independency from XRP and lead without XRP getting pump.
Some might think it will go for ever, I am sorry to break your heart it won't be more than $70B market cap. best case scenarios.
Around $15B to $19B there will the first resistance.
1.618 fib in all timeframes will be the next, which will be $20B - $28 Market cap I think safe bet for final exit will be $53B market cap which is 350% from here.
RDNT Looks Bullish (1D)The price is showing bullish signs at the bottom.
Higher lows have formed, a trigger line has been broken, and the price has created a bullish iCH. It is now also above the demand zone.
A buy/long position can be entered upon a pullback to the demand zone.
The main targets have been marked on the chart.
If a daily candle closes below the invalidation level, this analysis will be invalidated.
For risk management, please don't forget stop loss and capital management
When we reach the first target, save some profit and then change the stop to entry
Comment if you have any questions
Thank You

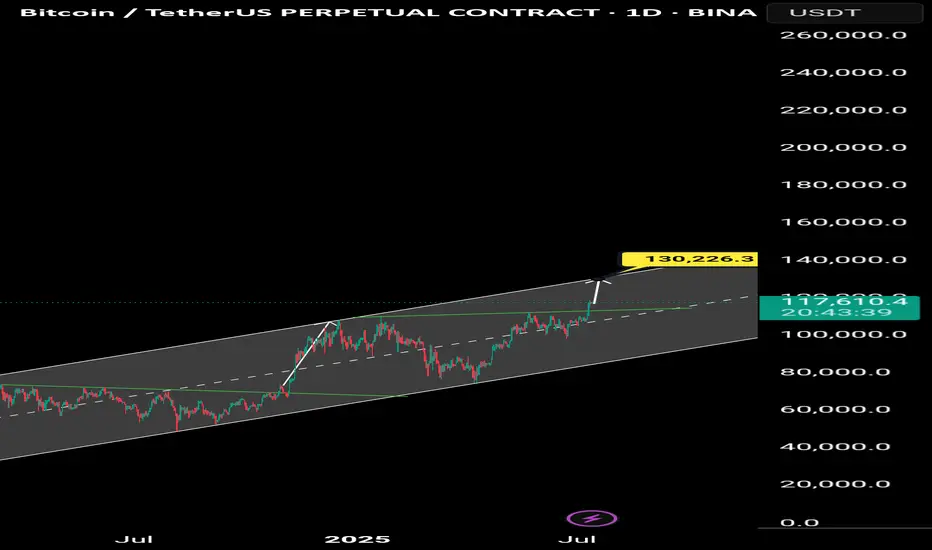
Bitcoin Go 130kBitcoin is heading towards 130,000 tomorrow
The alt season has begun and the market is sharply bullish.
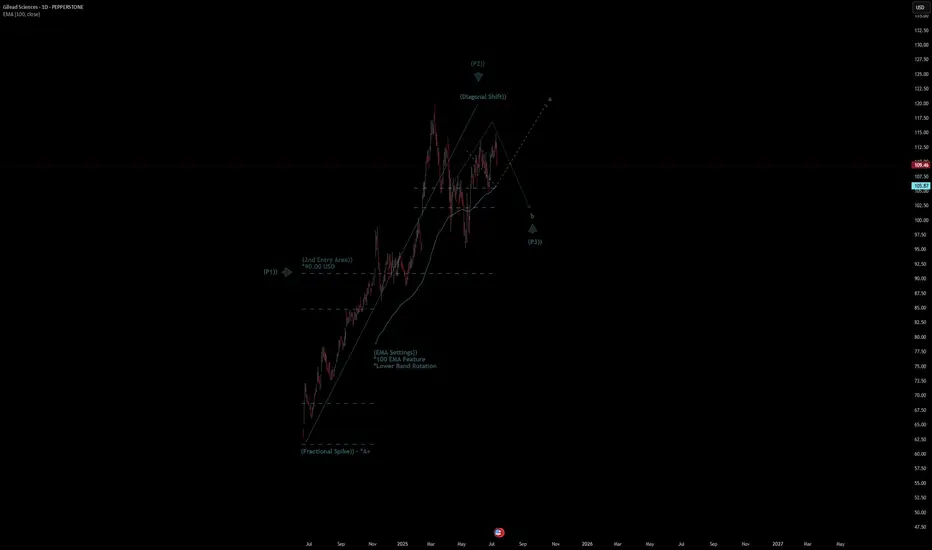
Gilead Sciences Quote | Chart & Forecast SummaryKey Indicators On Trade Set Up In General
1. Push Set Up
2. Range Set Up
3. Break & Retest Set Up
Notes On Session
# Gilead Sciences Quote
- Double Formation
* (Fractional Spike)) - *A+ | Completed Survey
* (2nd Entry Area)) - *90.00 USD | Subdivision 1
- Triple Formation
* (P1)) / (P2)) & (P3)) | Subdivision 2
* (TP1) = a / Long Consecutive Range
* (TP2) = b / Short Consecutive Pullback | Subdivision 3
* Daily Time Frame | Trend Settings Condition
- (Hypothesis On Entry Bias)) | Regular Settings
- Position On A 1.5RR
* Stop Loss At 98.00 USD
* Entry At 110.00 USD
* Take Profit At 126.00 USD
* (Uptrend Argument)) & No Pattern Confirmation
- Continuation Pattern | Not Valid
- Reversal Pattern | Not Valid
* Ongoing Entry & (Neutral Area))
Active Sessions On Relevant Range & Elemented Probabilities;
European-Session(Upwards) - East Coast-Session(Downwards) - Asian-Session(Ranging)
Conclusion | Trade Plan Execution & Risk Management On Demand;
Overall Consensus | Buy
GBPUSD - Also continued downside continuationLooking at GU. This is a little bit ahead of its time in comparison to EU.
And what i mean by that is EU is a lot further away from its 4H demand zone compared to GBP so it will be super interesting to see how we react at the level we are fast approaching on GU.
I am in a short position as of Friday. I will be posting a video tomorrow showing exactly how and why i got short on GU so stay tuned for that one.
As always if there is anything else i can be of assistance with give me a message and i will be happy to answer any questions you may have

EURUSD - Still Orderflow remains bearishLooking at EU. The 1H Orderflow is still maintaining that bearish intent. My area is set now for where i want to take a potential sell to the downside seeing as everything else is pretty much mitigated.
The only issue with this potential sell of is that we never really had a sweep of liquidity before we rolled over and moved to the downside.
We do have a level of inducement before our POI but i think in an ideal world i would love to see us build up a bit more liquidity before the POI just to induce the early sellers before making that move to the downside.
For now. On the lower TF's i will be looking to take short term long positions back up to our POI before looking for the longer terms short. to our 4H POI in which i will be looking to get long once again.
Any questions feel free to give me a message

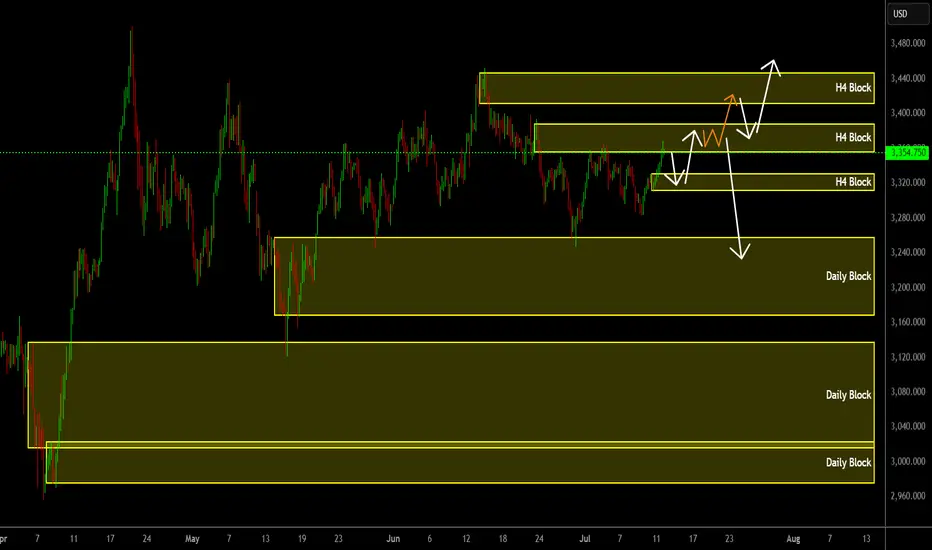
Gold Analysis H4/Daily🧠 Order Block-Based Market Structure Analysis
In this analysis, we leverage Smart Money Concepts (SMC), focusing on the interaction between order blocks and market structure on the H4 and Daily timeframes. This hybrid approach enables a high-probability forecast of price action within a strategic framework.
🟢 Market Structure Overview
The current structure is forming an ascending range with higher lows, suggesting bullish intent — but with no clear breakout above previous structural highs yet. The market is essentially building liquidity traps around premium zones, setting up for a potential expansion move.
🔶 Key Zones Identified
H4 Supply Blocks (Upper Resistance Areas)
Three H4-level order blocks are stacked above the current price, each representing potential points of liquidity absorption or reversal:
First Block: Minor resistance, likely to be breached.
Second Block: Main liquidity zone where sellers may become active.
Third Block: Final trap or target zone in case of aggressive bullish expansion.
Daily Demand Blocks (Deeper Support Areas)
Three major Daily order blocks are marked below. These are institutional accumulation zones and key areas for potential price reaction or reversal:
Zone 1: Short-term support
Zone 2: Mid-term support with stronger price memory
Zone 3: High-confluence zone likely to be defended if reached
📈 Scenario Projections
✅ Bullish Scenario (Primary Path - White Arrows)
Price may first revisit a minor H4 OB below.
If price breaks the local high, we expect movement toward the second and third H4 OBs.
A clean break of those zones confirms a bullish continuation structure.
⚠️ Bearish/Corrective Scenario (Alternative Path - Orange & White Arrows)
If price fails to break above the second H4 OB and shows signs of exhaustion or liquidity sweep:
We could see a sharp rejection.
Breakdown of support may lead to a drop toward the Daily OB at 3240, or even deeper levels near 3080 or 3000 if momentum strengthens.
🔍 Key Trading Insights
Wait for confirmation candles (impulse + volume spike) around order blocks before execution.
Monitor volume behavior at key zones — strong volume without movement can indicate absorption.
Daily blocks are ideal long entry zones if structure and reaction confirm institutional buying.
🎯 Conclusion
This dual scenario strategy based on H4 and Daily order blocks provides traders with a clear directional roadmap. The reaction to the middle H4 OB will be the turning point — either leading to a breakout rally or a breakdown into deeper institutional zones.
📌 Stay patient and let price reveal its intent around these engineered liquidity levels.
Guppy - Long TradeExpecting a bearish move down and then a strong reversal at the levels displayed!
Happy Trading!

EURAUD clearly strong Australian dollarEURAUD is definitelly starting a bearish trend so I have 2 AOI Daily waiting one of them to be retested and once I see a Bearish Engulfing Pattern I am going to get in.

EURGBP trend is your friendSimple trade I am going to look for the retest of the area or touch of the POC with a beatiful and clear Engulfing Pattern on it. Pay attention I do not have any Daily area of interest level, so it may be a risky trade.

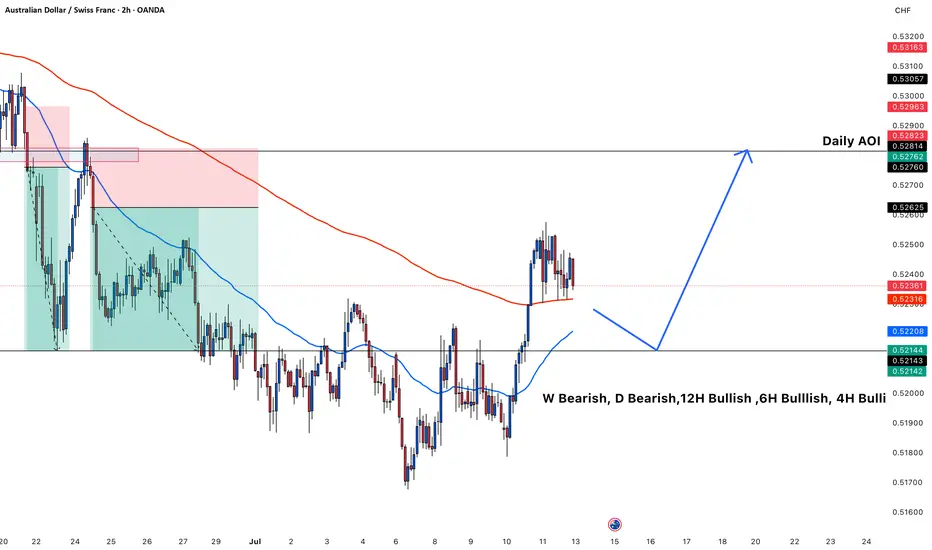
AUDCHF will continue its Bullish BiasIt has accumulated well AUDCHF already broke the structure.
I am just waiting for the Retest of the level.
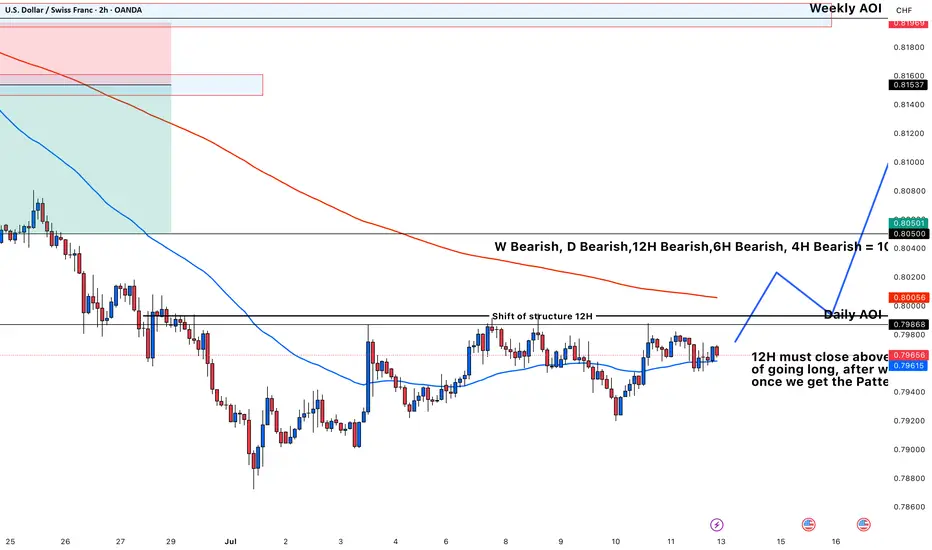
USDCHF once break the structure It will go longUSDCHF in the moment is a Bearish Bias, that is the reason I am wating the 12H to close the body candle above the level, after I am waiting for the retest of the level and once I see my Beautiful pattern { Engulfing Candle } I will take the trade.
Beautiful Long USDCAD is getting ready next weekI love this pair once I will see a break and retest of the level I will place my order long.
In the moment it is on the POC level so it will be soon go long. I am looking for the engulfing pattern to sit on my level and I am going to teke the trade.

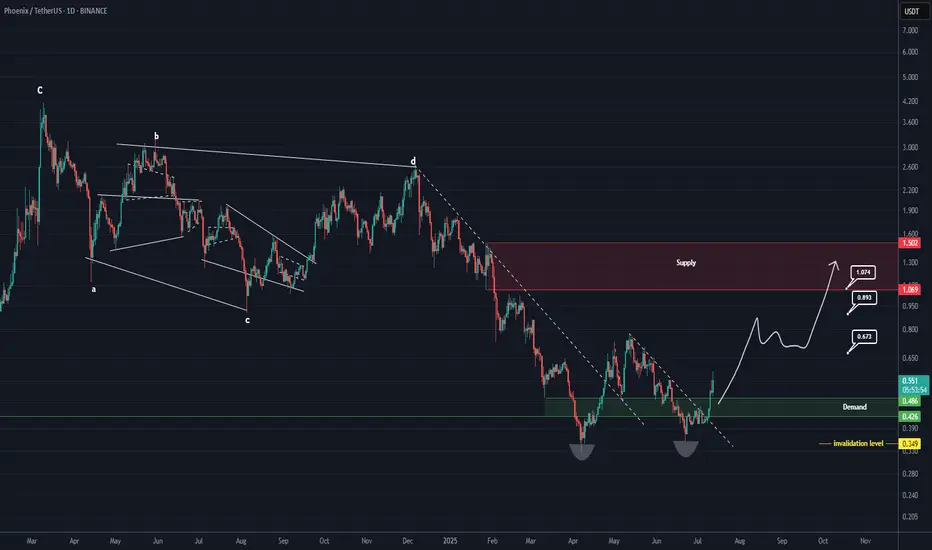
PHB Looks Bullish (1D)It appears that wave E has ended after a long consolidation and the formation of a double bottom. A key trigger line has been broken, and the price has reclaimed the flip zone (marked in green).
As long as the green zone holds, the price can move toward the targets and the red box.
The targets are marked on the chart.
A daily candle closing below the invalidation level will invalidate this analysis.
For risk management, please don't forget stop loss and capital management
Comment if you have any questions
Thank You
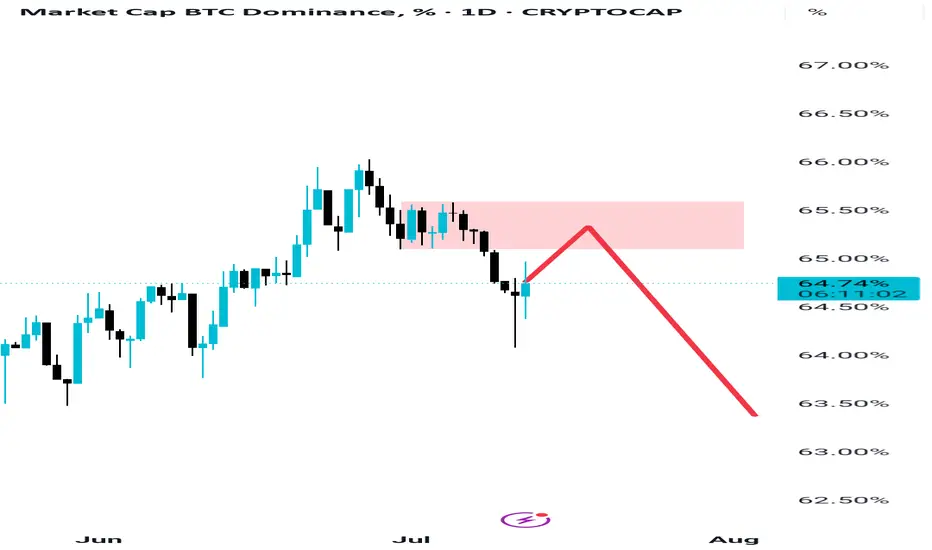
Btc Dominance Just doing retest, HOLD Everyone is selling their altcoins out of fear after minor pumps, but they don’t realize that Bitcoin dominance is only retesting its supply zone. It has already broken its structure, indicating a shift into a downtrend. This retest is not a reversal—yet people are spreading fear among each other as if something major is about to happen. Many will miss what’s coming and regret it later. Don't miss Altseason which is coming in few days not weeks.
Mind It
BTCUSDTWait for breaked ATH for 115K target.
BINANCE:BTCUSDT.P
Now price is in two level trading renge but come entry volume of buyers.

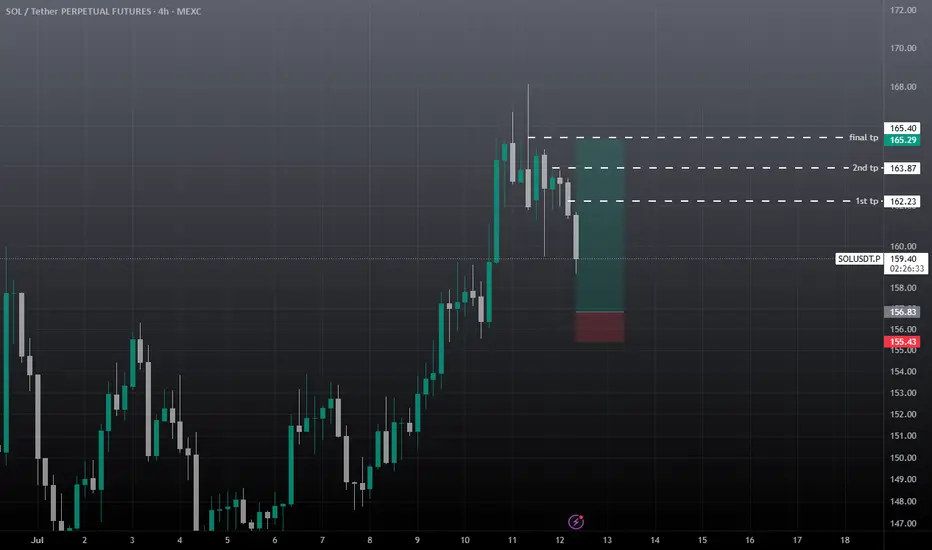
SOL USDT SCALP Long / Buy Setupwait for the entry and then take, as liquidation still lies upside, chances are high that sol will re-visit 164, before any major move to the downside. SL is important on any side. We took good profit on previous SOL short setup.