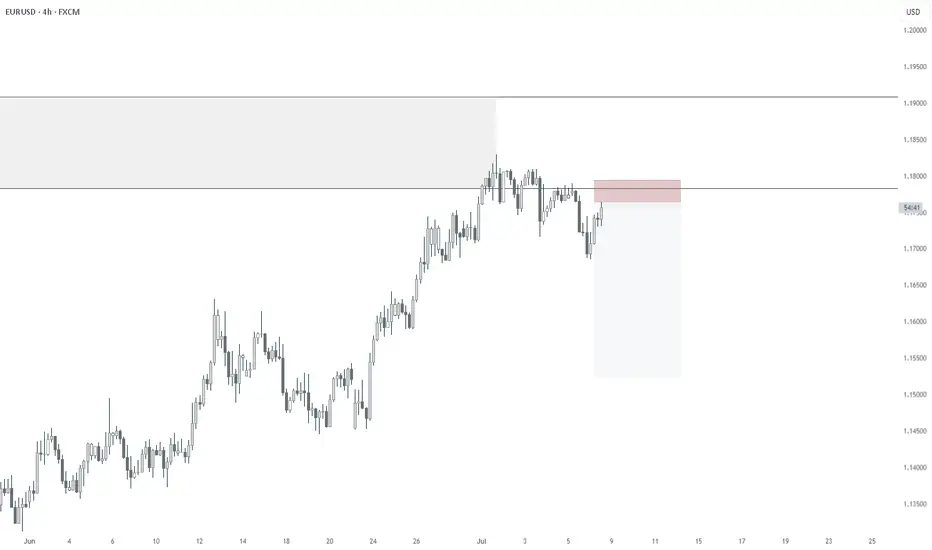
07/08/2025 - EURUSD - HEDGE SHORTHedge Short for FX:GBPUSD
COT Retailer still extended
We are on the higher timeframe weekly zone
Substructure is already confirmed bearish
Supply and Demand
VI Stock(India) Looking for bullish Rally! {5/07/2025}Educational Analysis says that VI Stock (India) may give trend Trading opportunities from this range, according to my technical analysis.
Broker - NA
So, my analysis is based on a top-down approach from weekly to trend range to internal trend range.
So my analysis comprises of two structures: 1) Break of structure on weekly range and 2) Trading Range to fill the remaining fair value gap
Let's see what this Stock brings to the table for us in the future.
Please check the comment section to see how this turned out.
DISCLAIMER:-
This is not an entry signal. THIS IS FOR EDUCATIONAL PURPOSES ONLY.
I HAVE NO CONCERNS WITH YOUR PROFIT OR LOSS,
Happy Trading, Fx Dollars.

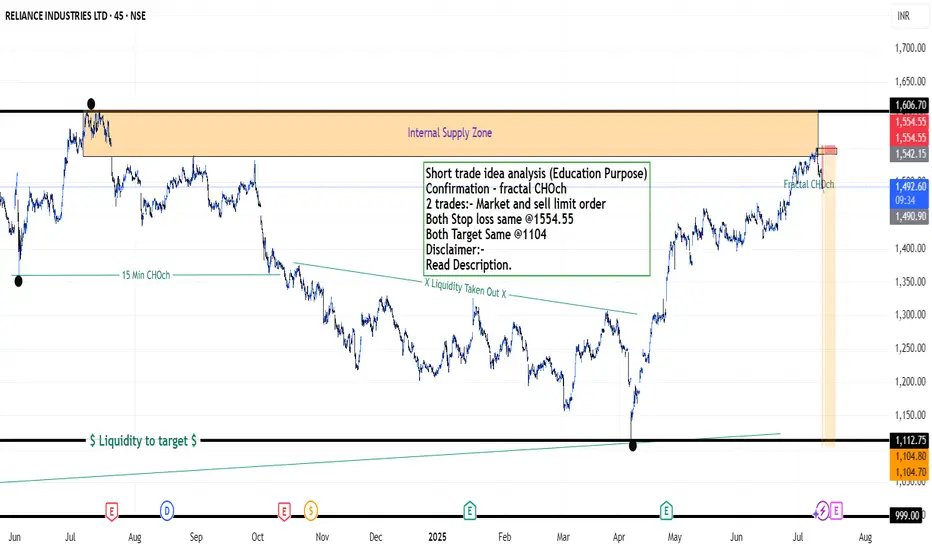
Reliance Industries Stock(India) - {11/07/2025}Educational Analysis says that Reliance Industries (Indian Stock) may give trend Trading opportunities from this range, according to my technical analysis.
Broker - NA
So, my analysis is based on a top-down approach from weekly to trend range to internal trend range.
So my analysis comprises of two structures: 1) Break of structure on weekly range and 2) Trading Range to fill the remaining fair value gap
Let's see what this Stock brings to the table for us in the future.
DISCLAIMER:-
This is not an entry signal. THIS IS FOR EDUCATIONAL PURPOSES ONLY.
I HAVE NO CONCERNS WITH YOUR PROFITS OR LOSS,
Happy Trading,
Stocks & Commodities TradeAnalysis.
My Analysis is:-
Short term trend may be go to the external demand zone.
Long term trend breaks the new high after going from discount zone.
Short trade idea analysis (Education Purpose)
Confirmation - fractal CHOch
2 trades:- Market and sell limit order
Both Stop loss same @1554.55
Both Target Same @1104
Please check the comment section to see how this turned out.
BTC Roadmap Still Intact Bullish Momentum Building Toward 120KBitcoin Price action continues to validate the bullish roadmap shared in our last BTC post. The market respected the Immediate Buy Back Zone, springing from a demand backed structure into a fresh impulsive leg.
Notably, price has carved a clean 5-wave structure supported by recurring bullish pennants and continuation patterns each breakout driving momentum higher. Our target at 120,151 remains firmly intact, with price action showing healthy structure and controlled pullbacks.
The current setup remains valid as long as price holds above 106,655 and especially 100,941, which now act as structural pivot zones. Any deeper correction into the Demand Area would only serve as a re-accumulation window before the next leg.
Let’s see how price behaves into June. Momentum is aligning with structure.
Share your thoughts, like the post, and drop your setup confirmations on the comment section.

NQ Power Range Report with FIB Ext - 7/11/2025 SessionCME_MINI:NQU2025
- PR High: 23039.75
- PR Low: 23004.50
- NZ Spread: 78.75
No key scheduled economic events
High 200+ range volatility during Asian hours
Session Open Stats (As of 1:35 AM 7/11)
- Session Open ATR: 301.79
- Volume: 48K
- Open Int: 268K
- Trend Grade: Neutral
- From BA ATH: -0.6% (Rounded)
Key Levels (Rounded - Think of these as ranges)
- Long: 23239
- Mid: 21525
- Short: 20383
Keep in mind this is not speculation or a prediction. Only a report of the Power Range with Fib extensions for target hunting. Do your DD! You determine your risk tolerance. You are fully capable of making your own decisions.
BA: Back Adjusted
BuZ/BeZ: Bull Zone / Bear Zone
NZ: Neutral Zone

GBPUSD - 1H - 95% PredictionGBPUSD - 1H
Bumping to 5 minutes order block and then dumping to create new lower low.

GBPUSD - 15m - 95% PredictionGBPUSD - 15m
Bumping to 5 minutes order block and then dumping to create new lower low.

BTC Long / Buy SetupBTC is strongly Bullish towards 120k liquidity level, I'm not seeing any healthy correction before hitting the 120k level. If BTC strongly breaks and closes below 106.9k then chances are high that it will touch the weekly level and again come to 107k level, but this time it will struggle to break the 107k level because it will become bearish fvg, if it holds the 107k level and give any strong reaction from the zone then the next level is 120k. even a wick towards 105k or below doesn't matter, any body closing below the 106.9k (at least 4hrs) will lead short term weakness to the trend.

BTC Intraday SetupWait for the liquidation sweep on any side, then take entry, btc moving in sideways for many days, remember that first breakout will be fakeout on any side.

ETH Long / Buy SetupAs of many times mentioned that, will short eth above 3k or 3k, but it still shows Bullish momentum no sign of weakness, maybe this entry triggers during weekend due too low volume, search for ifvg, if any 1D or 4hr Bullish fvg truns into bearish ifvg then will take short on ETH. For now will take long with SL and proper risk management.

GBPNZD - Look for Long (SWING) 1:3GBPNZD currently shows no signs of reversal, having broken the trendline and heading toward the next supply zone on the higher timeframe. This presents a potential opportunity to go long in line with the prevailing trend, never trade against it. Let’s observe how the price action unfolds.
Disclaimer:
This is simply my personal technical analysis, and you're free to consider it as a reference or disregard it. No obligation! Emphasizing the importance of proper risk management—it can make a significant difference. Wishing you a successful and happy trading experience!

AUD/USD Long Setup – 1H Demand to 4H Supply 🧠 Trade Breakdown:
Price tapped into a clear 1H demand zone and showed bullish reaction. The setup is targeting a 4H supply zone above. This is a classic demand-to-supply flow with room for clean upside.
⸻
📍 Key Confluences:
• Strong 1H demand (reaction zone clearly respected)
• Clear bullish structure: Higher highs + higher lows
• 4H supply zone above as natural target zone
• Momentum supported by clean bullish candles on the way up
• Entry aligns with a pullback to demand zone wick rejection
⸻
📈 Trade Setup:
• Pair: AUD/USD
• Entry: 0.65881
• Stop Loss: 0.65570 (below demand wick)
• Take Profit: 0.66583 (4H supply zone)
• Risk-to-Reward (RR): ~1:6
⸻
🧠 Mindset:
Let this setup breathe — it’s demand into higher timeframe supply. No need to panic on minor retracements. Trust your bias. Let the setup develop. Protect your capital, but don’t micromanage the trade.
“Trade Simple. Live Lavish.”

AUDUSD 60/5 Pullback Short1-hr chart showing bear and now the price is at sell zone. Wait for pull up and short.
RRR could be higher than +2R is the pull up is greater.

TECHNICAL ANALYSISI BTC 1 HR TIME FRAME 📊 Technical Analysis – BTCUSDT.P (1H Chart)
✅ 1. Overall Trend:
The market is in a strong bullish trend on the 1-hour chart, confirmed by multiple CHoCH (Change of Character) and BOS (Break of Structure) points.
📌 2. Price Structure:
🔹 First CHoCH:
Indicates weakness in the prior downtrend.
The following BOS confirms a structure shift to the upside.
🔹 Second CHoCH:
After a minor correction, buyers regained control.
Another BOS confirms continuation of bullish momentum.
🟢 3. Demand Zones:
Multiple demand zones are marked in green.
The most relevant zone right now is between 113,100 – 113,600, still untested.
A bullish reaction is likely if price pulls back into this area.
⚠️ 4. Current Price Action:
Price has reached around 115,487 after the latest BOS.
A minor bearish reaction is visible, suggesting a possible short-term correction.
As long as the BOS level holds, the overall structure remains bullish.
🔍 5. Candlestick Signal:
No clear Engulfing candle yet, but if:
A strong red candle forms followed by a full bullish engulfing candle within the demand zone,
→ that would be a valid Bullish Engulfing pattern and a potential reversal signal.
🎯 Conclusion:
Market structure is currently bullish.
Watch for pullbacks to the 113,100–113,600 zone.
Ideal entries come with confirmation (e.g., engulfing candle or strong rejection).
Always apply strict risk management.
❗️Disclaimer:
This analysis is for educational purposes only and does not constitute financial advice or a buy/sell signal.
Please do your own research and trade based on your personal strategy and risk tolerance.
BITGET:BTCUSDT.P

4 HOUR CONFIRMATION- USDCAD ENTRY UPDATEPrice tapped in our Weekly Demand ideal 👌 for long buys.
Previously i anticipated a trend shift H4 as guide , cmp price just break our int previous high meaning change a in trend as we anticipated
Now waiting for price to drop to our int demand then we rise or the breaker block can hold - major reactions

Gold is in the Bearish DirectionHello Traders
In This Chart GOLD HOURLY Forex Forecast By FOREX PLANET
today Gold analysis 👆
🟢This Chart includes_ (GOLD market update)
🟢What is The Next Opportunity on GOLD Market
🟢how to Enter to the Valid Entry With Assurance Profit
This CHART is For Trader's that Want to Improve Their Technical Analysis Skills and Their Trading By Understanding How To Analyze The Market Using Multiple Timeframes and Understanding The Bigger Picture on the Charts

Gold is in the bullish direction after correcting the supportHello Traders
In This Chart GOLD HOURLY Forex Forecast By FOREX PLANET
today Gold analysis 👆
🟢This Chart includes_ (GOLD market update)
🟢What is The Next Opportunity on GOLD Market
🟢how to Enter to the Valid Entry With Assurance Profit
This CHART is For Trader's that Want to Improve Their Technical Analysis Skills and Their Trading By Understanding How To Analyze The Market Using Multiple Timeframes and Understanding The Bigger Picture on the Charts

GBPUSD is in the Selling DirectionHello Traders
In This Chart GBPUSD HOURLY Forex Forecast By FOREX PLANET
today GBPUSD analysis 👆
🟢This Chart includes_ (GBPUSD market update)
🟢What is The Next Opportunity on GBPUSD Market
🟢how to Enter to the Valid Entry With Assurance Profit
This CHART is For Trader's that Want to Improve Their Technical Analysis Skills and Their Trading By Understanding How To Analyze The Market Using Multiple Timeframes and Understanding The Bigger Picture on the Charts

GBPJPY is in the Down Trend From Resistance LevelHello Traders
In This Chart GBPJPY HOURLY Forex Forecast By FOREX PLANET
today GBPJPY analysis 👆
🟢This Chart includes_ (GBPJPY market update)
🟢What is The Next Opportunity on GBPJPY Market
🟢how to Enter to the Valid Entry With Assurance Profit
This CHART is For Trader's that Want to Improve Their Technical Analysis Skills and Their Trading By Understanding How To Analyze The Market Using Multiple Timeframes and Understanding The Bigger Picture on the Charts

Silver is Again in the Bullish directionHello Traders
In This Chart XAGUSD HOURLY Forex Forecast By FOREX PLANET
today XAGUSD analysis 👆
🟢This Chart includes_ (XAGUSD market update)
🟢What is The Next Opportunity on XAGUSD Market
🟢how to Enter to the Valid Entry With Assurance Profit
This CHART is For Trader's that Want to Improve Their Technical Analysis Skills and Their Trading By Understanding How To Analyze The Market Using Multiple Timeframes and Understanding The Bigger Picture on the Charts

NZDCAD Selling Trading IdeaHello Traders
In This Chart nzdcad HOURLY Forex Forecast By FOREX PLANET
today NZDCAD analysis 👆
🟢This Chart includes_ (NZDCAD market update)
🟢What is The Next Opportunity on NZDCAD Market
🟢how to Enter to the Valid Entry With Assurance Profit
This CHART is For Trader's that Want to Improve Their Technical Analysis Skills and Their Trading By Understanding How To Analyze The Market Using Multiple Timeframes and Understanding The Bigger Picture on the Charts

Gold is in the Bearish direction from a Support levelHello Traders
In This Chart GOLD HOURLY Forex Forecast By FOREX PLANET
today Gold analysis 👆
🟢This Chart includes_ (GOLD market update)
🟢What is The Next Opportunity on GOLD Market
🟢how to Enter to the Valid Entry With Assurance Profit
This CHART is For Trader's that Want to Improve Their Technical Analysis Skills and Their Trading By Understanding How To Analyze The Market Using Multiple Timeframes and Understanding The Bigger Picture on the Charts

GBPJPY is Holding above the SupportHello Traders
In This Chart GBPJPY HOURLY Forex Forecast By FOREX PLANET
today GBPJPY analysis 👆
🟢This Chart includes_ (GBPJPY market update)
🟢What is The Next Opportunity on GBPJPY Market
🟢how to Enter to the Valid Entry With Assurance Profit
This CHART is For Trader's that Want to Improve Their Technical Analysis Skills and Their Trading By Understanding How To Analyze The Market Using Multiple Timeframes and Understanding The Bigger Picture on the Charts
