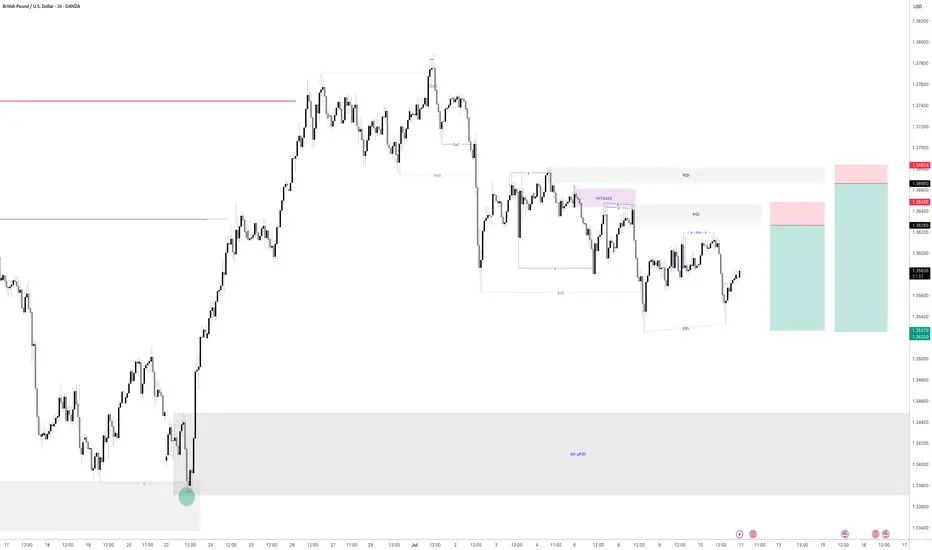
GBPUSD - 2 Selling opportunitiesLooking at GBPUSD
We have 2 opportunities to get short. Both have a build of liquidity before the areas of supply before them. This means we are looking for the early seller to get into the market before we get in so that all the early seller get stopped out.
As we can see the order flow on this is still bearish. So until the market shows me it want to go higher then we will remain bearish
Keep a close eye on this for tomorrow
Supply and Demand
USDJPY | Supply zone rejection 💣📉Price ran out internal liquidity, tapped into a refined supply zone, and showed early signs of distribution. Entry taken post-confirmation at the mitigation of the order block, with a clean R:R toward the next demand zone.
🔹 BOS + Liquidity Grab
🔹 Supply Zone Rejection
🔹 Premium Pricing Entry
🔹 Targeting unmitigated demand below (HTF imbalance)
Setup is built around smart money principles—waiting for price to deliver the sell-off. Clean and mechanical.
#SMC #USDJPY #SmartMoney #LiquiditySweep #FXTradingClub #MarketStructure

Bitcoin ATHBINANCE:BTCUSDT This is amazing for crypto community because this level-up all of lover crypto currencies.
Next target: 120.000K
Best for pollback levels: 111.000K & 105.500K
👓We are this time keep calms emotional in buy or sell.

Long trade
ETHUSDT 4H Chart Analysis
Date: Sat 05th July 2025, 4:00 PM
Session: London to NY AM
Key Trade Details
Entry: 2,515.17
Profit Target: 2,864.44 (+13.89%)
Stop Loss: 2,479.01 (−1.43%)
Risk-Reward: 9.66
Key Reasons for the Trade:
Bullish Breakout above 2,515, supported by strong volume surge.
Price Above EMA & WMA: Clear trend confirmation.
Strong Momentum: The RSI is overbought, indicating bullish strength, but watch for a potential short-term pullback as the price approaches resistance.
Target Zone: Prior resistance cluster at 2,820–2,860.
Current RR in Play: Trade already moving

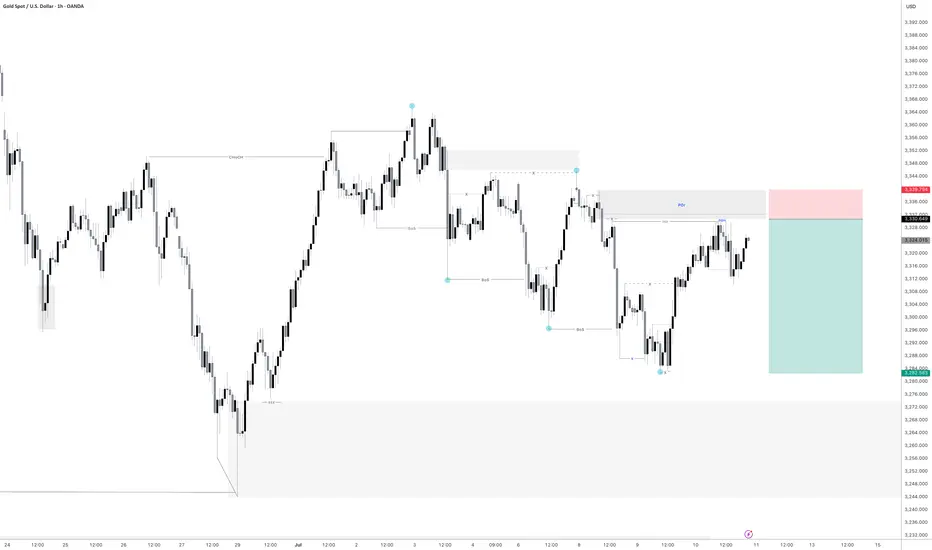
Gold - Sell inboundGold is looking very promising for another sell off. we are already showing signs that price has intent to move lower with some lower timeframe break of structure.
Just waiting for a manipulation now of the most recent highs put in before price moves lower.
Let's see if we get an entry tonight.
BTC Leg2 115KBINANCE:BTCUSDT major movement from base 98K S to 106K $.BTC want to next movement to 115K $ but in middle of way 110K $ level there are sellers.
Support: 106.000 - 102.000
Resistance: 110.400 - 115.000
⚠️Control Risk Management

CADJPY is in the Up Trend Hello Traders
In This Chart CADJPY HOURLY Forex Forecast By FOREX PLANET
today CADJPY analysis 👆
🟢This Chart includes_ (CADJPY market update)
🟢What is The Next Opportunity on CADJPY Market
🟢how to Enter to the Valid Entry With Assurance Profit
This CHART is For Trader's that Want to Improve Their Technical Analysis Skills and Their Trading By Understanding How To Analyze The Market Using Multiple Timeframes and Understanding The Bigger Picture on the Charts

XAUUSD Long 11-07-2028My humble prediction for XAUUSD to go long when it breaks out of the triangle. Buy when it hits the fibonacci level 0.236. Wish me luck!

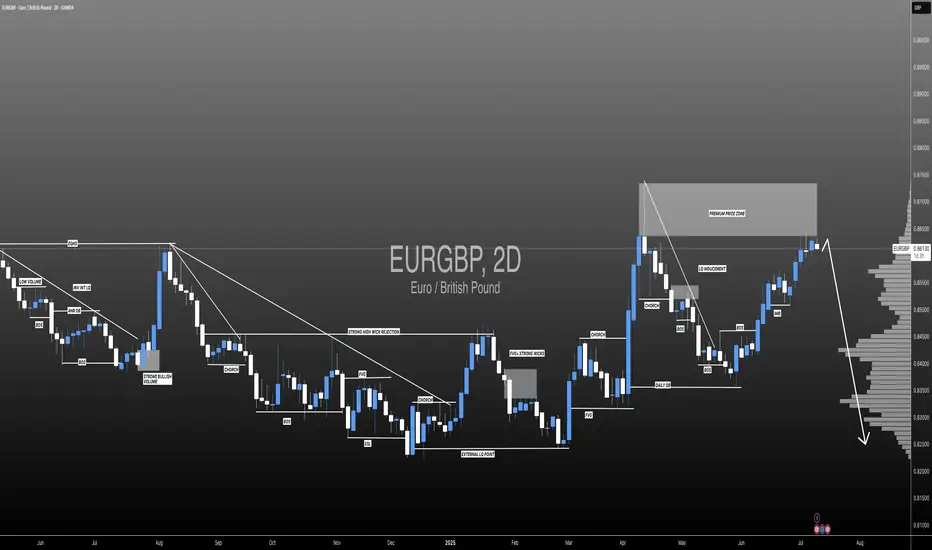
EURGBP: Is This The End Of The Bulls? The GBP/USD pair has exhibited a consistent bullish trend, driven by a remarkable price momentum that is unprecedented in recent history. However, we anticipate a potential bearish reversal, as the market is witnessing a confluence of bearish indicators and increasing volume. Historically, the British pound has held a dominant position in this market, and long-term bears are likely to gain control.
Therefore, it is crucial to closely monitor the incoming market volume and, most importantly, the prevailing market sentiment. Your continued support throughout this journey is greatly appreciated. If you wish to encourage us, kindly like and comment on our ideas.
Team Setupsfx_
❤️❤️🚀🚀
PEPEUSD going to moon according to my analysis. {08/june/2025}Educational Analysis says that PEPEUSD may give trend Trading opportunities from this range, according to my technical analysis.
Broker - binance
So, my analysis is based on a top-down approach from weekly to trend range to internal trend range.
So my analysis comprises of two structures: 1) Break of structure on weekly range and 2) Trading Range to fill the remaining fair value gap
Let's see what this pair brings to the table for us in the future.
Please check the comment section to see how this turned out.
DISCLAIMER:-
This is not an entry signal. THIS IS FOR EDUCATIONAL PURPOSES ONLY.
I HAVE NO CONCERNS WITH YOUR PROFIT OR LOSS,
Happy Trading, Fx Dollars.

BTC/USDT Multi - time frame analysis and {4HR }BTC/USDT Multi-Timeframe SMC Analysis – July 8, 2025
1. Top-Down Analysis:
Daily Timeframe (Macro Market Structure & Narrative - Inferred from chart context):
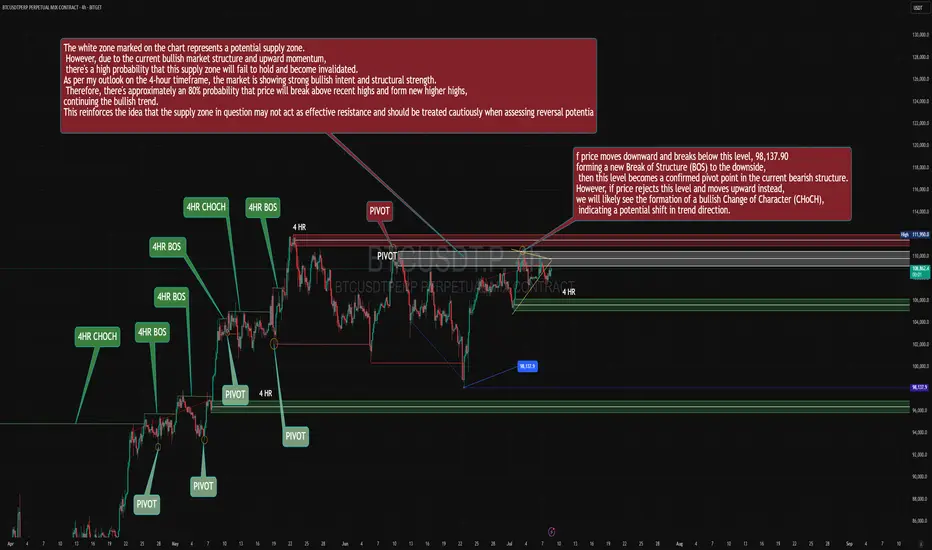
The broader market structure indicates a prolonged consolidation phase, initiated around mid-June, characterized by defined support and resistance levels. The identified supply zone, ranging approximately from $108,000 to $109,500 and labeled as "Potential Supply Zone" on the chart, is a key daily-level area.
Crucially, despite entering this daily supply, the strong underlying bullish order flow suggests a high probability that this supply zone may not act as an effective distribution point. The overarching narrative from higher timeframes indicates robust institutional buying pressure, implying a potential shift in the broader trend to unequivocally bullish upon a clear breach of this daily supply.
4H Timeframe (Swing Structure, Internal BOS/CHoCH):
The 4H swing structure explicitly displays a very clear bullish order flow. We observe a series of consecutively confirmed CHoCH (Change of Character) and BOS (Break of Structure) to the upside (indicated by "4HR CHOCH" and "4HR BOS" annotations). This unequivocally establishes a decidedly bullish 4H swing bias.
The most recent 4H BOS occurred around the $107,000 level, after which price has continued its upward trajectory.
Price is currently engaging with a 4H supply zone (marked by the white box). However, given the dominant bullish order flow on the 4H, there is a high probability that this supply zone will be invalidated, allowing price to extend its bullish movement. This phenomenon often signifies an "Imbalance Fill" or "Liquidity Grab" by smart money to fuel further upside.
1H Timeframe (Entry-Level Structure & POIs):
The 1H timeframe currently reflects a phase of consolidation or minor correction following the recent bullish impulse.
In alignment with the decisive bullish 4H bias, any retracement observed on the 1H timeframe is to be considered a buying opportunity.
The "PIVOT" marked around $105,000 serves as a potential 1H demand area, which could be a target for a deeper retracement before the continuation of the bullish move. However, considering the current market strength, price might not even reach this level and could resume its ascent from current or slightly higher levels.
The current "PIVOT" at approximately $108,500 represents a temporary internal resistance. A decisive break and sustained close above this pivot would provide stronger confirmation for the continuation of the bullish trend.
2. Identification:
Clean Breaks of Structure (BOS) and Changes of Character (CHoCH):
4H: Multiple clear bullish BOS and CHoCH events, indicative of strong bullish order flow.
1H: Internal structure currently shows consolidation prior to a likely bullish BOS to new highs.
Valid Supply & Demand Zones (Unmitigated only):
Unmitigated 4H/1H Supply Zone: Approximately $108,000 - $109,500 (marked by the white box). However, as noted, it is anticipated to be invalidated due to the overall bullish order flow.
Unmitigated 4H/1H Demand Zones: Lower down, around the $105,000 PIVOT and the green-shaded regions on the chart (potential demand areas that would activate upon a deeper retracement).
Internal and external liquidity pools (buy/sell-side):
External Buy-side Liquidity: Above the all-time highs or previous "High" (observed at $111,900 on the prior chart).
Internal Buy-side Liquidity: Above current range highs (approx. $109,500) and above recent pivots.
Internal Sell-side Liquidity: Below recent 1H pivots, particularly below $107,000 and $105,000 (which could act as inducement).
Inducement patterns and liquidity grabs (internal sweeps):
Any minor retracement or downside fluctuation from the current supply zone could act as inducement to draw in sellers, before price resumes its bullish trajectory.
Previous sweeps to the downside have served as confirmation of liquidity accumulation for prior bullish moves.
Order blocks, FVGs, mitigation blocks, and imbalance zones:
Given the impulsive nature of the bullish moves, bullish FVGs and OBs should be considered in retracements (e.g., around the $105,000 demand area).
The current supply zone (white box) also contains OB/FVG, but as mentioned, its invalidation probability is high.
Active market range and internal liquidity engineering:
The active 4H market range encompasses the recent bullish move from $102,000 to current highs.
Internal liquidity engineering currently involves drawing sellers into the supply zone and subsequently invalidating it for continued bullish advancement.
3. Delivery:
Directional Bias with Contextual Narrative:
Strongly Bullish. The 4H order flow is unequivocally bullish, with repeated confirmations of bullish BOS and CHoCH. While price is entering a supply zone, the overall bullish strength suggests it is highly probable this zone will be invalidated, leading to further upside to target new highs. The market narrative points towards a continuation of the uptrend, targeting external buy-side liquidity.
Actionable Setup (Long):
Asset: BTC/USDT Perpetual Futures
Entry Level (POI, OB or FVG):
Scenario 1 (Aggressive Entry - given market strength): Enter long within the $107,500 - $108,000 range (upon confirmation of bullish price action on the 1H or 15-minute timeframe within the supply zone, indicating its invalidation). This entry presumes the supply zone will be breached.
Scenario 2 (Conservative Entry - upon retracement): Enter long within the $105,000 - $105,200 range (the pivot area and potential demand zone). This point would activate upon a deeper retracement into a discount area.
Given the chart and current strength, Scenario 1 appears more probable, but price action confirmation is critical.
Stop-Loss (Invalidation Structure):
For Scenario 1: Place stop-loss below the last valid 1H structural low that confirms the bullish impulse, or below $106,500.
For Scenario 2: Place stop-loss below the demand zone and below the $104,500 pivot, e.g., $104,000.
Target Level (Minimum 3R+):
Target 1 (1R): $109,500 (Break of current supply range high and liquidity grab).
Target 2 (2R): $111,000 (Retest of previous "High").
Target 3 (3R+ / Primary Target): $112,500 - $113,500 (Formation of new highs and targeting fresh buy-side liquidity).
R-multiple Calculation Example: If for Scenario 1, entry is $107,700 and stop is $106,500 (1200 points risk), a 3R target would be $107,700 + (3 * $1200) = $111,300, which aligns with our targets.
Confluences:
Multi-Timeframe Alignment: Decisive bullish 4H order flow provides strong support for a bullish bias, treating any retracement as an opportunity.
Liquidity: New highs and external buy-side liquidity serve as clear targets.
Supply Zone Weakness: Despite price entering a supply zone, the underlying bullish strength suggests its probable invalidation.
Pivot Price Action: Repeated bullish pivots and structural breaks confirm the trend.
This analysis presents a high-conviction long setup for BTC/USDT. However, close attention to price action confirmations on lower timeframes (e.g., 1H or 15-minute) within the current supply zone will be crucial for aggressive entry. Should price retrace, anticipate a bounce from lower demand zones.
Disclaimer: This is a market analysis based on current price action and structure. It does not constitute a buy or sell signal. Always conduct your own research and risk assessment before taking any trades
BITGET:BTCUSDT.P
DXY-Technical Analysis DAILY Timeframe 📊 DXY – Technical Analysis (1D Timeframe)
🔷 Overall Trend:
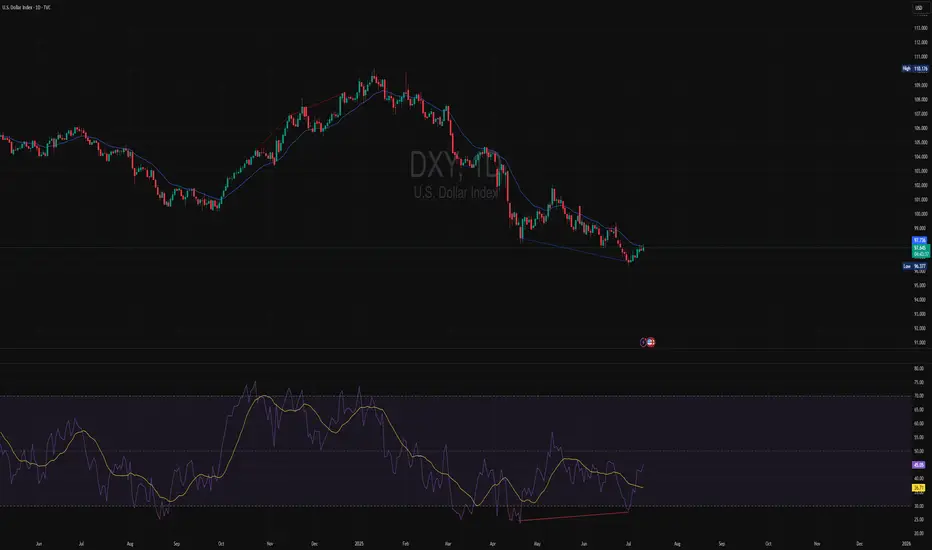
The Dollar Index (DXY) has been in a strong downtrend for several months, forming multiple confirmed Breaks of Structure (BOS) to the downside.
However, recent price action is showing signs of momentum loss and potential exhaustion from sellers near the current lows.
🟡 Market Structure:
Price recently formed a lower low, but momentum indicators are showing bullish divergence — suggesting the downward pressure is weakening.
A small bullish reversal candle has printed, indicating potential short-term buying interest.
There is no confirmed bullish CHoCH yet, but structure is starting to slow down and compress — signaling a possible shift.
📉 Indicators (RSI ):
RSI is rebounding from oversold territory, showing potential early reversal signals.
The confirms bullish divergence and shows fading bearish momentum.
Overall, sellers are showing reduced strength, increasing the chance of a corrective move to the upside.
🔹 Key Levels:
Immediate resistance zones:
🔹 97.23 and 97.73 — key levels to watch for bullish continuation.
Major support:
🔻 96.34 – 96.50 — current low area that if broken, will confirm further downside.
✅ Conclusion:
While DXY remains structurally bearish, the recent bullish divergence, loss of selling momentum, and RSI recovery suggest the potential for a short-term correction or bounce.
A confirmed CHoCH and break above 97.73 would signal a potential shift to bullish structure.
If price fails to break resistance and drops below 96.34, the bearish trend is likely to continue.
🟢 Scenario Table:
Scenario Trigger Implication
Bullish shift Break above 97.73 with CHoCH Potential trend reversal
Continuation bearish Break below 96.34 Downtrend continuation
Disclaimer: This analysis is for informational and educational purposes only. It does not constitute financial advice or a recommendation to buy or sell any asse
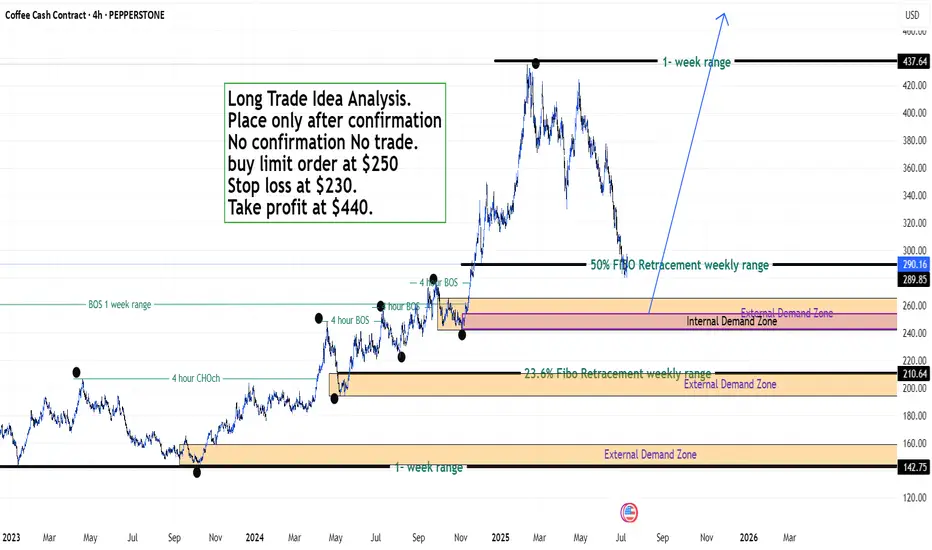
Coffee Trade Analysis - Fx Dollars - {11/07/2025}Educational Analysis says that Coffee (Commodity) may give trend Trading opportunities from this range, according to my technical analysis.
Broker - NA
So, my analysis is based on a top-down approach from weekly to trend range to internal trend range.
So my analysis comprises of two structures: 1) Break of structure on weekly range and 2) Trading Range to fill the remaining fair value gap
Let's see what this Commodity brings to the table for us in the future.
Please check the comment section to see how this turned out.
DISCLAIMER:-
This is not an entry signal. THIS IS FOR EDUCATIONAL PURPOSES ONLY.
I HAVE NO CONCERNS WITH YOUR PROFIT OR LOSS,
Happy Trading, Fx Dollars.
BTC 1 hr technical analiysis Asset: BTCUSDT.P (Bitcoin Perpetual Futures)
Timeframe Provided: 1-Hour (1H)
BITGET:BTCUSDT.P
1. Higher Timeframe Bias (Assumed for 1H Context):
Based on the observed price action, specifically the strong impulsive bullish move around July 2nd-3rd, followed by a corrective pullback, it is reasonable to assume a bullish bias from the higher timeframes (Daily/4H). This assumption is crucial, as the 1H timeframe should ideally align with the dominant higher timeframe trend for high-probability setups. The strong push above previous resistance and the subsequent retracement suggest the potential for a continuation of an uptrend.
2. 1-Hour Structure Analysis:
Initial Structure: The price was generally ranging or in a slight downtrend until around July 2nd. We observe multiple internal bearish Break of Structures (1H BOS in red).
Change of Character (CHoCH): A significant bullish 1H CHoCH is observed around July 2nd, indicating a shift from a bearish to a bullish internal structure. This shift was followed by strong bullish momentum.
Break of Structure (BOS): After the CHoCH, the market showed clear bullish 1H BOS, confirming the new bullish impulse.
Current Structure: The market has recently pulled back significantly after the strong bullish impulse. This pullback has tested a key demand zone. We are looking for a continuation of the bullish trend from this pullback.
3. Liquidity and Inducement:
Sell-Side Liquidity (SSL): Prior to the bullish CHoCH, there were clear areas of sell-side liquidity that were swept, fueling the subsequent upward move.
Inducement: The current pullback, while corrective, may be acting as an inducement, drawing in early buyers or trapping sellers, before potentially continuing the upward movement. Price has swept some internal liquidity during this retracement.
4. Valid Demand/Supply Zones (1H):
Primary Demand Zone: The most prominent demand zone of interest is located roughly between $107,000 and $107,300. This zone represents an unmitigated order block (or a clear area of strong institutional buying) that initiated the significant bullish impulse. It also aligns with previous resistance that was broken and is now potentially acting as support (a "flip zone"). This is our primary point of interest for a long entry.
Mitigation: Price has begun to tap into this demand zone, indicating a potential mitigation phase.
5. Trade Setup Proposal (High Probability Long Setup):
Considering the assumed higher timeframe bullish bias and the current 1H structure, a long setup from the identified demand zone presents a high-probability opportunity.
Bias: Bullish
Entry Strategy: We are looking for confirmation within the demand zone. Given the 1H chart, a refined entry could be sought on a lower timeframe (e.g., 15M or 5M) for further confirmation (e.g., an internal CHoCH, aggressive entry within the order block). However, based on the provided 1H chart:
Proposed Entry Price: Around $107,150 - $107,250. This is within the heart of the unmitigated demand zone. The visual suggests an entry around $107,200.
Stop Loss (SL): Slightly below the low of the demand zone/order block, and crucially, below any structural low that would invalidate the bullish short-term structure.
Proposed SL Price: Around $106,750 - $106,900. The visual places the SL at approximately $106,900. This allows for some wick hunting but protects capital if the demand fails.
Target (TP): We will target the high of the recent bullish impulse, and potentially higher if the higher timeframe bias confirms a sustained uptrend.
Proposed TP Price: Initial target at the recent high around $110,900 - $111,000. The visual suggests $110,950.
Rationale for TP: This target represents the next logical liquidity pool (buy-side liquidity) and a significant structural high that, if broken, would confirm further bullish continuation.
Risk to Reward Ratio (RRR):
Entry: ~$107,200
SL: ~$106,900 (Risk: $300)
TP: ~$110,950 (Reward: $3750)
Calculated RRR: Approximately 1:12.5. This is an exceptional RRR and highlights the potential of this setup.
6. Important Considerations & Trade Management:
Confirmation: While the 1H demand zone is strong, for institutional-level entries, further confirmation on lower timeframes (e.g., a CHoCH or clear bullish momentum shift on the 5M/15M chart once price enters the demand zone) would be ideal.
Market News/Events: Always be aware of upcoming high-impact economic news (e.g., CPI, FOMC minutes, NFP) that could induce high volatility and invalidate technical setups. For crypto, major exchange news, regulatory announcements, or large whale movements can also impact price. As of Saturday, July 5th, 2025, there are no immediate high-impact economic data releases on the calendar for this weekend, but traders should always check the economic calendar for the upcoming week.
Partial Take Profits: Consider taking partial profits at intermediate highs or psychological levels to secure gains and reduce risk.
Trailing Stop Loss: Once the trade moves significantly in profit, consider trailing your stop loss to break-even or beyond to protect capital.
This detailed analysis, even with the limitation of a single timeframe, provides a clear, high-probability long setup based on advanced SMC principles. Monitor price action closely at the entry point and manage risk diligently.
Disclaimer: This analysis is purely for educational and analytical purposes and does not constitute a buy or sell recommendation or financial advice. All trading decisions must be made based on individual analysis, proper risk management, and careful consideration of market conditions by the trader themselves. As an AI model, I bear no financial responsibility for the outcomes of your trades.

USDJPY| 15| Liquidity Grab + Choch reaction Price formed a basic CHoCH after sweeping sell-side liquidity and creating a temporary low. A short setup was taken from a lower timeframe supply zone, aligned with bearish order flow and rejection at imbalance.
🔹 Sell-side Liquidity Sweep
🔹 CHoCH Confirmation
🔹 Rejection from Supply
🔹 Expecting bearish continuation if price holds below 146.52
Invalidation: If price closes above the LQ CHoCH zone, I’ll shift bias to longs. Until then, I’m holding the short narrative.
#SMC #USDJPY #OrderFlow #LiquiditySweep #FXTradingClub #PriceAction #CHoCH

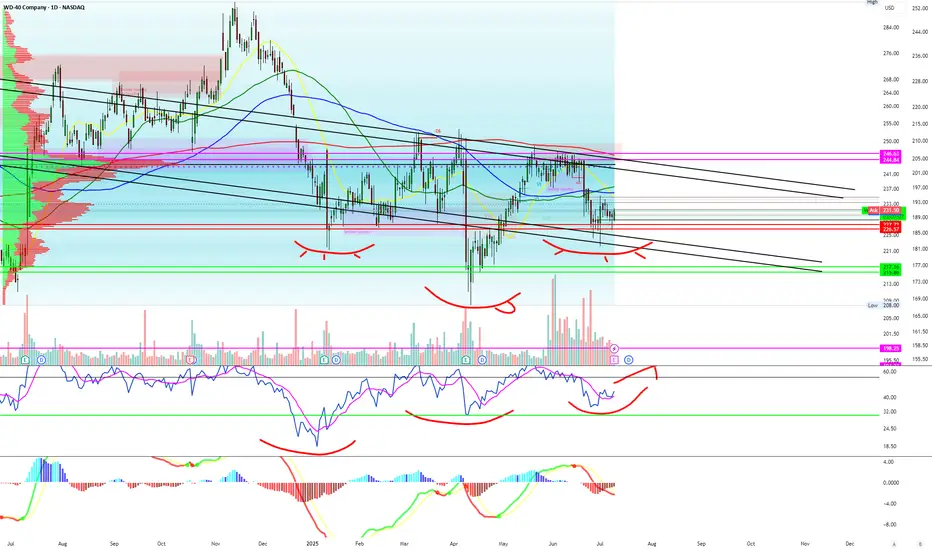
Never thought I'd be bullish WD-40 LMAOAll indicators such as RSI, descending channel pattern and MACD combined with options exposure make me believe earnings will be good in the stock prices eyes.
IWM and small cap stocks are really starting to pop off and nothing is more American then WD-40!!!
Target #1 - $240
Target #2 - $250
GBPUSD | ChoCh & FVG Reversal playPrice broke bullish structure and created a Clear Change of Character (CHoCH) after sweeping the lows, indicating a shift in momentum. A valid entry setup formed as price tapped into the refined demand zone + FVG, aligning with an overall bullish reversal idea.
🔹 CHoCH confirmation
🔹 Break of trendline (liquidity sweep)
🔹 FVG + Demand zone alignment
🔹 Targeting the inefficiency fill and supply mitigation above
Expecting a push back toward premium pricing before reevaluation. Let’s see if the algo delivers.
#SMC #GBPUSD #CHoCH #FairValueGap #Orderflow #FXTradingClub #PriceAction

AUDUSD ENTRY CHARTOn this Pair, we are still BEARISh, the Dollar is still very much Strong,price retrace back to our H1 zone that we have been watching out for, we got our Entry Confirmations with other Confluences, If this matches with your Trade idea, you can add to your watch-list, and if joined, kindly dont forget to move BREAK-EVEn,after +1R, or check the update section, THANK YOU, and Dont forget to RISK WISELY

Penguusdt Buy opportunityPENGUUSDT is exhibiting a potential bullish pennant formation, with price making a strong breakout from the consolidation zone.
It recently found resistance near the top of the pennant pole around the $0.0176 level, which aligns with the Immediate Internal Resistance Level (IIRL).
The current plan is to watch for a pullback into the designated buy-back zone, offering a possible re-accumulation opportunity. If the structure holds, the projected pennant target sits around the $0.043 zone, as illustrated on the chart.

Break of downward sloping channel LongNike has swept liquidity and is now showing a strong bounce to the upside.
Although I didn’t manage to enter the initial long, I am monitoring for a break above the current downward-sloping channel. A clean breakout followed by a retest would provide a more reliable entry point. I’m not aiming to catch the absolute bottom—I’d rather wait for confirmation of trend reversal.
A move above the monthly level at 79.46 would be an additional sign of strength and increase conviction in the long setup.
There is still significant overhead resistance, particularly around the point of control aligned with the anchored VWAP near 92.50. That area would be my first target. However, if momentum continues, there is potential for a move towards the 122 level.

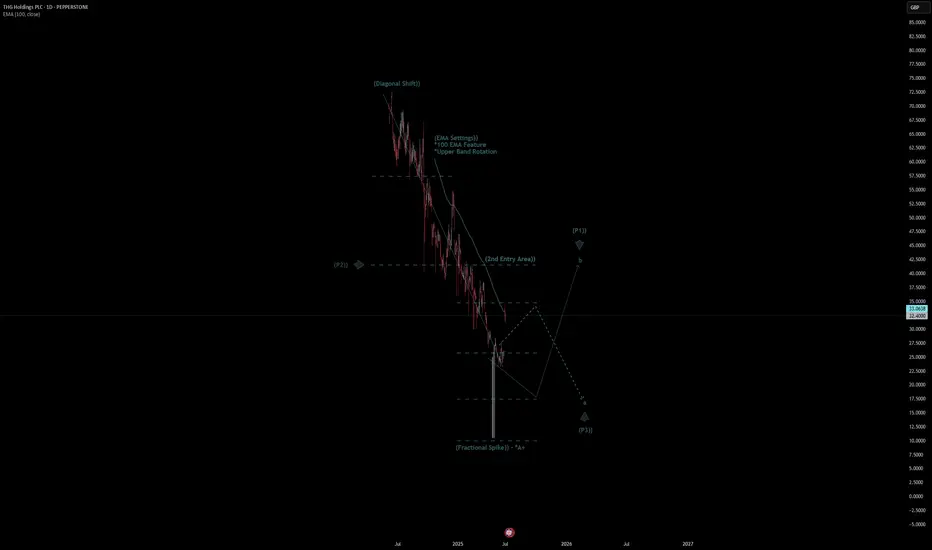
THG Holdings PLC Quote | Chart & Forecast SummaryKey Indicators On Trade Set Up In General
1. Push Set Up
2. Range Set Up
3. Break & Retest Set Up
Notes On Session
# THG Holdings PLC Quote
- Double Formation
* (Fractional Spike)) - *A+ | Completed Survey
* (EMA Settings)) - *100 EMA Feature | Subdivision 1
- Triple Formation
* (P1)) / (P2)) & (P3)) | Subdivision 2
* (TP1) = a / Long Consecutive Range
* (TP2) = b / Short Consecutive Pullback | Subdivision 3
* Daily Time Frame | Trend Settings Condition
- (Hypothesis On Entry Bias)) | Indexed To 100
- Position On A 1.5RR
* Stop Loss At 54.00 GBP
* Entry At 46.00 GBP
* Take Profit At 34.00 GBP
* (Downtrend Argument)) & No Pattern Confirmation
- Continuation Pattern | Not Valid
- Reversal Pattern | Not Valid
* Ongoing Entry & (Neutral Area))
Active Sessions On Relevant Range & Elemented Probabilities;
European-Session(Upwards) - East Coast-Session(Downwards) - Asian-Session(Ranging)
Conclusion | Trade Plan Execution & Risk Management On Demand;
Overall Consensus | Sell
The price is climbing toward the top of the channel.OANDA:XAUUSD
We are currently in a wide descending channel on the 1-hour timeframe, and a potential move upward toward the top of the channel is expected.
Note: Our previous analysis on gold (XAUUSD) remains valid and intact.

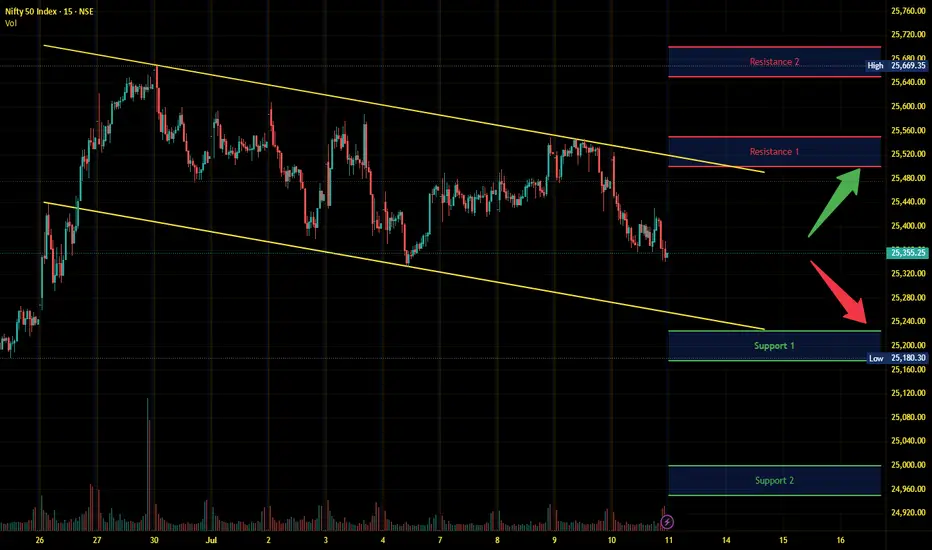
Nifty Intraday Analysis for 11th July 2025NSE:NIFTY
Index has resistance near 25500 – 25550 range and if index crosses and sustains above this level then may reach near 25650 – 25700 range.
Nifty has immediate support near 25225 – 25175 range and if this support is broken then index may tank near 25000 – 24950 range.