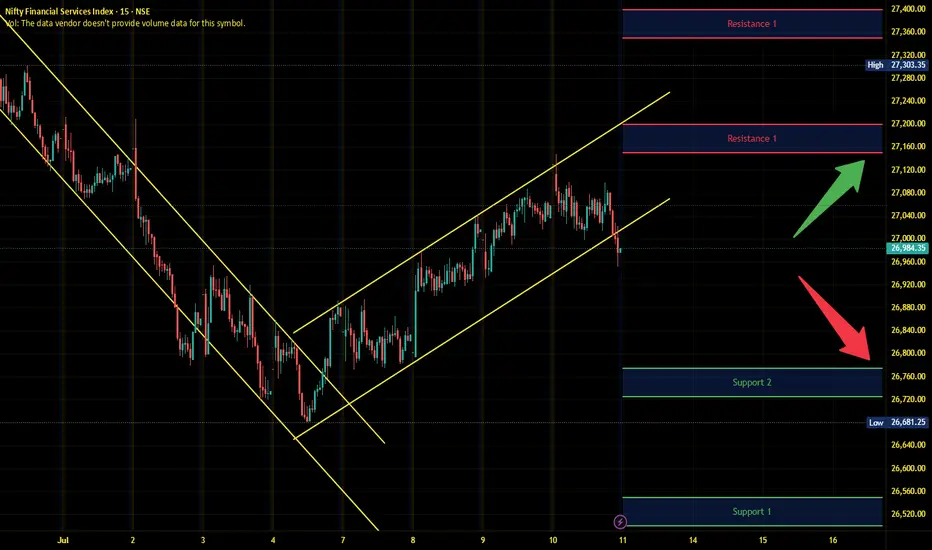
Finnifty Intraday Analysis for 11th July 2025NSE:CNXFINANCE
Index has resistance near 27150 - 27200 range and if index crosses and sustains above this level then may reach near 27350 - 27400 range.
Finnifty has immediate support near 26775 – 26725 range and if this support is broken then index may tank near 266550 – 26500 range.
Supply and Demand
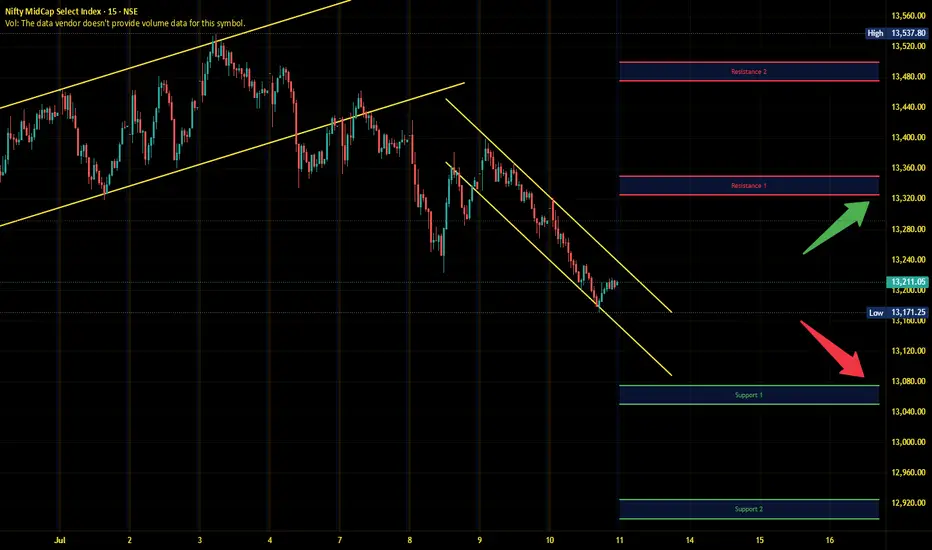
Midnifty Intraday Analysis for 11th July 2025NSE:NIFTY_MID_SELECT
Index has immediate resistance near 13325 – 13350 range and if index crosses and sustains above this level then may reach 13475 – 13500 range.
Midnifty has immediate support near 13075 – 13050 range and if this support is broken then index may tank near 12925 – 12900 range.
Could Cardano become a crypto unicorn?And make a 3rd new all time high in subsequent cycles.
One fib extension certainly suggests that is possible pointing towards around $4.80
Let's see ... things can mover very fast during altseason.

If you bought Kadena last cycle...you have to be DCA'ing in this zone, to give yourself a chance to exit with some gains in the upcoming pump.

Can the Graph chart a recovery rally into resistance?Quite a few multiples if it can!
Entires in the support band represent low risk entries
(compared to last cycles elevated valuation's)

Gas Market: Short-Term Stability vs. Long-Term TensionCAPITALCOM:NATURALGAS MCX:NATURALGAS1! NYMEX:NG1! PEPPERSTONE:NATGAS
This analysis was prepared by Dr. Igor Isaev in cooperation with Anastasia Volkova, analyst of LSE.
The natural gas market presents a mixed outlook as we enter Week 28. Last week, Summer 2025 contracts traded slightly above their median pre-expiry levels, staying within historical volatility ranges since 2010. Winter 2026-27 contracts held firmly above the upper bounds of the 10-day pre-expiry band, signaling persistent concerns over supply and weather-related risks. Analysts expect prices to stabilize in the near term, but the forward curve tells a different story. While 2025 contracts with three-year delivery terms have aligned with 2023-2024 prices for similar terms, a significant skew persists in short-term (1-2 years) and long-term (5-6 years) tenors compared to 2020-2024 benchmarks, hinting at underlying structural uncertainty.
Fundamentals show signs of stabilization. For Week 27 (June 28 - July 3), storage injections rebounded to +63 billion cubic feet (BCF), pushing inventories above the five-year median. Injection rates recovered from last week’s dip, and if current supply and demand conditions hold, we could see 2024 peak storage levels. Yet, weather and seasonal factors in the second half of summer pose a limiting challenge. NOAA data indicates a gradual weather stabilization: Week 28 remains hot compared to the past 30 years, but forecasts predict a return to the median by Week 29.
The accompanying graph (Right lower graph) highlights this trend, with candlesticks showing quantiles from 1994 to 2024—red dots for 2024, green for 2025, and blue for 2025 predictions. Regionally, this stabilization pattern holds across nearly all areas.
Despite these gains, the supply-demand balance lags behind historical norms. In Week 28, the net difference between supply and demand remains well below the median for 2014-2024, suggesting that short-term calm masks deeper imbalances. The afterword underscores this tension: while storage growth and weather normalization offer relief, the forward curve’s divergence reflects market unease about systemic risks—be it policy shifts, infrastructure issues, or long-term demand volatility. For now, sentiment stays cautiously neutral, supported by recent injections but shadowed by unresolved signals farther out.

Bullish ICT Entry 15 minute Entry:
1. Sell - side liquidity swept.
2. BOS up onM15 confirm shift.
3. Entry from bullish OB or FVG after pullback.
4. SL below liquidity sweep.
5. TP internal high/TP2 premium zone.


CROUSDT trading ideaCROUSDT is holding above the Immediate Demand Zone near $0.068. A successful defense here could trigger a bullish recovery targeting $0.166, $0.232, and possibly $0.881 if price breaks the long-term descending trendline and reclaims the Internal Supply Zone. However, a breakdown below this level could send price toward the Crucial Demand Area around $0.039.

EURJPY 60/5 Pullback LongOverall up trend. Patiently waiting the pull back to the buy zone and long.

VRAUSDT correction is done time to flyVRAUSDT is presenting a clear completion of a WXY corrective structure into the defined Area of Interest, offering a potential re-accumulation opportunity. Price is currently reacting from the major demand zone with initial upside targets around 0.005284 and a secondary target aligning with the Supply Zone of Interest near 0.015081. The overall structure suggests a corrective phase conclusion with prospects of a new bullish impulse. Future validation will depend on sustained bullish momentum from the current demand area.

DOGE/USDT – Breakout Retest Long SetupDOGE has broken out of local consolidation with momentum and is now retesting the breakout zone, offering a clean long entry with defined invalidation.
Setup Thesis:
After a strong impulse move, price pulled back with low aggression, signaling profit-taking rather than reversal. The current candle structure suggests demand is stepping in at prior resistance-turned-support. This is a textbook breakout-retest continuation setup.
Trade Plan:
Entry: ~$0.1810
Stop Loss: Below ~$0.1764 (beneath breakout zone and structure)
Target: ~$0.1940
R/R: Favorable risk profile with strong reward potential
Confirmation Factors:
Impulsive breakout
Controlled pullback with no aggressive selling
Retest occurring at structural pivot
Still aligned with broader uptrend context
Execution Note:
This setup works best with strong follow-through in the next couple of candles. If price stalls or closes below the stop zone, it's invalidated.

Thursday July 10th – EURUSDEURUSD didn’t give us any trade setups yesterday and is still respecting the short-term bearish trendline. Price has remained below 1.17500, acting as resistance, and hasn’t given confirmation for buys.
We’re still watching the same key zones:
✅ Safe buys: Above 1.17500 if we get a solid break and bullish close.
✅ HRHR buys: Retest of 1.16898 (Wednesday's low) showing rejection or support.
Until either of those levels are tapped, I’m not taking trades on this pair. Current structure still offers no low-risk opportunities. Let it come to us.

USDCAD – July 10 OutlookUSDCAD’s high-risk, high-reward (HRHR) sells from Wednesday are still in play with price currently up 35 pips. Price action remains within the structure as we continue to respect the March trendline, but are now stalling in a tight 4H range.
📍 Key Observations:
1.36647 is acting as strong intraday support
Possible retest of yesterday’s or Wednesday’s high could provide another HRHR sell opportunity
Break below 1.36527 could open the door for a clean 70-pip move toward 1.35827
🔔 Summary: Patience is essential—watching for either another short-term rejection at resistance or a clean structural break to continue the broader bearish bias.

BankNifty levels - Jul 11, 2025Utilizing the support and resistance levels of BankNifty, along with the 5-minute timeframe candlesticks and VWAP, can enhance the precision of trade entries and exits on or near these levels. It is crucial to recognize that these levels are not static, and they undergo alterations as market dynamics evolve.
The dashed lines on the chart indicate the reaction levels, serving as additional points of significance. Furthermore, take note of the response at the levels of the High, Low, and Close values from the day prior.
We trust that this information proves valuable to you.
* If you found the idea appealing, kindly tap the Boost icon located below the chart. We encourage you to share your thoughts and comments regarding it.
Wishing you successful trading endeavors!

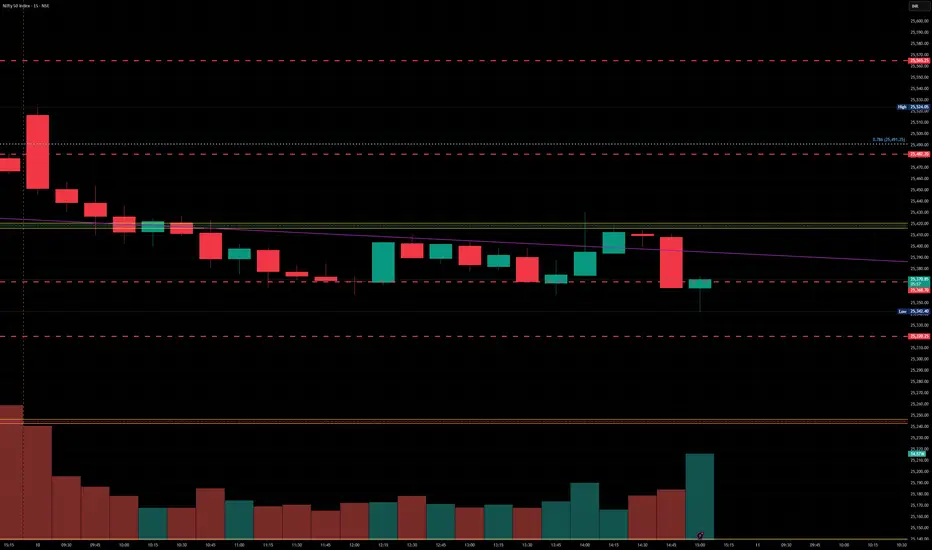
Nifty levels - Jul 11, 2025Nifty support and resistance levels are valuable tools for making informed trading decisions, specifically when combined with the analysis of 5-minute timeframe candlesticks and VWAP. By closely monitoring these levels and observing the price movements within this timeframe, traders can enhance the accuracy of their entry and exit points. It is important to bear in mind that support and resistance levels are not fixed, and they can change over time as market conditions evolve.
The dashed lines on the chart indicate the reaction levels, serving as additional points of significance to consider. Furthermore, take note of the response at the levels of the High, Low, and Close values from the day prior.
We hope you find this information beneficial in your trading endeavors.
* If you found the idea appealing, kindly tap the Boost icon located below the chart. We encourage you to share your thoughts and comments regarding it.
Wishing you success in your trading activities!
$XAUUSD / Gold - Thursday July 10th OutlookYesterday’s price action gave us a clean 200 pip run from the break and retest of 3308, and today we’ve already caught 140 pips using yesterday’s high (3317.17) as intraday support.
But now we’re sitting at a critical inflection point.
📍 Key levels:
Safe Buys: Only looking to buy above Tuesday’s high of 3345.74, which gives room for a clean 200-pip move up toward last Thursday’s high.
Bearish Scenario: If we fail to break that high and instead break yesterday’s high of 3316.65, we may see a sharp 340 pip drop back down to 3282.83.
⚠️ Caution: The 4H bearish trendline from mid-June is still intact, and we're currently testing it. Wait for clear confirmation either way. Higher timeframes remain bullish, so we’re playing both scenarios carefully.

$TIA Breakout Brewing! After months of steady accumulation and LSE:TIA Breakout Brewing!
After months of steady accumulation and holding strong support, #TIA is showing signs of a major trend reversal. Double-digit targets look highly likely in the coming months if momentum continues. 🚀
Hit likes 🚨🚨
.
..
.
.
.
.
#Bitcoin #altcoin #btc #memecoin CRYPTOCAP:BTC NYSE:FET GETTEX:WOO CRYPTOCAP:INJ GETTEX:QNT $tsuka $azero NEWCONNECT:MLT EURONEXT:RNDR LSE:ROSE BIST:LINK CRYPTOCAP:XRP CRYPTOCAP:PEPE #iran #qatar #usa #IsraelIran

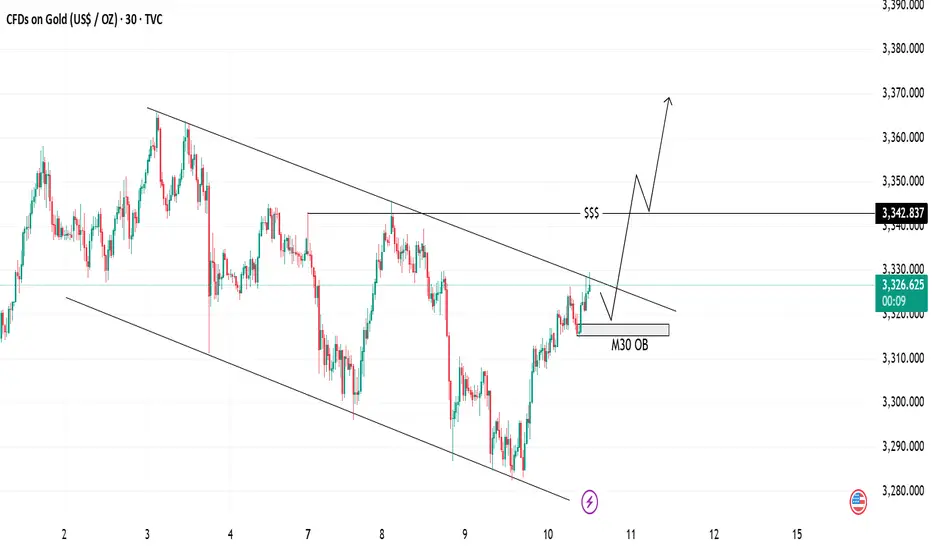
Gold Analysis Bullish Breakout | Trendline & OB Setup📈 Gold Analysis
We are currently seeing price action within a descending channel, testing key support at the M30 OB (Order Block). The price is pushing higher after bouncing off the support level, and the trendlines suggest a potential breakout to the upside.
💡 Key Levels:
Support Zone: 3326
Resistance Zone: 3342
The market is primed for a possible rally, indicated by the upward momentum and price breaking out above the trendline. Watch for confirmation as we approach the liquidity level for further bullish movement.
⚡ Trade Idea: Look for a long entry if price closes above the trendline for a continuation towards the next resistance.
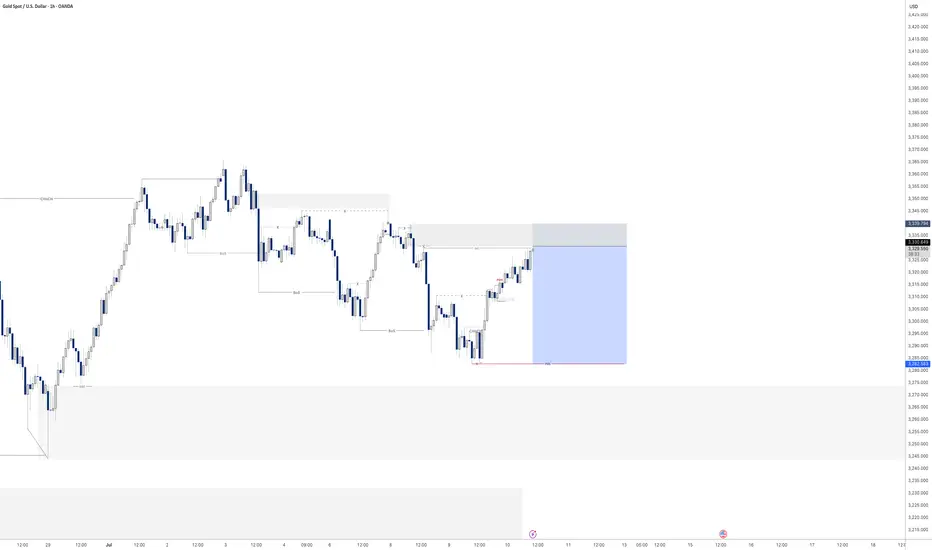
Gold - Sell before longer term buyLooking at gold we are a matter of a few pips away from entry. looking to play gold down till our larger 4H area of demand seeing as we have had a CHoCH to the upside.
There for i will be looking to take my sell position down to 3283.5 at a bare minimum as it was the previous structure level in which we turned around.
Lets see if we get tagged in. If not i will jump down to the lower TF and see if we can get a confirmation that price is going to turn from here.
KOG - DAXDAX:
Let’s have a quick look at DAX and apply the red boxes to the 4H Chart. We have our bullish above indication which if supported, should give us a move into the 23,400 region initially. That’s the level that will need to break to go higher with our ideal target level being above at the 24,6-700 region before a potential RIP.
Please do support us by hitting the like button, leaving a comment, and giving us a follow. We’ve been doing this for a long time now providing traders with in-depth free analysis on Gold, so your likes and comments are very much appreciated.
As always, trade safe.
KOG

BTC Correction's 📉 Significant Bitcoin Correction During Uptrend
After a strong bullish rally, Bitcoin has entered a correction phase, retracing nearly 25% of its recent gains. Interestingly, this correction aligns exactly with the 200-period moving average on the 4-hour chart, marking a potential key support level.
🔍 Is Bitcoin’s Correction Over or Just Beginning?
The overlap with the 200 MA could signal the end of the correction, but if this zone fails to hold, deeper targets between the 35% and 75% retracement levels may come into play.
🛡️ Potential Support Levels for Bitcoin if the Correction Continues:
First support: 102,200 USD – 25% correction
Second support: 93,200 USD – 35% correction
Third support: 84,100 USD – 50% correction
Fourth support: 74,600 USD – 75% correction

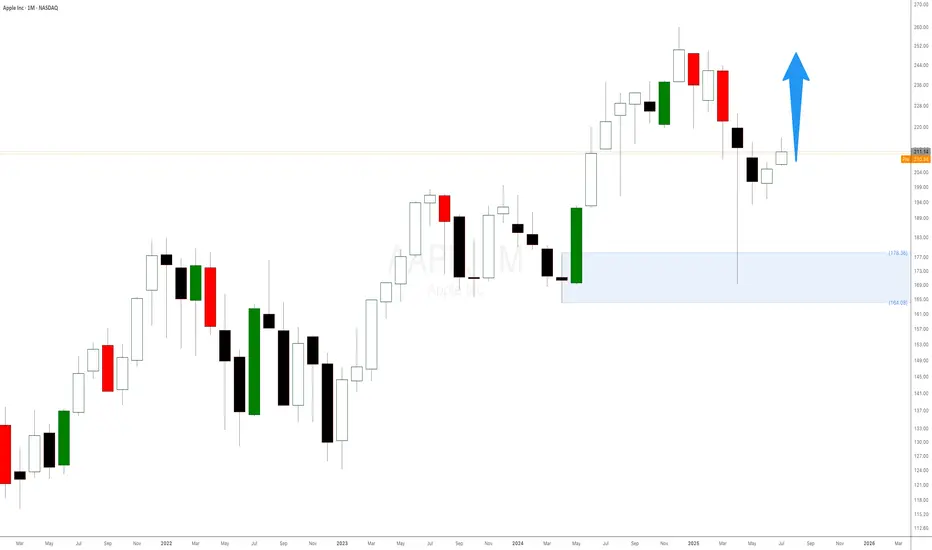
Apple Stock Is Surging! Here’s What Most People MissWhen it comes to trading, we don’t care about the latest news headlines or whether some analyst has upgraded or downgraded Apple stock. We focus on one thing and one thing only: the undeniable forces of supply and demand imbalances on higher timeframes.
Right now, Apple’s monthly chart is a textbook example of how waiting for a strong demand imbalance pays off. That $178 monthly level is no random number. It’s the exact origin of a massive bullish impulse that happened in June 2024 — the kind of move that only happens when smart money and big institutions step in, creating an imbalance that pushes the price away rapidly.
📈 It’s Not About Fundamentals. It’s About Imbalances.
Most retail traders waste time chasing news, earnings, or rumours about iPhone sales. But if you think about it, all those factors are already priced in once a strong imbalance is formed. Institutions don’t wait for tomorrow’s news — they plan their positions weeks or months ahead, and those footprints are visible right on your chart.
The $178 level indicates a significant drop in supply and a surge in demand large enough to propel Apple higher, marked by consecutive large bullish candlesticks. That’s our signal — nothing more, nothing less.