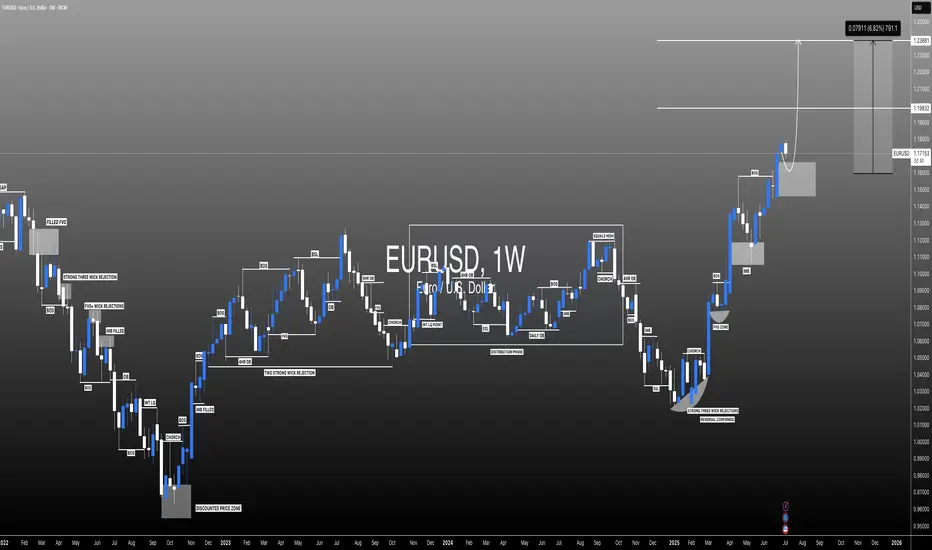
#EURUSD: Last Bullish Price Extension! Get Ready! EURUSD is approaching our buying zone, a key level, which suggests a smooth bullish reversal. As this is a swing trade, we advise keeping stop losses larger. There are two targets to keep an eye on. Remember, this is not a guaranteed move, and this is just our overview. Good luck and trade safely.
Team Setupsfx_
Supply and Demand
GBP/USD – Breakout Confirmation Across TimeframesGBP/USD – Breakout Confirmation Across Timeframes
🔹 Multi-Timeframe Bullish Setup by PULSETRADESFX
GBP/USD is showing a strong bullish shift after breaking out of a well-defined descending channel. Price reacted perfectly from the 1.33400–1.34060 demand zone and is now pushing above descending trendline resistance across the 2H and 4H charts.
This signals early signs of trend reversal, backed by confluence across intraday and higher timeframes.
📌 Trade Setup Details:
Entry: 1.34530 – 1.34550
SL: 1.34060 (Below demand)
TP: 1.35724 – 1.36000 (Upper supply zone / channel target)
The structure is clean, the R:R is healthy, and momentum favors bulls after multiple rejections at key support.
---
✅ Confluences Supporting the Long:
Descending channel breakout (2H & 4H)
Triple demand zone rejection
Break and close above minor resistance
Clean bullish momentum candle
Economic catalysts ahead (watch USD data releases 📅)
📅 July 18, 2025
📊 FOREX.com | GBP/USD (4H, 2H)
#GBPUSD #Forex #BreakoutTrade #BullishSetup #TechnicalAnalysis #TradingView #PULSETRADESFX

AUDJPY - POTENTIAL?USDJPY is getting super interesting.
If we can get some bearish intent to try and induce the early sellers to the downside creating some buyside liquidity then i will be all over this for a trade.
Lets see how price has moved by the morning as it does need a bit more development before we can consider entering for a short position

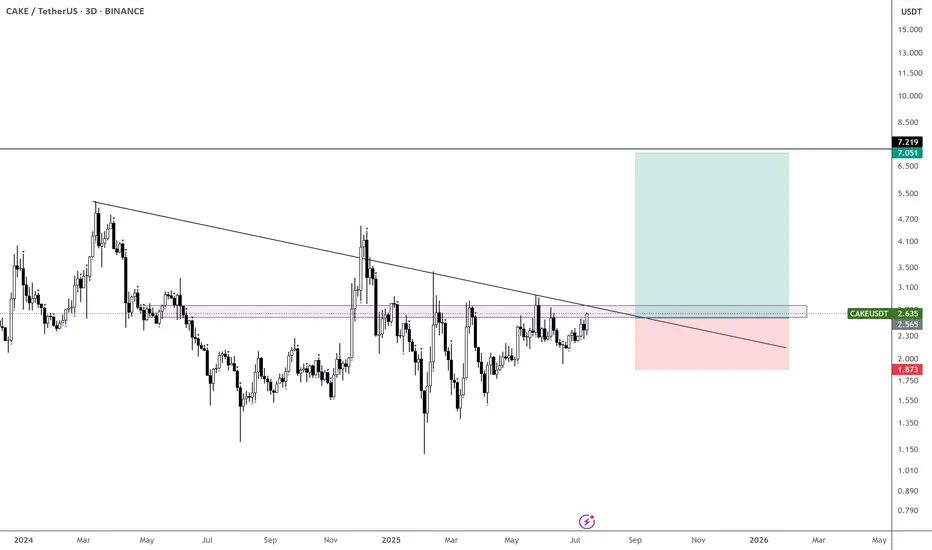
$CAKE is coiling up nicely - Aiming for $7
It hasn’t done much over the past few months, but it’s now above the yearly open and on its 6th attempt to break through the monthly supply zone.
Could this finally be the breakout that leads us toward $7?
Taking bids here and exercising patience.
With CRYPTOCAP:XRP , CRYPTOCAP:ETH , CRYPTOCAP:HBAR , and EURONEXT:ALGO already moving — and possibly CRYPTOCAP:BNB next — this could be a perfect setup for a delayed BINANCE:CAKEUSDT catch-up play.
SHORT ON EUR/CADEUR/CAD has given us a nice CHOC (change of character) to the downside followed by a nice retest to supply.
I expect price to push up a little more into supply before dropping to the next support/demand level.
Looking to Catch 300-400 pips over the next few days.

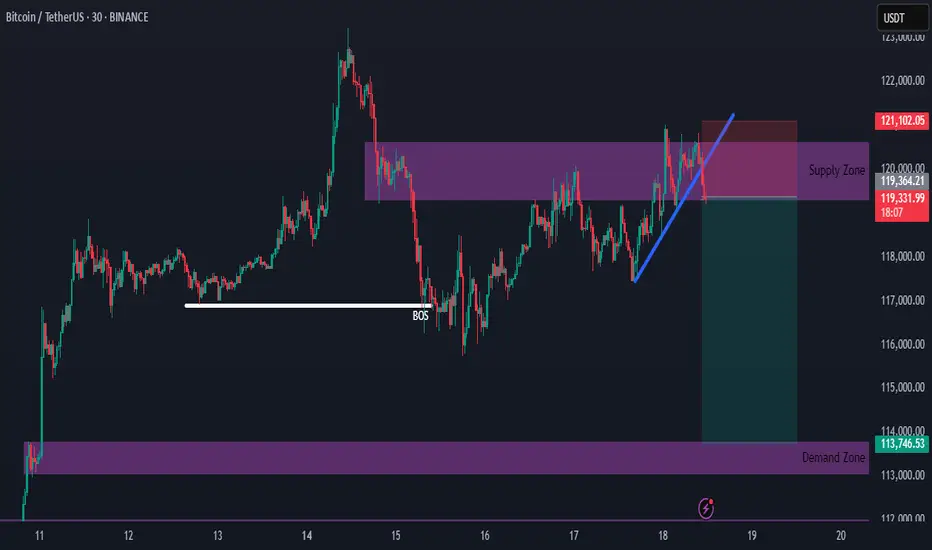
Bitcoin Supply Zone Intact — New Short Setup DevelopingHello everybody!
The supply zone we discussed in the previous idea is still holding.
We have a new opportunity to go short upon the break of the upward trendline.
The most likely target is around 114,000.
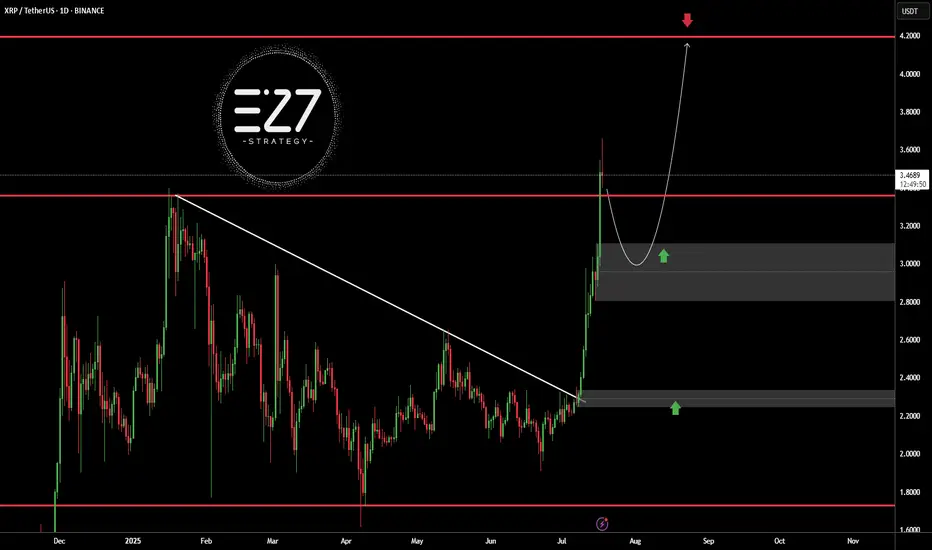
XRPUSDTBINANCE:XRPUSDT broke above its long-term downtrend line and surged to the $3.5000 resistance area, but is now undergoing a correction. The current bullish structure, with a higher high and higher low, suggests the trend remains upward. A pullback toward the $3.0000 demand zone is likely and would be a healthy retracement. Holding this area could trigger a continuation toward the key resistance at $4.2000.
Key Level Price
Main Support $2.2000
Main Resistance $4.2000
Best Buy Range $2.9500 – $3.1500
Best Sell Range $4.1000 – $4.2000
Investment Risk (Buying) Medium
⚠️Please control RISK management
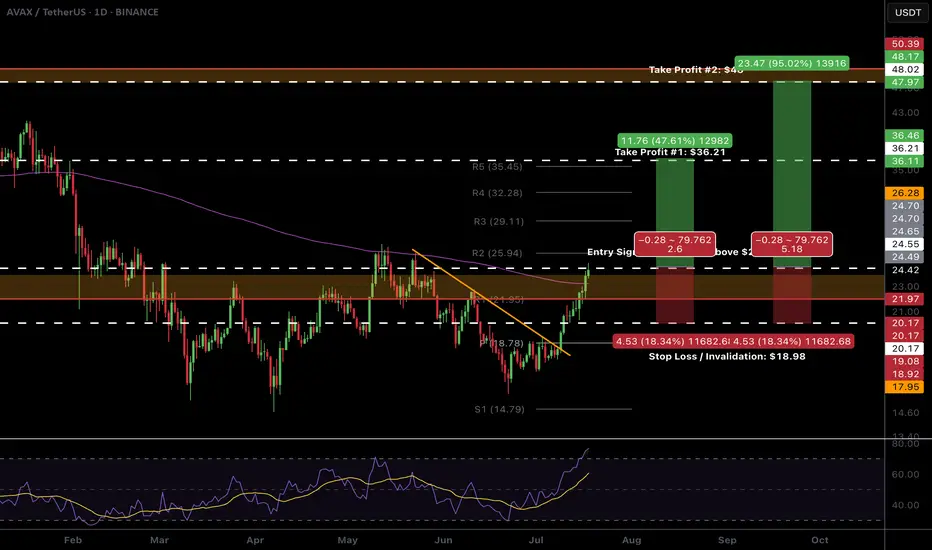
$AVAX Ready to breakout!CRYPTOCAP:AVAX looks ready to pop.
High Volume Node resistance and daily 200EMA is clear and now support. We don't want to see price rejected and moving back below this area.
The R5 daily pivot is my first partial take profit $35-36 followed by the major resistance High Volume Node at $48
Daily RSI is overbought with unconfirmed bearish divergence so watch out for this but should be good to run in the mean time. BTC permitting...
Safe trading
SHIBUSDT🕯 The key resistance level, identified as the best resistance for a break and pump, stands at 0.0000135, with a potential price increase to 0.00001567 if breached, serving as the next target (Pullback level). On the support side, the main level is observed at 0.0000115, and should the price fall below this, it may decline further to the lower Major Level of 0.0000100.
🔽 Resistances:
Main resistance level: 0.0000135 (potential break for pump)
Next target (Pullback level): 0.00001567
🔼 Supports:
Main support level: 0.0000115
Lower level (Major Level): 0.0000100
⚠️Contorl Risk management for trades.

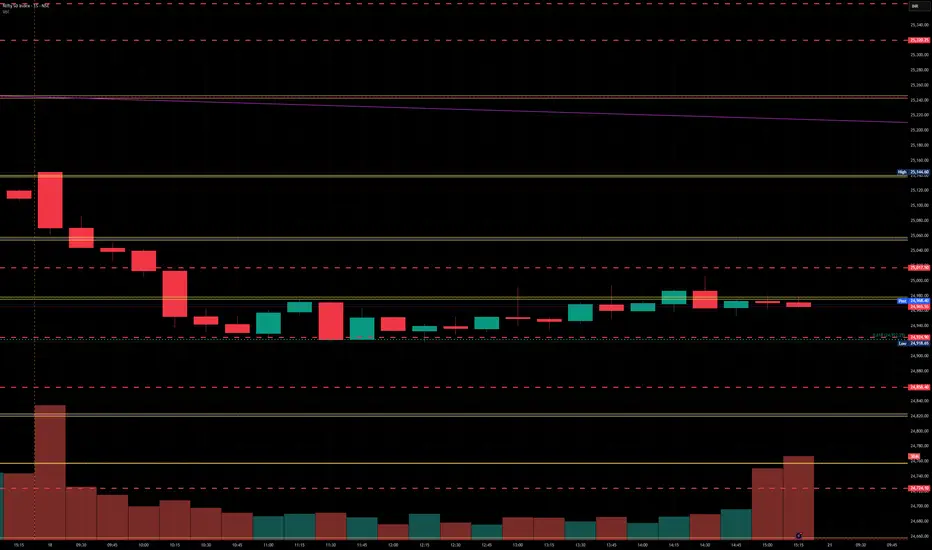
Nifty levels - Jul 21, 2025Nifty support and resistance levels are valuable tools for making informed trading decisions, specifically when combined with the analysis of 5-minute timeframe candlesticks and VWAP. By closely monitoring these levels and observing the price movements within this timeframe, traders can enhance the accuracy of their entry and exit points. It is important to bear in mind that support and resistance levels are not fixed, and they can change over time as market conditions evolve.
The dashed lines on the chart indicate the reaction levels, serving as additional points of significance to consider. Furthermore, take note of the response at the levels of the High, Low, and Close values from the day prior.
We hope you find this information beneficial in your trading endeavors.
* If you found the idea appealing, kindly tap the Boost icon located below the chart. We encourage you to share your thoughts and comments regarding it.
Wishing you success in your trading activities!

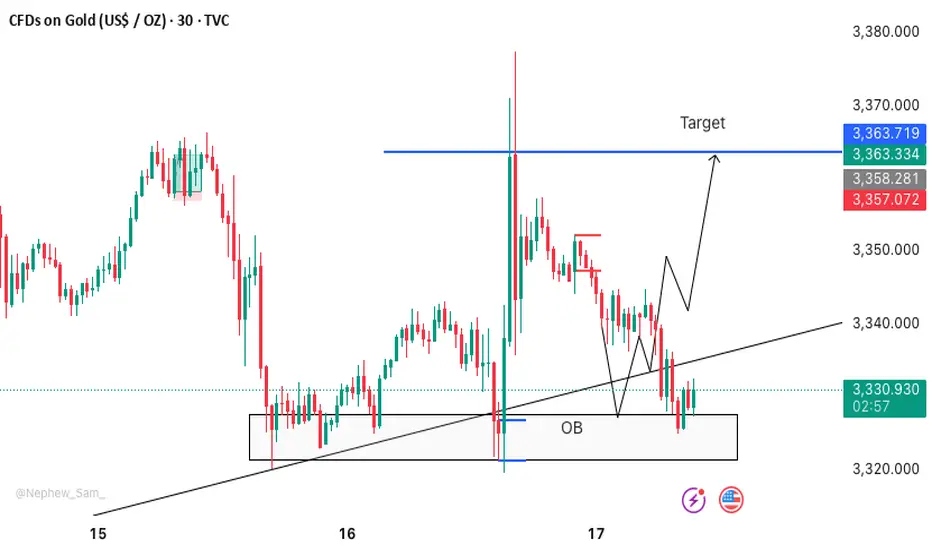
XAUUSD M30 BUY SETUP FOR TODAYScenario:
Best buy zone for Gold as of now: 3327–3323 💰
Strong Order Block zone + Double Bottom pattern 📉📈
Let’s ride the 🚀 from here — follow proper risk management! 🛡️📊
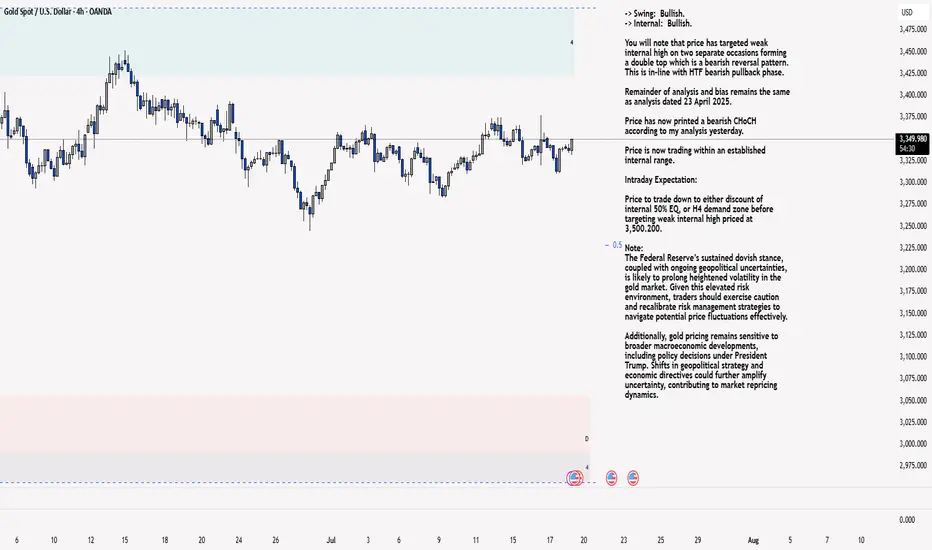
XAU/USD 18 July 2025 Intraday AnalysisH4 Analysis:
-> Swing: Bullish.
-> Internal: Bullish.
You will note that price has targeted weak internal high on two separate occasions forming a double top which is a bearish reversal pattern. This is in-line with HTF bearish pullback phase.
Remainder of analysis and bias remains the same as analysis dated 23 April 2025.
Price has now printed a bearish CHoCH according to my analysis yesterday.
Price is now trading within an established internal range.
Intraday Expectation:
Price to trade down to either discount of internal 50% EQ, or H4 demand zone before targeting weak internal high priced at 3,500.200.
Note:
The Federal Reserve’s sustained dovish stance, coupled with ongoing geopolitical uncertainties, is likely to prolong heightened volatility in the gold market. Given this elevated risk environment, traders should exercise caution and recalibrate risk management strategies to navigate potential price fluctuations effectively.
Additionally, gold pricing remains sensitive to broader macroeconomic developments, including policy decisions under President Trump. Shifts in geopolitical strategy and economic directives could further amplify uncertainty, contributing to market repricing dynamics.
H4 Chart:
M15 Analysis:
-> Swing: Bullish.
-> Internal: Bullish.
H4 Timeframe - Price has failed to target weak internal high, therefore, it would not be unrealistic if price printed a bearish iBOS.
The remainder of my analysis shall remain the same as analysis dated 13 June 2025, apart from target price.
As per my analysis dated 22 May 2025 whereby I mentioned price can be seen to be reacting at discount of 50% EQ on H4 timeframe, therefore, it is a viable alternative that price could potentially print a bullish iBOS on M15 timeframe despite internal structure being bearish.
Price has printed a bullish iBOS followed by a bearish CHoCH, which indicates, but does not confirm, bearish pullback phase initiation. I will however continue to monitor, with respect to depth of pullback.
Intraday Expectation:
Price to continue bearish, react at either M15 supply zone, or discount of 50% internal EQ before targeting weak internal high priced at 3,451.375.
Note:
Gold remains highly volatile amid the Federal Reserve's continued dovish stance, persistent and escalating geopolitical uncertainties. Traders should implement robust risk management strategies and remain vigilant, as price swings may become more pronounced in this elevated volatility environment.
Additionally, President Trump’s recent tariff announcements are expected to further amplify market turbulence, potentially triggering sharp price fluctuations and whipsaws.
M15 Chart:
BankNifty levels - Jul 21, 2025Utilizing the support and resistance levels of BankNifty, along with the 5-minute timeframe candlesticks and VWAP, can enhance the precision of trade entries and exits on or near these levels. It is crucial to recognize that these levels are not static, and they undergo alterations as market dynamics evolve.
The dashed lines on the chart indicate the reaction levels, serving as additional points of significance. Furthermore, take note of the response at the levels of the High, Low, and Close values from the day prior.
We trust that this information proves valuable to you.
* If you found the idea appealing, kindly tap the Boost icon located below the chart. We encourage you to share your thoughts and comments regarding it.
Wishing you successful trading endeavors!

BTCUSD Long📈 Scenario Outlook:
Bias: Bullish
Preferred Play: Long setups are favorable as long as price holds above 116,600 demand.
BTC is expected to push through the intermediate supply zones and potentially attempt a full retracement toward the previous CHOCH high at 123,231.
📌 Key Zones ("Your Borders"):
🟢 Demand Zone (Support)
Zone: 116,600 – 117,600
This is a well-marked reaccumulation zone, aligned with previous demand and the CHOCH origin. Price respected this level multiple times, showing it as a valid base for long entries.
As long as BTC holds above this zone, the bullish thesis remains valid.
🔴 Supply Zones (Resistance Targets)
First Supply: 119,000 – 120,000
Aligned with the 50% retracement level (11964.22) from the previous high to low swing.
Expect short-term reaction here; however, this level may not hold if momentum continues building.
Upper Supply Zone: 121,500 – 123,200
This is the final major resistance before revisiting the previous high at 123,231.
A sweep or rejection from here could form a double top or distribution structure, depending on macro factors and volume.


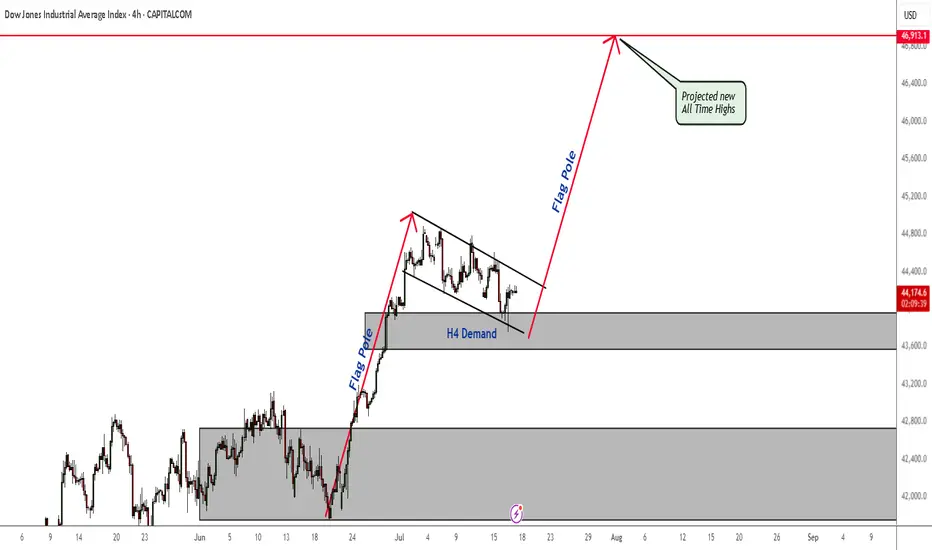
US30 Bullish Flag - All Time Highs The plan for Dow Jones has not changed. Price is still in an H4 demand zone. As soon as price breaks out of this bull flag, nothing will stop the bull run and new All Time Highs being claimed.
Don't miss it.
BONKUSDT: The Meme Coin Ready to Bounce! 📊 Key Stats (Live Update)
- Current Price: $0.000022
- Volume: $1.33M (Accumulation phase)
📈 Critical Levels
- Strong Support: $0.0000192
- Immediate Resistance: $0.000027
- Breakout Target: $0.00004 (+85% upside)
🔥 Why BONK Could Moon
1. Extreme Discount: 92% below ATH ($0.00003275)
2. Meme Coin Rally: WIF +12% today showing sector strength
3. Technical Setup: Bullish divergence forming
🎯 Trading Plan (Updated)
- Ideal Entry: $0.000019-$0.000020 zone 🚀
- Scalp Targets:
→ $0.000025 (+13.2%)
→ $0.000027 (+22.2%)
- Swing Targets:
→ $0.000028 (+40%)
→ $0.000035 (+75%)
- Risk Management:
→ Stop Loss: $0.000018
→ Position Size: 1-3% of portfolio
⚠️ Crucial Notes
1. High volatility expected - set alerts
2. Watch BTC dominance for market direction
3. Smaller exchanges may have price discrepancies
📌 Unique Opportunity
At current levels, BONK offers one of the highest risk/reward ratios in meme coins with:
- 80%+ upside potential to ATH
- Limited downside to strong support
🔍 Live Metrics to Watch
1. 4H RSI: 52 (neutral)
2. Volume Spike: $2M+ needed for breakout
3. Exchange inflows/outflows
---
NOT FINANCE ADVICE | DYOR always 💡 Visual Enhancements
Ready for the BONK resurgence? Would you like me to adjust the entry strategy for more conservative traders? 🐶

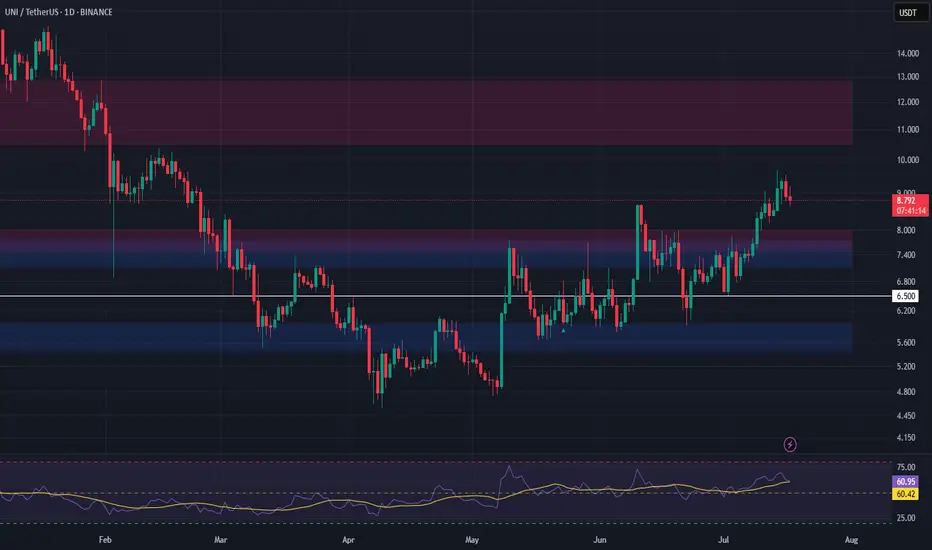
UNI Long Setup – Breakout Retest into High-Confluence SupportUniswap (UNI) has broken out of resistance and is now pulling back into a high-confluence zone, forming a strong bullish structure. The $7.13–$7.73 area presents a favorable entry on the retest.
📌 Trade Setup:
• Entry Zone Around: $7.13 – $7.73
• Take Profit Targets:
o 🥇 $10.50 – $12.85
• Stop Loss: Daily close below $6.50
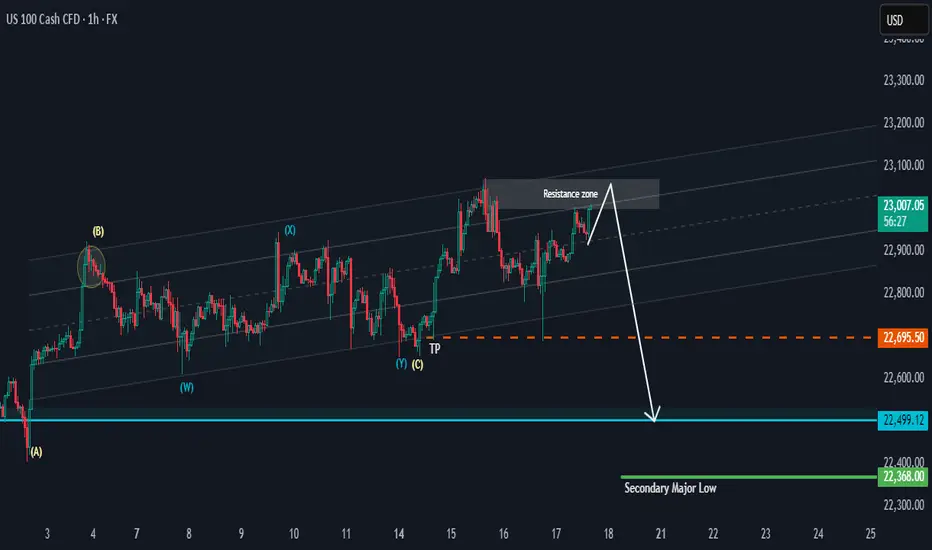
NAS 100 Potential PullbackHi there,
NAS100 has the potential to drop as it keeps testing the resistance zone in the range of 23100. This looks more like bull exhaustion than a reversal. The 22695.50 is the target for a bias of 22499.12
The overall bigger trend is bullish, with price highs aiming as far as 23717.44, 24837.28, and 26222.31, making this a potentially massive bullish trend, and it will take time to reach those highs.
Happy Trading, 🌟
K.

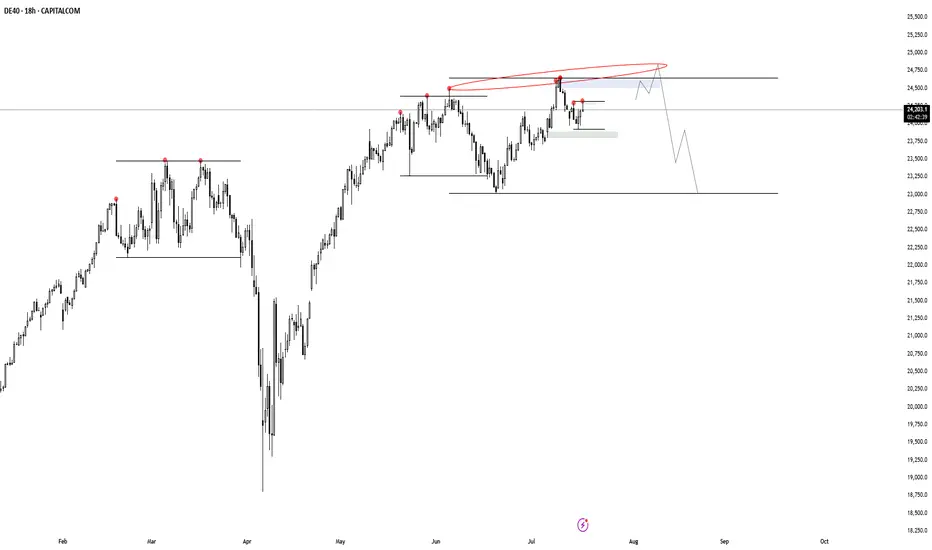
DE40 HTF DistributionI'm watching the DE40 closely here. It's putting in distribution over distribution, which simultaneously leads to the creation of a potential higher time frame distribution model. There are many other indices with a similar behaviour, but this one looks the cleanest so far. I'm waiting for invalidations/confirmations at the POI's.
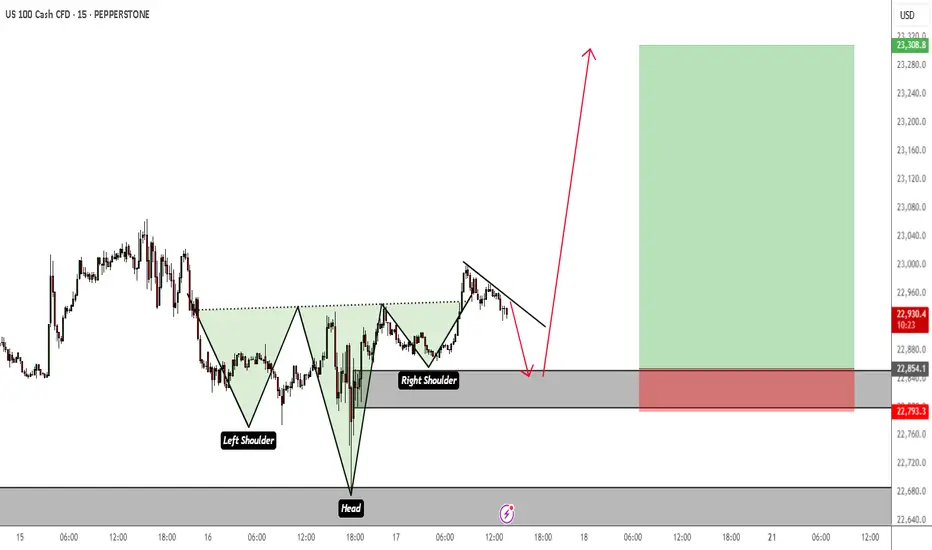
NASDAQ Inverted Head & Shoulders Retest Before Bullish MomentumI see a possible retest of an Inverted Head and Shoulders on M15 TF before the bullish momentum resumes. The SL and TP are just a rough estimation. Price could dip a bit lower than that.
But my overall bias is bullish.