Head & Shoulders Pattern Spotted in PayPal Holdings IncHead & Shoulders Pattern Spotted in PayPal Holdings Inc.
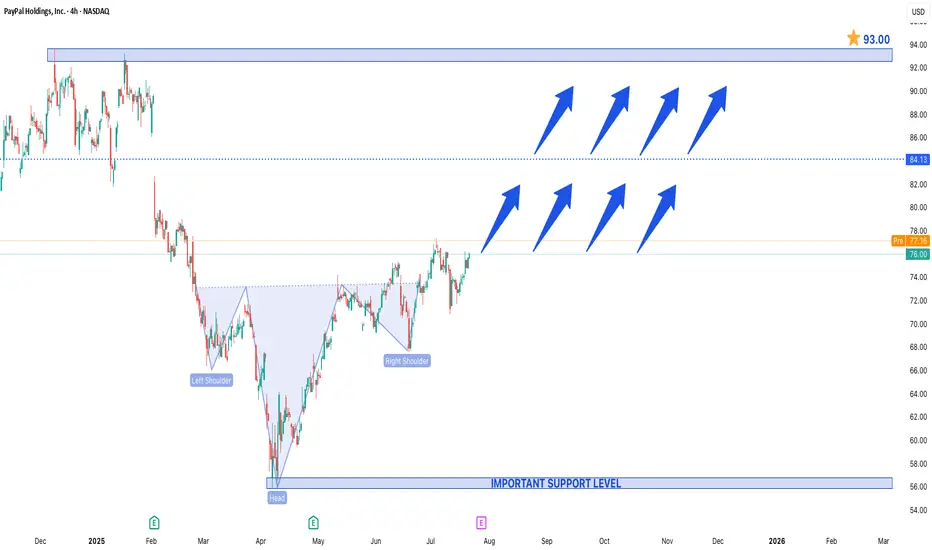
A Head & Shoulders (H&S) pattern has been identified in PayPal Holdings Inc. (PYPL), but unlike the traditional bearish reversal setup, this could be an inverse Head & Shoulders, signaling a potential bullish turnaround.
Key Observations:
1. Left Shoulder – A decline followed by a rebound.
2. Head – A deeper low, then a recovery.
3. Right Shoulder – A higher low, suggesting weakening selling pressure.
4. Neckline Break – A decisive close above the resistance (neckline) confirms the bullish reversal.
Price Projections:
- Support at $55 – This level has held strong, acting as a critical demand zone. A bounce from here could fuel the next rally.
- Upside Target at $93 – A successful breakout above the neckline could propel PYPL toward $93, representing a ~40% upside from current levels.
Why This Matters for Traders:
- Bullish Momentum – The pattern suggests that sellers are exhausted, and buyers are stepping in.
- Volume Confirmation – Increasing volume on the breakout would strengthen the bullish case.
- Market Sentiment Shift – If PayPal sustains above key resistance, it could attract institutional interest.
Trading Strategy:
- Stop Loss – Below $55 for risk management.
- Target – $93, with interim resistance near $75 and $85.
Final Thoughts:
While technical patterns are not foolproof, the inverse H&S in PYPL suggests a potential trend reversal. If the breakout holds, $93 could be the next major target, making PayPal an interesting watch for swing traders and investors.
Supply and Demand
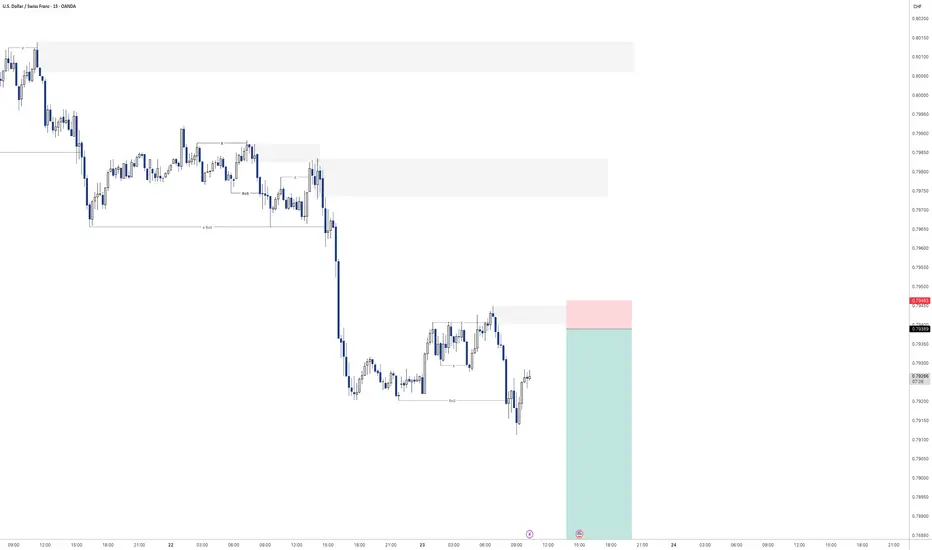
USDCHF - Sell off continuation?Looking for continuation of the selling pressure here on USDCHF
Will see how we play out for the rest of the day

GU 23/07Yesterday our OF changed on the M15 aligning with the H4 trend, I have established H4 as bullish, at the moment in the M15 we have swept a low and broken supply so I want to monitor price as it comes back into my M15 demand in order to look for longs where we start to see LTF OF align with the M15 and H4 trend

GOLD SHORT REVERSALThe GOLD is on a short-term reversal, but it is expected to resume a new uptrend.
CHFJPY Looks Toppy… Is a 500 Pip Crash Coming?CHFJPY Has Exploded Past 180 — But Is the Top Already In?
After blowing clean through the key 180 resistance level, CHFJPY has continued surging into July — a month historically known for thin liquidity as traders hit holiday mode. These low-volume environments often lead to exaggerated price moves, much like we see in late December.
From a structural standpoint, this pair looks seriously overextended and ripe for a sharp pullback — with potential downside targets around 180 and 178 over the coming weeks.
If I were a bull, I’d want to see a clear break and weekly/monthly close above 186 before considering further upside.
As it stands, I’m gradually building into a short position, eyeing that 180 handle as my first key level.
Let me know your thoughts in the comments — agree, disagree, or seeing something I’m not?
*This is my personal analysis shared for educational purposes only. Always do your own research — never blindly follow anyone’s trades.*

USDCHF – Two Levels, One PlanWe’re watching two key resistance zones for a potential short.
If the first level holds and gives a signal, we’ll short from there.
If that level breaks, we may switch to a short-term buy up to the next level.
Once price reaches the second resistance, we’ll be ready for another sell opportunity.
No predictions — just following the flow.

Apple (AAPL) — Expected 20% GrowthThe fundamental outlook for Apple stock remains positive: the upcoming fall presentation and anticipated AI-related announcements are driving bullish sentiment.
Technical picture:
The price has broken through a key trendline, signaling a shift in momentum toward growth.
Near-term target: a move toward the 225.0 level.
Next step: a possible pullback to 214.0 for a retest of the support level.
Long-term scenario: after the correction, I expect a rise toward 250.0, which could bring approximately 20% growth within 1–2 months.
This growth potential may coincide with Apple’s upcoming earnings report and further AI news.

XAUUSD: Fluctuation of $30/ounce. Do you want to know?Yesterday, I frantically notified followers to buy around 3366-3375, and the market finally rose to 3430. This is a huge profit. I will continue to update it in the Band Trading Center Research Institute later. If you don’t want to miss it, follow me. If you see it but are still not sure how to trade. Then you can leave me a message at the Swing Trading Center Research Institute. I will reply to you one by one when I see it.
This week, some followers have achieved weekly profits of 50%-268%. If your profit is not ideal. Or don’t know how to trade. Remember to like and follow. I will lead everyone to victory.
Buy around 3400-3410. When will it close? I will post the results on the Swing Trading Center. Stay tuned.

NZDUSD BUY 0.5990On the 4-hour chart, NZDUSD formed a bullish bat pattern and then stabilized and rebounded, and short-term bulls have the upper hand. Currently, you can pay attention to the support near 0.5990. If it stabilizes, you can consider going long. The upper resistance is 0.6080-0.6120 area.

Bonk USDT Buy / Long SetupBonk performing well among all meme sectors, wait for the entry and take risk, if tp hits first then ignore. I already shared this setup on my group, we closed the trade at minor profit, but now this is showing strong momentum on 1hr tf also, that's why sharing.

APTUSDT Aptos Scalp buy / Long Setupaptos trying to breakout, wait till London session, if tp hits first then ignore, will share setup, must use sl as it's a scalp trade.

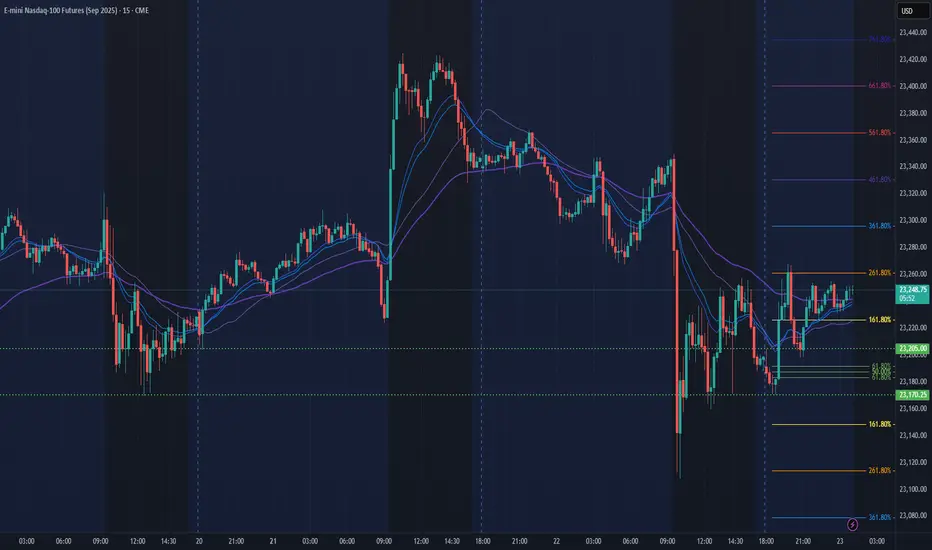
NQ Power Range Report with FIB Ext - 7/23/2025 SessionCME_MINI:NQU2025
- PR High: 23205.00
- PR Low: 23170.25
- NZ Spread: 77.75
Key scheduled economic events:
10:00 | Existing Home Sales
10:30 | Crude Oil Inventories
Session Open Stats (As of 12:25 AM 7/23)
- Session Open ATR: 261.82
- Volume: 34K
- Open Int: 270K
- Trend Grade: Neutral
- From BA ATH: -0.7% (Rounded)
Key Levels (Rounded - Think of these as ranges)
- Long: 23811
- Mid: 22096
- Short: 20383
Keep in mind this is not speculation or a prediction. Only a report of the Power Range with Fib extensions for target hunting. Do your DD! You determine your risk tolerance. You are fully capable of making your own decisions.
BA: Back Adjusted
BuZ/BeZ: Bull Zone / Bear Zone
NZ: Neutral Zone
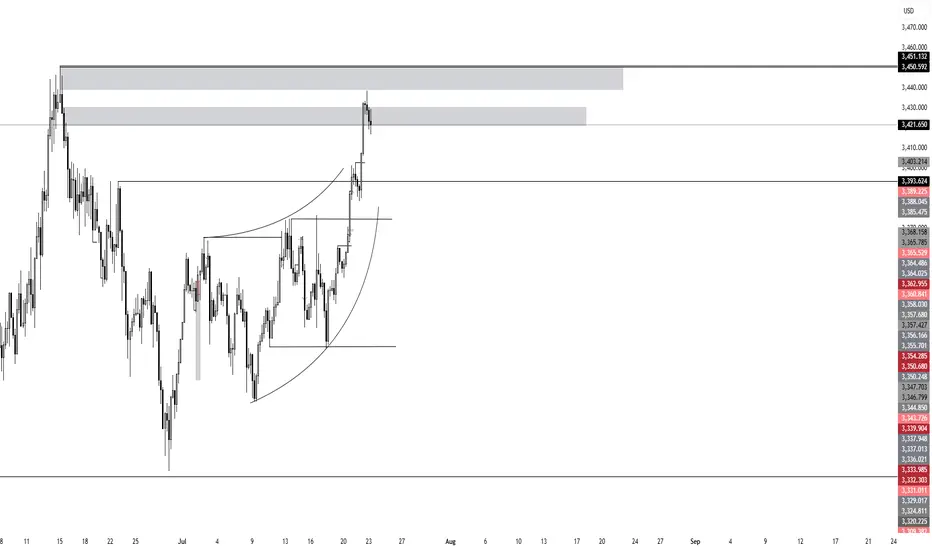
XAUUSD:3450-3500The probability of the same direction of the two histories is 95% similar. This shows one thing. The market may repeat history again.
So buy with me. The next target is 3450-3500

xauusd:3450-3500?Combined with the trend of the US dollar index, the probability of continuing to fall in the short term is high. Today, the manufacturing industry is significantly bullish for gold prices, which is expected. Powell's speech in an hour will be the key factor in today's New York market.
The pressure of interest rate cuts is imminent. Will Powell continue to insist on not cutting despite all objections? This is what we need to pay attention to. Make two plans. First, continue not to cut interest rates, the US dollar will be supported, and gold will retreat. If there is a retracement of 3400-3410 points, it needs to be paid attention to. Second, it is not discussed. Or interest rate cuts are beneficial to gold prices. This is the driving force for gold prices to hit 3500-3450.
To be honest, the conclusion of the Band Trading Center Research Institute tends to the latter. So if you buy, you need to set TP/SL strictly.

Ton USDT Buy Setup / Long SetupTon entry at current market price 3.305 , SL if 1 day closes below the mentioned zone. Otherwise holding ton for breakout towards 4-4.5$. use low risk amount as BTC can retrace.

TEM - what do you see ?I love this stock, so much momentum and good follow through.
I see it's ready for a strong rally. I've huge position via shares and Aug calls

AUDUSD Long - A BreakdownAfter a thorough breakdown, I decided to enter longs on AUD/USD. I expect for price to reach highs of around .65898 Which is the daily structure high Currently in profit On a long position and We entered on the 5 minute using a one hour stop loss Hopefully this trade continues to play out, and we'll see you on the other side of profit.

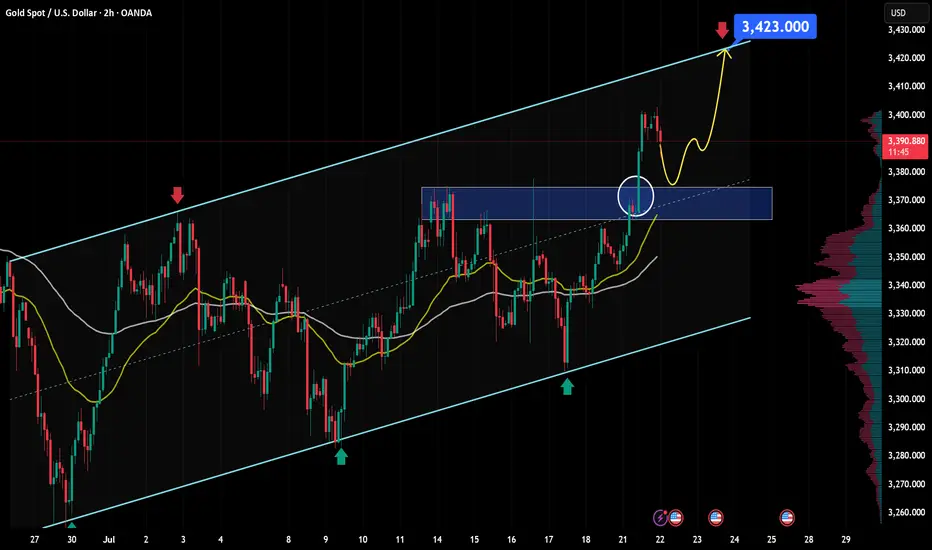
XAU/USD outlook: Bullish momentum building after breakoutGold saw a powerful rally yesterday, surging from $3,350 to nearly $3,400 — an impressive $50 move, equivalent to 500 pips.
From a macroeconomic perspective, this recent uptrend in gold is driven by a combination of supportive factors. First, the U.S. dollar has shown clear signs of weakness following dovish signals from several Federal Reserve officials, who hinted at potential rate cuts if the U.S. economy begins to slow. In addition, geopolitical risks such as renewed U.S.–China trade tensions, instability in the Middle East, and slowing growth in China are all pushing investors toward safe-haven assets like gold. Another key driver is the ongoing accumulation of gold by central banks worldwide — particularly China and Turkey — highlighting gold’s growing appeal as a strategic reserve asset. Together, these factors have built a strong foundation for gold’s upward momentum, explaining why prices remain above yesterday’s opening level, despite the current short-term pullback.
From a technical and short-term outlook, gold (XAU/USD) continues to show a bullish setup supported by both price structure and market sentiment. On the H2 timeframe, gold remains in a clear uptrend, with a series of higher highs and higher lows. After breaking through a strong resistance zone around $3,374 (aligned with the 0.5 Fibonacci level), price surged to a peak of $3,403 before entering a healthy retracement phase.
Currently, the $3,367–$3,374 zone is acting as newly-formed support — a key confluence area that aligns with:
A former resistance now flipped into support,
The 0.5–0.618 Fibonacci retracement cluster,
And a bullishly aligned short-term EMA structure.
In the short term, as long as this support zone holds, the bullish outlook remains valid. A successful retest of this area could reignite buying pressure, with the next target set around $3,423 — in line with the projected extension of the previous bullish leg.
However, if buyers fail to defend this zone, the bullish setup could be invalidated or lose momentum. This area warrants close monitoring of price action and volume behavior to confirm the next directional move.

MAJOR MONTHLY SUPPLY ZONE ON GBP/JPY SELLERS INBOUNDRegarding the monthly supply zone, my technical analysis indicates that the price has historically failed to breach this area over several years. I anticipate a potential reversal and recommend waiting for confirmation, such as a double top or harmonic pattern, before initiating a sell position. Furthermore, i will consider selling opportunities upon the .618 Fibonacci level being reached.
Entry: 199.0
Take Profit: 183.3
Overall Price Target: 163.0

#6472025 | XAGUSD Selling opportunity 1:4XAGUSD Selling opportunity Appears in H4 Time Frame Looking Price Action for Long Term Sell
Risk and Reward Ratio is 1:4
After 50 pips Profit Set SL Entry Level
"DISCLAIMER" Trading & investing business is "Very Profitable" as well as risky, so any trading or investment decision should be made after Consultation with Certified & Regulated Investment Advisors, by Carefully Considering your Financial Situation.

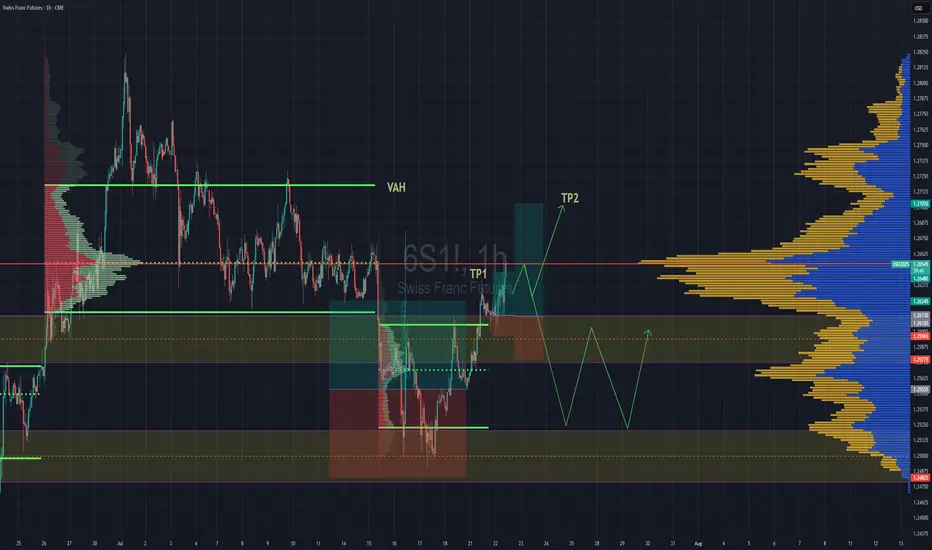
Swiss Gaining Momentum Against The DollarSwiss futures gaining strength against the dollar. We have broken back into previous rotation that was somewhat balanced, but still leaning towards a "b" style volume profile . If we are able to get above the POC, then we''ll go straight for TP2 close to Value are high.
If the POC is really strong and we reject hard from the POC then we might lose the value area and fall back down to previous value area to continue consolidation there until further notice.