GBPAUD 15/3 Pullback LongThere could be a double tops forming in progress. It could drop down to the two demand zones and get liquidity and fly up.
Also could be triple tops and pullback and fly.
Ultimate goal is long and reaching supply 2.09620 area
Supply and Demand

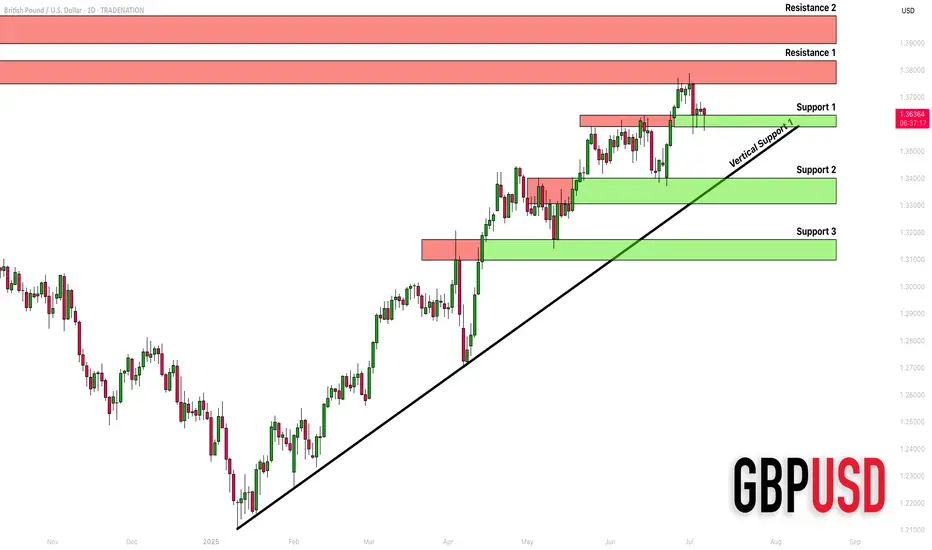
GBPUSD: Detailed Support & Resistance Analysis 🇬🇧🇺🇸
Here is my structure analysis for GBPUSD.
Horizontal Structures
Support 1: 1.3588 - 1.3633 area
Support 2: 1.3305 - 1.3400 area
Support 3: 1.3097 - 1.3175 area
Resistance 1: 1.3748 - 1.3835 area
Resistance 2: 1.3900 - 1.3400 area
Vertical Structures
Vertical Support 1: rising trend line
Consider these structures for pullback/breakout trading.
❤️Please, support my work with like, thank you!❤️
I am part of Trade Nation's Influencer program and receive a monthly fee for using their TradingView charts in my analysis.
#EURNZD:Price accumulated now time for distribution! Price completed accumulated and now we expecting a strong bullish price distribution. Next week we can see price going and crossing our target with strong bullish volume kicking in the market. Price may go beyond 2.20 region; let's see how it goes.
Good luck and trade safe!
Team Setupsfx_


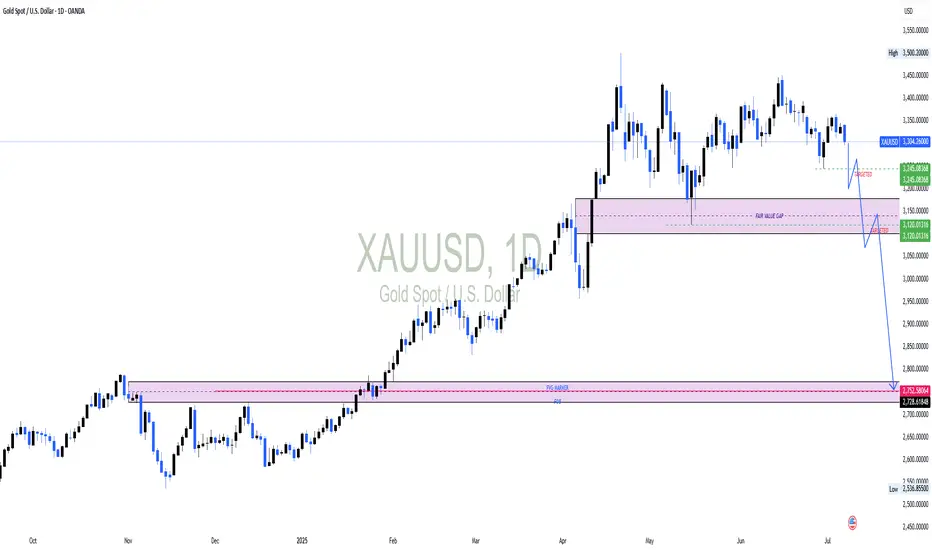
Could Gold slide below 3000?Could Gold slide below 3000?
On the monthly charts, price action shows an imbalance when Gold surged to 3500. Equilibrium must be restored and price action suggests, Gold has to correct by mitigating demand at 2700 price levels. On the weekly and daily charts, there are signs of price weakening suggesting a reversal is not so far. On the daily chart, Gold has mitigated a short term FVG and formed an intermediate low. Once this low is broken, it will confirm our reversal of Gold targeting the monthly FVG at 2760
DOGEUSDT Buy Long SetupWait for entry, if the tp hits first, then ignore the trade, I will share new entry.

Doge Buy / Long SetupDoge has some Bullish Momentum, Invalidation if 4hrs closes below the mentioned point, then close on entry, otherwise wick doesn't matter. If tp achieved first then Cancel the trade.

GBPAUD 15/3 Pullback LongOverall trend is long. Expecting a pull back to the demand zone and lift off. Waiting time...

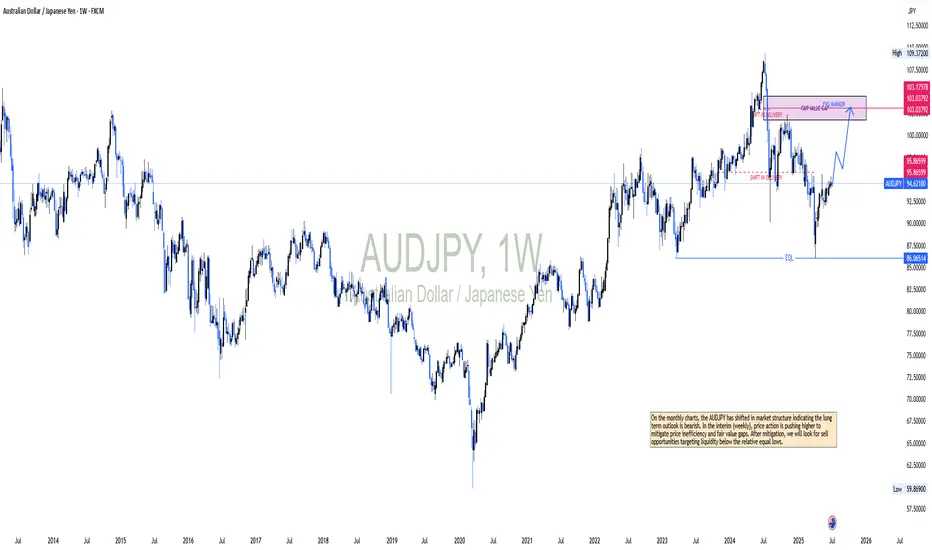
AUDJPY OUTLOOKOn the monthly charts, the AUDJPY has shifted in market structure indicating the long term outlook is bearish. In the interim (weekly), price action is pushing higher to mitigate price inefficiency and fair value gaps. After mitigation, we will look for sell opportunities targeting liquidity below the relative equal lows.
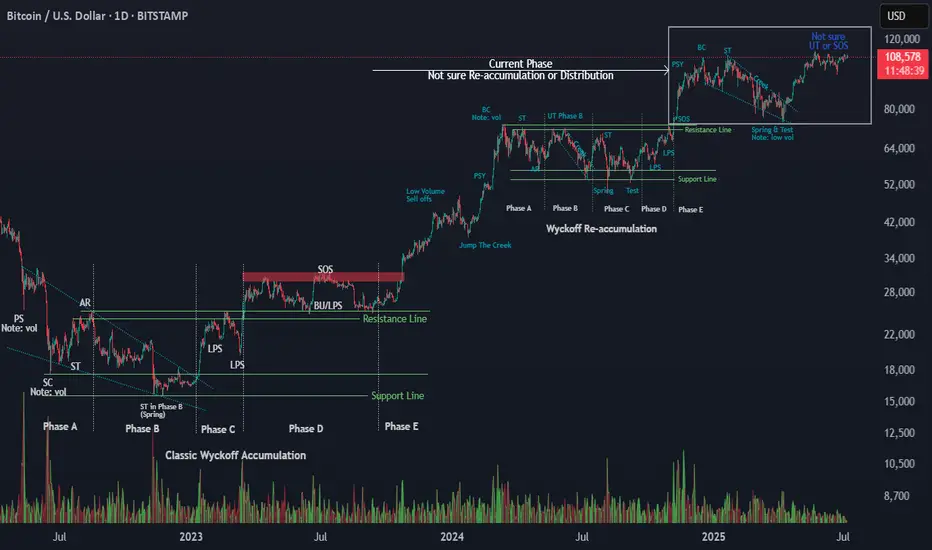
Wyckoff Logic – Test PhaseI won’t say much — the chart speaks for itself.
Based on my ongoing study of Wyckoff methodology, it appears that Bitcoin is currently in the Test phase within a re-accumulation structure. This suggests the Mark-Up phase is not yet complete, and we may still have room for price expansion before the next major distribution.
This is not a prediction, but a reference for structural context using classical Wyckoff logic.
As always, price confirmation and volume behavior will be the key to validate the next move.
Observations:
Strong support zone holding after Spring/Test
Price respecting higher lows
Volume profile supports continuation
Feel free to share your perspective below 👇
#Wyckoff #Bitcoin #BTC #Reaccumulation #MarketStructure #PriceAction #TradingView #CryptoTA
Apple Stock in 10 years perspective: Stability or New Heights?The future of Apple stock remains a hot topic among investors and analysts. For today’s July, the company’s market capitalization has climbed to $3 trillion, up from $2.9 trillion (a year ago, on May 2024). But can this tech giant continue to deliver significant returns for shareholders over the next decade? Let’s take a quick look on it.
AI’s Take on the Future
Recently, ChatGPT highlighted Apple NASDAQ:AAPL as a top contender among stocks poised to generate substantial wealth by 2035, outranking peers like Microsoft NASDAQ:MSFT , Amazon NASDAQ:AMZN , and Nvidia NASDAQ:NVDA . The prediction has sparked curiosity, but what do real-world experts think?
Analyst Perspectives: Strengths and Challenges
Opinions on Apple’s outlook vary. On one hand, the company boasts a robust financial foundation, steady revenue from subscriptions, and substantial cash reserves. On the other hand, some analysts argue that its current share price is overstretched. Apple’s forward P/E ratio—based on projected earnings for the next 12 months—stands at 27, compared to the S&P 500’s near 22, suggesting investors are paying a premium for future growth.
Additionally, Apple faces mounting competition and regulatory pressures. The key question is whether it can maintain its edge in a fast-evolving tech industry.
Services and Devices
In recent years, Apple has leaned heavily into services like subscriptions and digital platforms, delivering high-margin and recurring revenue. Yet, its core business still hinges on device sales, particularly the well-known iPhone. Without groundbreaking new products, the company risks getting stuck in a cycle of incremental updates, potentially slowing its growth trajectory.
Financial Resilience
Despite these challenges, Apple’s financial metrics remain impressive. Its market cap has risen to $3 trillion, and it continues to generate significant free cash flow. The company also offers modest dividends, making it attractive for those people, who prefer and seek stable returns.
What to Expect from Apple by 2035?
Apple stands as one of the most dependable long-term investments, but we shouldn’t expect the explosive growth, just like it was at their early years. Of course iconic brand, loyal customer base, and adaptability— is a strong side and support its stability. But the high share price, competitive pressures, and reliance on certain hardware components may limit and slow down its upside.
Can Apple make you wealthy by 2035? It depends on your goals, risk tolerance and the size of your investment. For those seeking stability and modest gains, Apple is a solid pick. But if you’re chasing rapid wealth, you might need to look elsewhere for higher-risk opportunities.

gold for long *The content on this analysis is subject to change at any time without notice, and is provided for the sole purpose of assisting traders to make independent investment decisions.

A fall is on the horizon — watch out!OANDA:NZDUSD
Channel breakout confirmed, with sellers showing interest.
The price is now ideal for shorts — I’m jumping in.

It wants to fall on its own!OANDA:AUDUSD
The price’s failure to break out of the channel with strong candles, along with a double top, signals that sellers are stepping in.
It’s time to enter — let’s go! 💥

LONG ON GBP/CHFGBP/CHF has tapped into a major demand zone and has lots of buy side liquidity to the upside near the supply zone to collect.
I will be buying GBP/CHF to the supply zone looking to catch 400-600 pips.

BankNifty levels - Jul 08, 2025Utilizing the support and resistance levels of BankNifty, along with the 5-minute timeframe candlesticks and VWAP, can enhance the precision of trade entries and exits on or near these levels. It is crucial to recognize that these levels are not static, and they undergo alterations as market dynamics evolve.
The dashed lines on the chart indicate the reaction levels, serving as additional points of significance. Furthermore, take note of the response at the levels of the High, Low, and Close values from the day prior.
We trust that this information proves valuable to you.
* If you found the idea appealing, kindly tap the Boost icon located below the chart. We encourage you to share your thoughts and comments regarding it.
Wishing you successful trading endeavors!

Nifty levels - Jul 08. 2025Nifty support and resistance levels are valuable tools for making informed trading decisions, specifically when combined with the analysis of 5-minute timeframe candlesticks and VWAP. By closely monitoring these levels and observing the price movements within this timeframe, traders can enhance the accuracy of their entry and exit points. It is important to bear in mind that support and resistance levels are not fixed, and they can change over time as market conditions evolve.
The dashed lines on the chart indicate the reaction levels, serving as additional points of significance to consider. Furthermore, take note of the response at the levels of the High, Low, and Close values from the day prior.
We hope you find this information beneficial in your trading endeavors.
* If you found the idea appealing, kindly tap the Boost icon located below the chart. We encourage you to share your thoughts and comments regarding it.
Wishing you success in your trading activities!

BNB Stuck in Barrier Triangle?CRYPTOCAP:BNB appears to be in a macro wave 4 barrier triangle, and for some time.
It has held up particularly well during the alt coin massacre, not even reaching the .382 Fibonacci retracement.
Price is testing the upper boundary for the 4th time, that starts to give us the higher probability breakout which increases with each test. The daily 200EMA and pivot were tested as support successfully.
Safe trading.

$FET Ready for the next move up?NYSE:FET looks ready for the next move up with a similar analysis to many other alts I have shared.
It is breaking out of descending resistance after testing the .618 Fibonacci retracement and High Volume Node (HVN) as support. Price broke above the daily pivot and is now swinging below, a recovery above the local swing high will be a bullish signal to go long with a wave 3 target of the R3 daily pivot and major resistance HVN at $1.13.
Analysis is invalidated below $0.54
Safe trading

GOOGLE Count changed, Bullish outlook.I have adjusted NASDAQ:GOOG NASDAQ:GOOGL Elliot wave count with a wave 1 completing a leading diagonal backed up by a deep wave 2 correction into High Volume Node support (HVN). We potentially have another 1-2 with fast drop and recovery to the S1 daily pivot which would make long term outlook extra bullish by extending target.
Wave 3 is underway with a target of the all time hime high HVN for wave 5. The next resistance HVN is $191.
Price above the daily pivot and is continuing upwards after testing as support.
Analysis is invalidated below $162 swing low.
Safe trading
