ENA Long / Buy Swing SetupENA Looking Good here, daily closing above 1st tp guaranteed tp 2. Ena can be the next SUI, Ondo. Below 0.31$ buying is a good choice and hold till 1st and then 2nd tp. While for the long term investors it has the potential to hit 2-3$ mark.
Supply and Demand

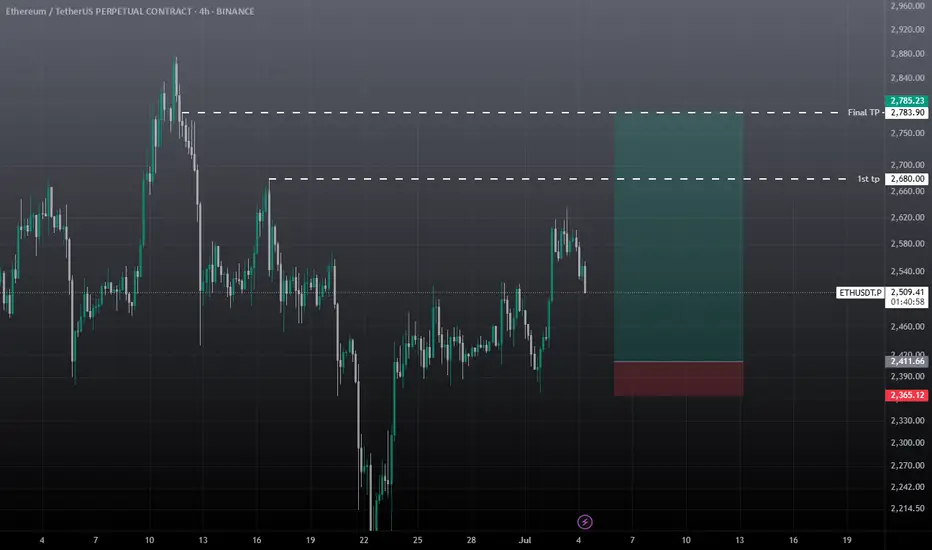
ETHUSDT Swing Trade AnalysisEth still struggling to break weekly bearish fvg, rather it's bullish or bearish, it must revisit the orange line which is daily bearish fvg, if it taps this and drops then a good sign , if it doesn't tap this and drops then it's a bad sign for eth, 3rd scenario is if we get any 4hr closing above the green line then I will not take the short and close short on the entry price, then I will short from the 3k area till 2.8k for scalp, if eth rejects from orange line 2583 then I will hold the trade till tp2. short only from the mention zone, if it doesn't tap the bearish fvg i will share another short trade with extended tps. remember that that yellow zone is important eth must retest it or break it to be bullish, without tapping this and drops then it's not a good sign for eth.

BTC Analysisfor here no trade zone, short from mentioned zone and keep the sl tight, I would prefer long from the 100k zone, if we get daily closing below the mentioned zone then will long from 92-90k area, target still remains the same 112k-120k

moodeng buy setup scalp & swingIf btc stays sideways till fri-sat it can hit swing tp, also during eid days I won't recommend you to take any trade due to dry volume, less volatility. It's a meme token so use tight sl and don't use high margin on this trade. Good Luck.


BTC short setup As previous weekly went good on BTC, a nice bounce from the area on swing setup. Now wait for the liquidity grab from 107.8k then take short, that whiteline is important to break and sustain for btc to continue it's Bullish trend. Longer sl is just to avoid wick damage closing matter here. Good luck, book at least 50% on 105.2k rest hold the position, and take long from mentioned zone.

Truusdt truefi buy setupA clean setup, valid until final tp is not hit. Wick doesn't matter if any news day, closing matters.

inj buy long setup, scalp intraday setupTake it tension free sl is very tigh, wick below the sl doesn't matter candle closed then setup is invalid. If tp hits without filling entry then setup is not valid

ENAUSDT Long / Buy SetupOn lower tf ena showing bullish momentum, while previous setups went bad due to war, but ena still holding the previous marked area, this is a short term setup not long term, still expecting another low for whole market. Will share swing setups if found strong momentum. Must use SL as btc as it's peak.

Ondo Scalp trade take with sl , this is a 5m scalp trade, So take it at your own risk with small amount

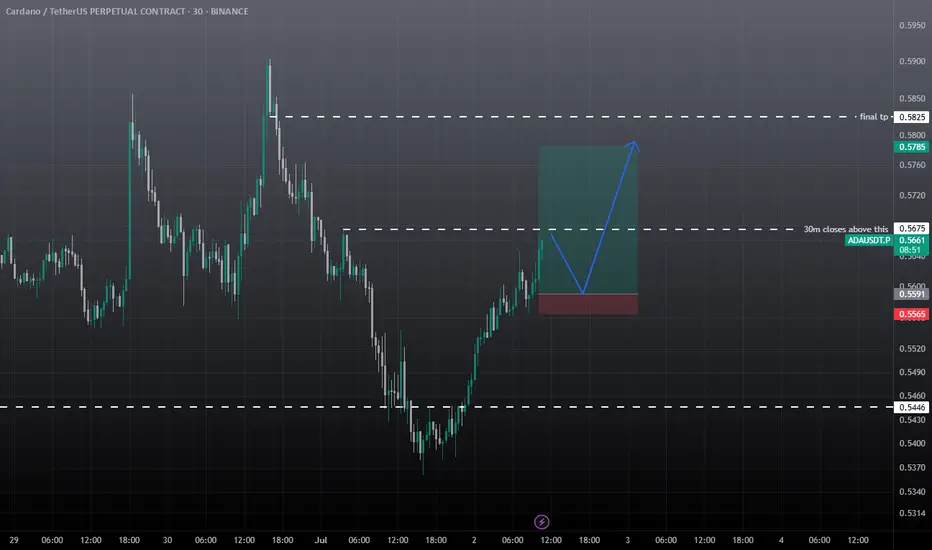
ADAUSDT Intraday SetupAda Showing some good movement. Trade Rules
must gave 30m candle closing above marked area, if wick above marked area then trade will become risky. Must use the sl. Target is given.
If retraces back before the marked area then it also good, in this case 30m marked area will first tp book 30% here, rest hold till final tp or SL.
ada usdt scalp tradeshort term pullback expected from ada, cardano so take it with small amount, trade entry based on 5m, so don't expect bigger targets. must use sl.

ENA SCALP & Intraday Setup Both Long & Short SetupWait for the entries to be filled first. If short entry achieved first then go for the short, if long entry achieved first then go for the long, in both cases must use SL, cause it's consolidating in a range, any side impulse move is expected from ena.

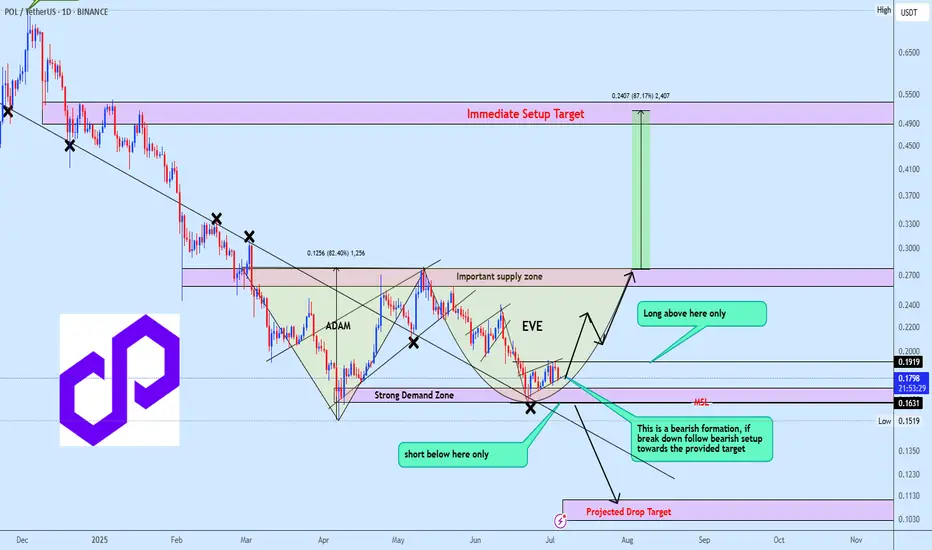
POLUSDT reversal time or bearish ContinuationPOLUSDT is currently shaping a potential Adam and Eve formation, with price consolidating inside a mini bearish flag. A breakdown from the flag would invalidate the bullish setup and likely trigger a continuation toward the projected downside target.
However, if the strong demand zone holds, we could see a bullish reversal unfold, confirming the Adam and Eve structure and opening the path toward the upside projection highlighted on the chart.
At this stage, the focus is on confirmation, not speculation. Waiting for price to validate direction will be key to positioning correctly in this setup.
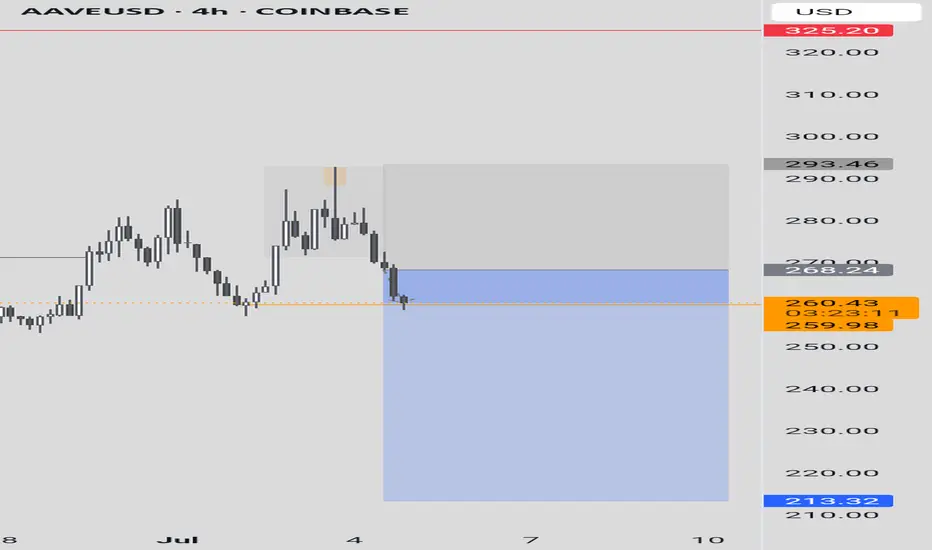
ETH BEARISH AT RESISTANCE ETH rejecting daily resistance, likely price will look to find supports at zones marked below
DYOR

strong RSI, strong VOLUME, strong PRICE ACTIONthe banknifty is nbear life high. this stock is eyeing a multimonth, breAKOUT .
RSI: ABOVE 70 strong
volume: huge spike
price action: strong uptrend
the above could lead to strong follow up

US100 MARKET OUTLOOK - H1Price is strongly bullish in monthly, weekly and daily but we’re currently seeing a retrace in H1 timeframe. we’re going to see price tap into our H1 point of interest .

SASOL: Potential Recovery After Breaking 2002 Low ZoneSASOL has broken below its 2002 low zone and returned back into it. The unconventional price action and recent bullish momentum suggest possible recovery movements. Keep watch on price behavior around this historical support level.

GBPUSD MARKET OUTLOOK!GBPUSD Price just dropped lower following the recent release in US NFP report. Therefore I anticipate a bullish price action to develop away from 1.3500 and 1.3400 level
We’re still looking forward to seeking more bullish price action developments

AAVEUSDT Cryptocurrency Futures Market Disclaimer 🚨🚨🚨
Trading cryptocurrency futures involves high risks and is not suitable for all investors.
Cryptocurrency prices are highly volatile, which can lead to significant gains or losses in a short period.
Before engaging in crypto futures trading, consider your risk tolerance, experience, and financial situation.
Risk of Loss: You may lose more than your initial capital due to the leveraged nature of futures. You are fully responsible for any losses incurred.
Market Volatility: Crypto prices can fluctuate significantly due to factors such as market sentiment, regulations, or unforeseen events.
Leverage Risk: The use of leverage can amplify profits but also increases the risk of total loss.
Regulatory Uncertainty: Regulations related to cryptocurrencies vary by jurisdiction and may change, affecting the value or legality of trading.
Technical Risks: Platform disruptions, hacking, or technical issues may result in losses.
This information is not financial, investment, or trading advice. Consult a professional financial advisor before making decisions. We are not liable for any losses or damages arising from cryptocurrency futures trading.
Note: Ensure compliance with local regulations regarding cryptocurrency trading in your region.
thanks for like and follow @ydnldn to have more information outlook and free signal.
About me :
"I am a passionate swing trader focused on analyzing financial markets to capture profit opportunities from medium-term price movements. With a disciplined approach and in-depth technical analysis, I concentrate on identifying trends, support-resistance levels, and price patterns to make informed trading decisions. I prioritize strict risk management to protect capital while maximizing profit potential. Always learning and adapting to market dynamics, I enjoy the process of refining strategies to achieve consistency in trading."
USDCAD 15/3 Pullback LongOverall up trend. When the pull back reach congestion, will take off. Still need to monitor the CAD news later.

BTC Trade SetupBTC will not take any major correction until it sweeps upside liquidation and close with big red candle, So take the long only on BTC. Wick possible below the SL. I will hold the trade without sl if it comes to entry, if tp achieved first then ignore the trade. Also July breakout possible for BTC, July always positive for BTC, let's see.

ETH SWING TRADEETH Showing strong momentum against BTC, July is also good for eth and some alts, maybe we see correction in Aug, September but before expected pullback towards 2.9k-3k. Must use SL as market is very Volatile these days.