LULU LongMarket Structure Analysis
Break of Structure (BOS): A clean BOS was confirmed following a strong bullish impulse off the low at $219. This suggests a transition from a bearish trend into potential accumulation.
Higher Lows and Re-accumulation: After the BOS, price is forming a clear series of higher lows, indicating sustained demand and institutional interest. Each retracement is being absorbed, suggesting buyers are active.
Short-Term Bullish Target: The current structure points toward a bullish continuation toward the $260–262 zone, where previous structural inefficiencies and distribution events occurred.
Internal Pullbacks: Shallow pullbacks are developing within clean structural ranges, showing signs of controlled re-entries rather than panic-driven profit-taking.
🔹 Liquidity Landscape
Sell-side Liquidity Cleared: The deep wick near $219 represents a liquidity sweep, likely engineered to remove weak longs and activate institutional buy programs.
Buy-side Liquidity Above: There’s a dense cluster of untapped liquidity between $258–262, likely to be targeted before any major shift occurs. These levels also align with where many participants were previously trapped.
Trap Zones Below: The green areas highlight zones where retail might look for reversals. Smart money often uses these zones for re-accumulation or inducement.
🔹 Risk Management Considerations
Entry: Long positions are best taken on confirmation within higher low pullbacks. Avoid chasing price into premium zones.
Stop Placement: Beneath the most recent higher low or liquidity sweep to avoid being taken out by engineered wicks.
Targeting: Conservative traders may target $258; aggressive bias can push toward $262 zone.
Position Sizing: Maintain strict risk control as price approaches higher timeframe zones where momentum may shift.
Supply and Demand

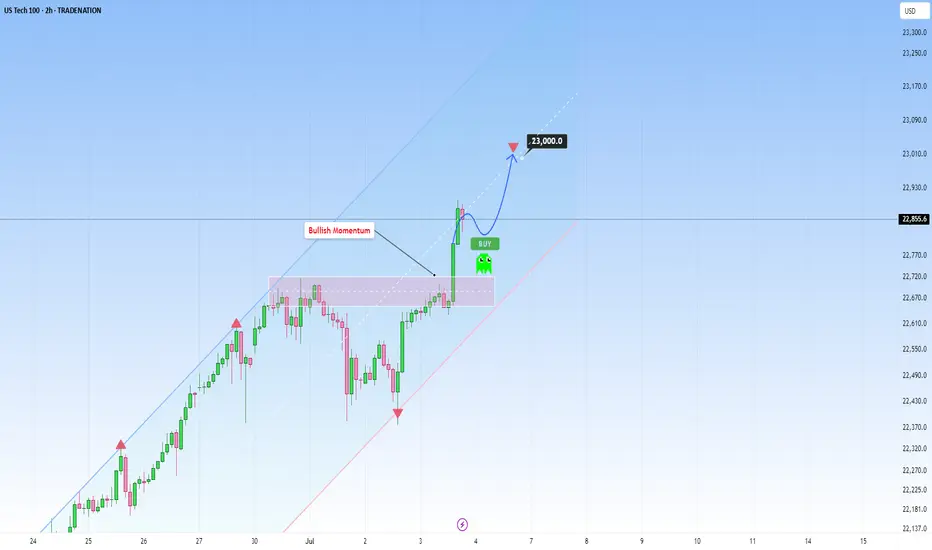
US100 rises sharply, with further upside target of 23,000At this stage, US100 continues to ride a dominant ascending channel structure, maintaining a consistent bullish structure supported by strong fundamentals as well as technical positioning.
The current price action reflects a high-confidence trend environment, underpinned by steady economic resilience in the U.S. tech sector and growing investor optimism surrounding AI-driven growth and corporate earnings. This alignment between structure and sentiment reinforces the strength of the current trend.
What’s especially encouraging is how the price has remained in the upper half of the ascending channel. Every corrective move has been shallow and absorbed quickly as well. This kind of behavior is exactly what you want to see in a strong trend.
From a structural perspective, the recent break of the prior swing high confirmed a bullish break of structure (BOS), reinforcing the broader uptrend. That’s a meaningful move, not just technically, but also psychologically, as it validates that bullish momentum remains intact and market participants are still positioning for higher levels.
No signs of weakness are showing up yet. If anything, the structure is intact and there’s no evidence of a shift in momentum. This makes it a good opportunity for traders who are "late to the party" to consider entering, as the trend still looks strong and continuation is likely.
As for upside targets, the 23,000 level is a natural extension. It aligns with the middle of the channel and fits within the current rate of expansion. If we don’t see any warning signs (like impulsive bearish candles), this target remains both technically justified and psychologically relevant.
Just sharing my thoughts on support and resistance, this isn’t financial advice. Always confirm your setups and manage your risk properly.
Disclosure: I am part of Trade Nation's Influencer program and receive a monthly fee for using their TradingView charts in my analysis.
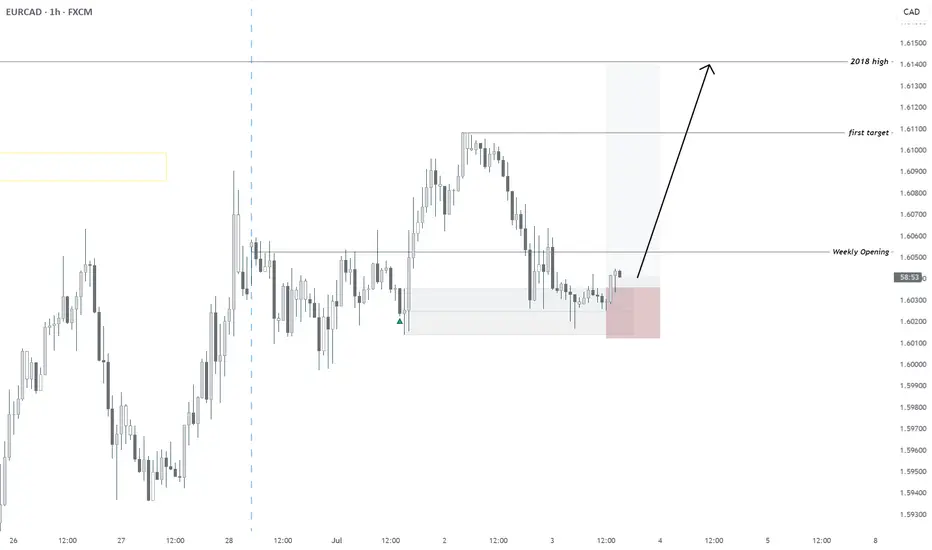
07/02/2025 | EURCAD | BULLISH - REACHING MULTI-YEAR HIGHDaily FX Outlook today:
All timeframes Bullish
Invalidation: 1.60055
First TP: on chart
Second: 2018 High
Dow’s fighting hard for that breakoutDow Jones is moving within a bullish channel
with low selling pressure —
strong legs pushing toward the top.
I’m expecting another solid bullish leg.
BLACKBULL:US30

BITCOIN TOUCHED 110K — THEN REJECTEDNot what bulls wanted to see.
With massive gaps below, this kind of price action ain’t it.

Navigating BTC the Volatile Path to a Potential $117,000 PeakBitcoin at a Crossroads: Navigating the Volatile Path to a Potential $117,000 Peak
Introduction: A Tale of Two Forces
The world of Bitcoin is once again a theater of high drama. After a breathtaking surge that brought the digital asset tantalizingly close to its all-time high, the market now stands at a pivotal crossroads, caught in a tense tug-of-war between powerful bullish undercurrents and formidable macroeconomic headwinds. On one side, a confluence of unprecedented institutional adoption, potent on-chain signals, and a volatile derivatives market suggests an imminent price explosion. Analysts and investors whisper of a short-term upper bound of $117,000, with some seeing a potential tap of $116,000 as early as July amid a ‘perfect storm’ of macro catalysts. A move to this level would represent a significant 6.45% jump from Bitcoin’s recent price, a leap that seems entirely within reach when viewed through the lens of the asset's internal momentum.
Yet, on the other side stands the unyielding wall of global economic reality. Bitcoin’s recent attempt to decisively conquer the $110,000 level was swiftly reversed as strong U.S. jobs data and other factors tempered expectations of a near-term Federal Reserve rate cut. This macroeconomic reality has cast a long shadow over risk assets, including Bitcoin, creating significant resistance at the previous all-time high of around $112,000. Analysts point to an absence of new, retail-driven buyers and the kind of "FOMO-driven greed" that characterized previous bull runs as a key factor pinning the price down.
This creates a fascinating and high-stakes dichotomy. The very structure of the Bitcoin market has undergone a "paradigm shift," with institutional exchange-traded funds (ETFs) providing a steady, relentless stream of demand. At the same time, the asset remains tethered to the decisions of central bankers and the health of the global economy. This article will delve into the intricate layers of this conflict, exploring the powerful bull case built on on-chain data and market structure, the sobering macroeconomic headwinds, the psychological barrier of the all-time high, and the long-term predictions that see Bitcoin potentially reaching $200,000. As the market braces for pivotal events like the upcoming Jackson Hole Economic Symposium, the question on every investor's mind is which of these two powerful forces will ultimately dictate Bitcoin's next monumental move.
The Bull Case: A Cauldron of On-Chain and Derivatives Strength
Bitcoin’s impressive rally was not a random speculative whim; it was underpinned by a bedrock of strong on-chain and technical signals that paint a compelling picture of underlying market health and explosive potential. These indicators, which provide a transparent view into the blockchain’s activity, suggest that the current price action is just the beginning.
On-Chain Analysis: The Blockchain's Transparent Ledger
On-chain analysis is the practice of examining the public and immutable data on a blockchain to understand the behavior of network participants. Unlike traditional financial markets, where investor actions are opaque, Bitcoin’s ledger allows for a granular assessment of transaction volumes, wallet balances, and investor profitability, offering a data-driven glimpse into market sentiment.
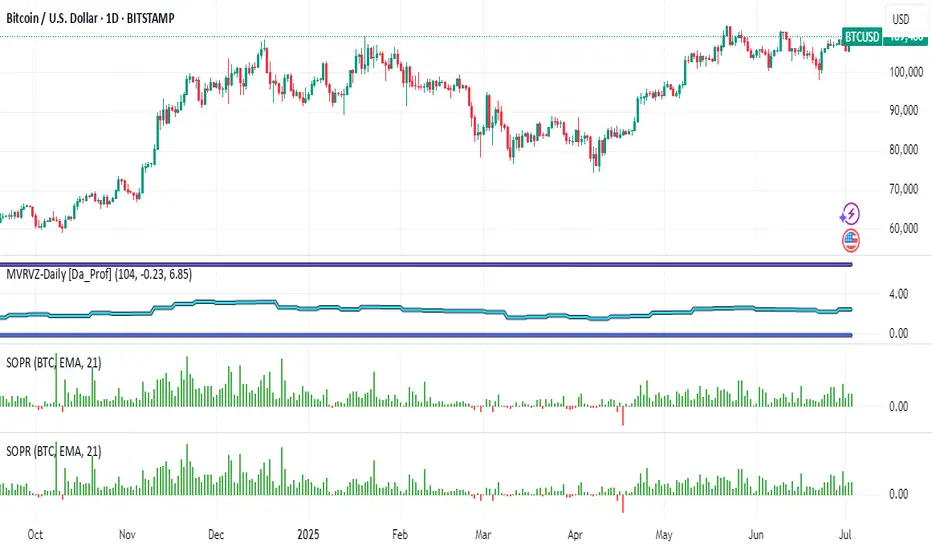
Two of the most powerful on-chain metrics in this context are the Market Value to Realized Value (MVRV) ratio and the Spent Output Profit Ratio (SOPR).
The MVRV ratio is a fundamental valuation tool that compares Bitcoin's total market capitalization to its "realized capitalization." While market cap is the current price multiplied by all coins in circulation, realized cap values each coin at the price it was last moved on-chain. Essentially, MVRV compares the current market price to the average cost basis of all investors. A high MVRV ratio suggests the market is overheated, while a ratio below 1.0 signifies that the average investor is underwater, a condition often seen at market bottoms.
The Spent Output Profit Ratio (SOPR) offers a more immediate look at market behavior by analyzing the profitability of transactions occurring on the network. It is calculated by dividing the sale price of a Bitcoin by the price it was last acquired.
• When SOPR is greater than 1, it means that, on average, coins being sold are in profit.
• When SOPR is less than 1, it means coins are being sold at a loss.
• A SOPR value of 1 acts as a critical psychological level. In bull markets, the market often "bounces" off this line, as investors are reluctant to sell at a loss, creating strong support.
The Derivatives Market: Funding Rates and the Looming Short Squeeze
Beyond the blockchain itself, the cryptocurrency derivatives market provides another layer of bullish sentiment. This market is dominated by perpetual futures contracts, which use a funding rate mechanism to stay tethered to the spot price.
• Positive Funding Rate: When the futures price is higher than the spot price, longs pay shorts, indicating dominant bullish sentiment.
• Negative Funding Rate: When the spot price is higher than the futures price, shorts pay longs, indicating dominant bearish sentiment.
Paradoxically, a deeply negative funding rate can be an extremely bullish contrarian indicator. A crucial historical precedent exists: Bitcoin price rallied 80% the last time BTC funding rates flipped red. When funding rates are negative, it means a large number of traders are shorting the market. If the price begins to rise against them, these short sellers must buy back Bitcoin to close their positions and limit their losses.
This forced buying can trigger a "short squeeze." A large cluster of potential short liquidations has been identified near the $111,320 level, with an estimated $520.31 million in leveraged positions at risk. If the price can push through this zone, it could trigger a cascade of liquidations, providing the fuel to accelerate Bitcoin’s next leg higher into price discovery. This mechanism represents one of the most powerful potential catalysts for a rapid move toward the $116K-$117K target.
The Macroeconomic Maelstrom: A "Perfect Storm" of Headwinds
While Bitcoin’s internal metrics flash green, its path is being obstructed by a formidable storm of macroeconomic factors. In today's interconnected financial world, no asset is immune to the policies of central banks. The recent reversal from the push beyond $110,000 is a stark reminder of this reality, as markets began to discount the odds of the Federal Reserve lowering interest rates.
The Federal Reserve and Interest Rate Jitters
For the past several years, the price of Bitcoin has been highly correlated with monetary policy. A policy of low interest rates generally creates a favorable environment for assets like Bitcoin by lowering the opportunity cost of holding them compared to bonds or savings accounts. Conversely, a period of monetary tightening—characterized by higher interest rates—has a negative effect on Bitcoin's price.
The market's sensitivity to this was on full display when strong U.S. economic data reinforced the case for keeping rates "higher for longer" to contain inflation. This immediately took the wind out of Bitcoin’s sails and halted the rally. An unexpected rate cut, however, could send Bitcoin back toward its all-time high of $112,000.
All Eyes on Jackson Hole
This brings into focus the immense importance of the Jackson Hole Economic Symposium. This annual conference is a crucial event where central bankers from around the globe discuss pressing economic issues and signal future policy directions. Speeches from key figures, particularly the Federal Reserve Chair, are scrutinized by global markets for clues about the future of monetary policy.
The anticipation surrounding the event highlights its high stakes for risk assets. Market participants will be listening for any hint of a dovish pivot (a signal that rate cuts are back on the table) or a hawkish stance (a reinforcement of the "higher for longer" narrative).
• A dovish signal could be the catalyst that reignites Bitcoin's rally by weakening the dollar and sending risk assets soaring.
• A hawkish signal, on the other hand, could reinforce the current headwinds, potentially leading to a deeper correction for Bitcoin.
The Great Wall of $112K: Why All-Time Highs Are Hard to Break
Every seasoned market participant knows that previous all-time highs (ATHs) are not just numbers on a chart; they are formidable psychological barriers. For Bitcoin, the level around $112,000 represents this wall. Breaking through it requires immense momentum, and the current struggle to do so is explained by a critical missing ingredient: widespread, retail-driven Fear of Missing Out (FOMO).
The Psychology of an All-Time High
An ATH represents a point of maximum financial opportunity and maximum regret. This creates a powerful and complex dynamic:
1. Profit-Taking: Long-term holders and traders who bought at lower prices see the ATH as a prime opportunity to realize their gains.
2. Break-Even Selling: Investors who bought at or near the previous peak may be eager to sell as soon as their position returns to break-even.
3. Hesitation from New Buyers: For new investors, buying at an all-time high feels inherently risky, leading to hesitation.
Overcoming this selling pressure requires a massive wave of new demand, a force often fueled by pure, unadulterated FOMO.
The Absence of FOMO-Driven Greed
FOMO, or the "Fear of Missing Out," is the force that turns a rally into a parabolic ascent, characterized by a surge in retail interest and media saturation. Analysts suggest that a key reason Bitcoin can’t break the $112K all-time high is the absence of new buyers and FOMO-driven greed. While there have been spikes in retail enthusiasm, the kind of euphoric mania seen at the peak of previous cycles has yet to fully materialize in 2025. Without that surge of irrational exuberance, there may not be enough buying pressure to absorb the natural selling that occurs at an all-time high, creating a stalemate.
The Paradigm Shift: How Institutional ETFs Changed the Game
While the lack of retail FOMO explains the resistance at the all-time high, the very reason Bitcoin reached this level so quickly is due to a fundamental, game-changing development: the approval and launch of spot Bitcoin Exchange-Traded Funds (ETFs) in the United States. This event represents a true "paradigm shift" in market structure, providing a powerful counterbalance to the whims of retail sentiment.
A spot Bitcoin ETF directly holds Bitcoin and allows investors to gain exposure through traditional brokerage accounts, dramatically simplifying the investment process. This has had a revolutionary impact:
1. Accessibility and Legitimacy: ETFs have democratized access to Bitcoin for a massive new audience and conferred a new level of legitimacy on the asset class.
2. Unlocking Institutional Capital: Most importantly, ETFs created a regulated pathway for institutional investors to allocate capital to Bitcoin.
The impact has been staggering, with massive ETF inflows directly fueling Bitcoin's price appreciation. In a recent two-month period, for instance, U.S.-based spot Bitcoin ETFs recorded nearly $10 billion in inflows. This is not the fickle demand of a retail FOMO cycle; it is the steady, calculated allocation of capital from major financial players, providing a strong floor for the price.
Gazing into the Crystal Ball: Near and Long-Term Price Horizons
With these conflicting forces shaping the market, analysts are looking at both short-term technical targets and long-term fundamental models to chart a potential path forward.
Short-Term Targets: The Path to $117,000
The immediate upper bound for Bitcoin is pegged by many analysts at $117,000, with some suggesting a move to $116K in July is possible. This target is derived from a combination of technical analysis, historical seasonal trends, and the potential for a short squeeze. A decisive break above the $112,000 all-time high would clear the path for a rapid move toward this level.
The Long-Term Vision: A $200,000 Call
Looking further ahead, some of the most bullish predictions from institutional players call for Bitcoin to hit $200,000 by the end of 2025. This forecast is not based on short-term chart patterns but on a fundamental assessment of supply and demand in this new era. The reasoning is that there is simply too much institutional demand to keep prices flat for long, a trend driven by the continued success of spot Bitcoin ETFs and growing regulatory clarity.
Interestingly, this bullish institutional sentiment for Bitcoin is not always extended to other major cryptocurrencies. Some outlooks are less confident that assets like Ethereum (ETH) and Solana (SOL) will hit new all-time highs this year. Challenges such as network reliability issues and the lack of similar institutional products are cited as reasons for a more tempered outlook on these other assets. This suggests a potential future where Bitcoin's performance decouples from the broader altcoin market, driven primarily by its unique status as an institutional-grade digital asset.
Conclusion: The Great Tension and the Path Forward
Bitcoin's current market position is one of profound tension. In the world of its own blockchain and market structure, the signals are bullish. A new era of institutional demand, evidenced by billions flowing into spot ETFs, has created a paradigm shift. This is reinforced by a derivatives market primed for a potential short squeeze.
However, Bitcoin does not exist in a vacuum. It is also a participant in the broader financial ecosystem, where a hawkish Federal Reserve has put a damper on risk-on sentiment. This macroeconomic resistance is amplified by the psychological barrier of the all-time high, where natural profit-taking meets the absence of the retail-driven FOMO that defined past cycles.
The resolution of this conflict will define the next chapter for Bitcoin. A catalyst could come from the Jackson Hole Symposium, a sudden acceleration in ETF inflows, or a shift in the macroeconomic landscape. What is certain is that Bitcoin is no longer just a retail phenomenon; it is a maturing asset on the global stage, navigating a complex interplay of internal strength and external pressures. Whether it reaches $117,000 in the coming months or faces a setback, its journey will be a masterclass in the collision of technology, finance, and human psychology.
Weather Factors and Storage Levels Across the AtlanticCAPITALCOM:NATURALGAS MCX:NATURALGAS1! NYMEX:NG1! PEPPERSTONE:NATGAS
Current prices vs. price spread 10 days before expiry by month since 2010. The 2025 summer futures contracts are still trading above the median expiration price, but remain within the interquartile range. Winter 2026 contracts declined relative to the previous week but remain higher than 2025, similar dynamics are observed in 2027. The market is slowly but still starting to stabilize.
Current Forward curve compared to 2020—2024. A strong upward bias in the curve remains in 2025 despite the price decline last week. The shape of the curve after 2027 remains more stable, and the decrease in outright contract prices has not altered it. It stays within a price range comparable to the corresponding 2023-2024 curves for the same period of the year.
Current gas inventories and next week's forecast compared to 2019—2024. For the 26th week (June 21-27), we anticipate a 45 BCF increase in storage. The level of filling will be above the median for the previous 5 years. Despite falling pumping rates, if the current supply and demand situation persists, the 2024 peak level is possible. The weather in the 2H of summer remains a constraint.
Weekly HDD+CDD totals from current NOAA data and forecast for the next two weeks compared to 1994—2024. HDD+CDD values in the first half of June were below the median. Week 27 (June 30—July 6) is expected to remain comparatively hot, relative to the last 30 years. The forecast values for week 28 are on the upper quantile.
Weekly cumulative supply/demand difference vs. 2014—2024. If we take a look by region, we can see forecast values for the current and following week above average in almost all regions.
Change in monthly weather averages for 10 years from 1990 to 2024. Over the past 30 years, July has become hotter by 20 HDD+CDD units.
Weekly cumulative supply/demand difference compared to 2014-2024. The April-June 2025 supply/demand balance is well below the 10-year median due to low temperatures in the 1H of summer. The last two weeks have seen a trend reversal towards a higher balance above the historical median. At the same time, due to production growth over the last week, we are monitoring whether the increased demand from consumption will be offset by production growth.
Percentage change in Spot and near-term futures price relative to the beginning of the year for 2010-2025 by month. Across 15 years of carrying out statistics, July spot and near-term futures became traded with minimal price divergence.

Forterescue Ltd Quote | Chart & Forecast SummaryKey Indicators On Trade Set Up In General
1. Push Set Up
2. Range Set Up
3. Break & Retest Set Up
Notes On Session
# Forterescue Ltd Quote
- Double Formation
* (A+ SIgnal)) | Completed Survey
* (Diagonal Shift)) | Subdivision 1
- Triple Formation
* (P1)) / (P2)) & (P3)) | Subdivision 2
* (TP1) = a / Long Consecutive Range
* (TP2) = b / Short Consecutive Pullback | Subdivision 3
* Daily Time Frame | Trend Settings Condition
- (Hypothesis On Entry Bias)) | Indexed To 100
- Position On A 1.5RR
* Stop Loss At 74.00 USD
* Entry At 67.00 USD
* Take Profit At 57.00 USD
* (Uptrend Argument)) & No Pattern Confirmation
* Ongoing Entry & (Neutral Area))
Active Sessions On Relevant Range & Elemented Probabilities;
European-Session(Upwards) - East Coast-Session(Downwards) - Asian-Session(Ranging)
Conclusion | Trade Plan Execution & Risk Management On Demand;
Overall Consensus | Sell

$RIOT Continues to Follow PathNASDAQ:RIOT Is sticking closely to the plan testing the bottom and top of the channel multiple times.
Price closing above the weekly 200EMA and weekly pivot Friday will be a very bullish signal. As we have over 4 tests of the upper boundary resistance there is a high probability we break through and continue higher in a high degree wave 3.
Initial targets are the weekly R5 pivot at $39 and all time high at range at $79.
Price tested the .618 Fibonnaci retracement in a complex correction for wave 2.
Analysis is invalidated below the channel support.
Safe trading

$MSTR Megatrend Continuation?NASDAQ:MSTR is market leader in the CRYPTOCAP:BTC strategic reserves strategy and has set the benchmark.
After a nearly 20x rally profit take is exceptive, price has held up extremely well through the last 6 months only dropping to the .236 Fibonacci retracement and weekly pivot. As Bitcoin continues into price discovery expect the MSTR rally to continue with renewed tailwinds.
It is an extremely hated stock as well as its collection of yield baring derivatives. The keeps the social mood / sentiment low which could prove further tailwind for growth.
I am looking at a terminal target this cycle of around $1500 at the R5 weekly pivot.
Safe trading

$WULF Critical Resistance!NASDAQ:WULF has had a great come back but has just hit a triple sword resistance: weekly 200EMA, weekly pivot and High Volume Node where I expect it to struggle for a while!
Are CRYPTOCAP:BTC miners the new altcoins?
Bullish continuation through these resistances will flip them to support and demonstrate fundamental resilience on an improving macro economic background overcoming technical analysis.
Long term tailwind potential can be as high a10x from here but more realistic targets are the R3 weekly pivot $17 and R5 weekly pivot at $25.
Analysis is invalidated below the high degree wave (4) of a leading (or ending) diagonal Elliot Wave pattern.
Safe trading

LONG ON USD/JPYUSD/JPY has given us a CHOC (change of character) from down to up.
It has engineered sell side liquidity right above a demand zone.
I expect price to sweep sell side liquidity, tap into the demand zone then take off to the upside.
looking to catch 150-250 pips on UJ. (Economic News could set this trade on Fire!)

GBPAUD ENTRY CHARTOn this pair, we are anticipating for a SELL CONTINUATION, the intra-day time is BEARISH, but also we have strong BEARISH ENGULFING CANDLE on the daily close, the H1 is bearish, with a BB that is in confluence with the H4 SUPPLY, also we have additional confluence on this pair, So if this matches with your Idea, You can do well to join us with a Good Risk. THANK YOU and HAPPY NEW MONTH.

SHORT ON SILVER XAG/USDSilver has built lots of sell side liquidity since June 10 and should now be ready to sweep it.
I will be selling silver to the next demand level.

$IREN Killing It. More Upside?NASDAQ:IREN has poked above the true all time high range (Launch price dump excluded) in a high degree Elliot wave 3
Long term target remains the R5 weekly pivot at $40 but may over extend with a bullish Bitcoin and Macro economic tailwind, coupled with AI growth.
Many thought this was a greedy target at $5 but now that price is $16 it doesn't look so bad. You have to know when to let the runners run, that is were the big bucks are trading!
Any retracement of a decent degree should expect to find support at the weekly pivot $9.4 before continuing upwards and may present an excellent buying opportunity! I will be posting the signal levels on Substack.
As always ,all time high range will be the next support if price continues upwards from here.
Safe trading

BankNifty levels - Jul 04, 2025Utilizing the support and resistance levels of BankNifty, along with the 5-minute timeframe candlesticks and VWAP, can enhance the precision of trade entries and exits on or near these levels. It is crucial to recognize that these levels are not static, and they undergo alterations as market dynamics evolve.
The dashed lines on the chart indicate the reaction levels, serving as additional points of significance. Furthermore, take note of the response at the levels of the High, Low, and Close values from the day prior.
We trust that this information proves valuable to you.
* If you found the idea appealing, kindly tap the Boost icon located below the chart. We encourage you to share your thoughts and comments regarding it.
Wishing you successful trading endeavors!

Nifty levels - Jul 04, 2025Nifty support and resistance levels are valuable tools for making informed trading decisions, specifically when combined with the analysis of 5-minute timeframe candlesticks and VWAP. By closely monitoring these levels and observing the price movements within this timeframe, traders can enhance the accuracy of their entry and exit points. It is important to bear in mind that support and resistance levels are not fixed, and they can change over time as market conditions evolve.
The dashed lines on the chart indicate the reaction levels, serving as additional points of significance to consider. Furthermore, take note of the response at the levels of the High, Low, and Close values from the day prior.
We hope you find this information beneficial in your trading endeavors.
* If you found the idea appealing, kindly tap the Boost icon located below the chart. We encourage you to share your thoughts and comments regarding it.
Wishing you success in your trading activities!

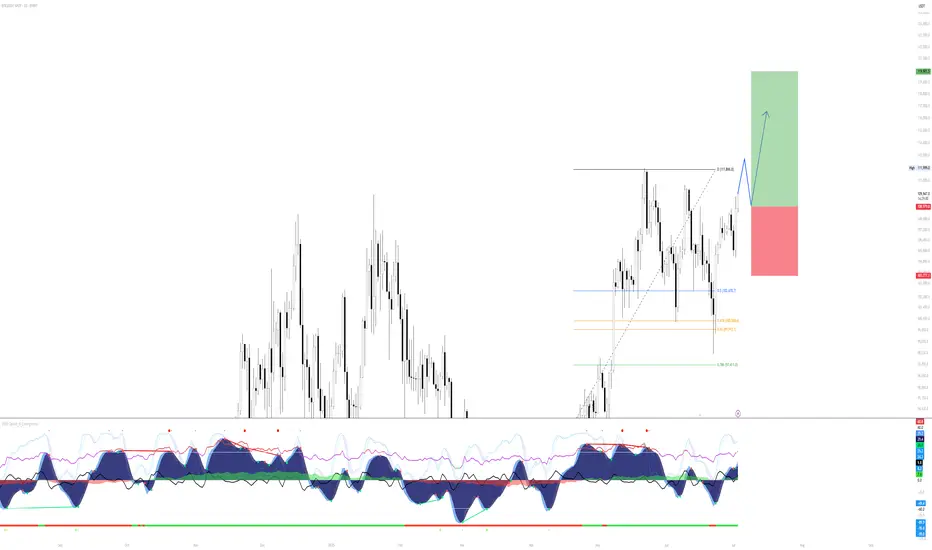
BTC/USDT Long Setup – Daily Bullish Continuation PlayMarket Context:
Bitcoin has reclaimed significant ground after a corrective phase and is now approaching prior highs. The current move suggests strength and potential continuation — but with overhead resistance near 111,866, a retracement or consolidation before continuation is likely.
Setup Idea:
The chart illustrates a bullish continuation scenario: price may push slightly higher into resistance, then retrace into a more favorable entry zone before targeting new highs. The Fibonacci retracement levels between 100,500 and 102,470 align with a high-probability demand zone for a dip buy.
Trade Plan:
Entry Zone: Await retracement into the 0.5–0.618 fib zone (102,400–100,500)
Stop Loss: Below 99,900 (beneath 0.65 fib and invalidation structure)
Target: 119,900 (clean extension above prior high)
Risk/Reward: Favorable multi-R setup based on macro continuation
Notes:
The setup anticipates a pullback before the next impulse. If BTC breaks through 111,900 with momentum and no retrace, the trade idea would shift to chasing on strength or waiting for consolidation above.
Momentum indicators on VMC show bullish pressure building, but overbought conditions suggest temporary cooling may occur.
Let the retrace come to you — and position accordingly on confirmation.
Fallihg Wedge on AeroUSDT Reason to buy:
1. There's a falling wedge pattern in daily timeframe
2. Good volume
3. Stochastic oversold
4. Risk reward ok

GBPCAD: Your Trading Plan Explained 🇬🇧🇨🇦
GBPCAD is coiling on an important daily support cluster.
To trade that with a confirmation, pay attention to
an inside bar pattern on a 4H.
1.8579 is the level of an upper boundary of its range.
Its breakout and a 4H candle close above will provide
a strong bullish signal.
A bullish movement will be expected to 1.865 level then.
❤️Please, support my work with like, thank you!❤️
I am part of Trade Nation's Influencer program and receive a monthly fee for using their TradingView charts in my analysis.

$TSLA Time to Fade or..?NASDAQ:TSLA (like NASDAQ:GOOG ) is standing out to me as bullish, yet, corrective Elliot Waves a higher degree series of ABCs appear to be underway.
A final wave C appears to be underway which would take price too all time highs in an expanded flat correction pattern. My count could be wrong and the interference could be from the increase it sentiment volatility connected to the US headlines lately and Trump posting on socials. Things may get back to normal after the summer and a clearer pattern may emerge.
Price is struggling to get past the weekly pivot point bullishly or the weekly 200EMS bearishly and is trapped within that range.
For now long term target is the R2 daily pivot at $693 as the higher probability is continued upside
Safe trading

$SPX500 Most Hated Rally to Continue?FOREXCOM:SPX500 continues into price discovery suggesting a wave (3) is still underway but nearing a its minimum target of the 1.618 Fibonacci extension target $6310. Overextension of this target will demonstrate an even stronger bullish outlook.
Long term terminal targets remains above $7000 for me.
A short term pull back is a high probability but markets can stay irrational longer than participants can stay liquid.
Safe trading
