CAD/JPY Bearish Trend Analysis – Key Levels to Watch CAD/JPY Bearish Trend Analysis – Key Levels to Watch
The CAD/JPY pair is currently moving in a bearish trend structure, indicating a weakening of buying pressure in the market. This suggests that sellers are gaining control, and the pair is likely to remain under downward pressure in the upcoming trading sessions. Traders should prepare for potential further declines unless a significant reversal pattern emerges.
Bearish Momentum Signals Downside Risk
Recent price action shows that the pair has been struggling to sustain upward movements, with lower highs and lower lows reinforcing the bearish bias. The weakening buying pressure is evident from the lack of strong bullish candles and diminishing volume on upward retracements. This signals that any short-term recoveries may be limited, and the downtrend could resume.
Key Support and Resistance Levels
- Downside Target: The next major support level to watch is 104.900. If selling momentum accelerates, this level could be tested in the coming sessions. A break below this support may open the door for further declines toward lower psychological levels.
- Upside Resistance: On the higher side, 106.150 stands as a critical resistance level. Any bullish retracement toward this zone could attract fresh selling pressure, keeping the bearish structure intact unless convincingly broken.
Trading Strategy Considerations
- Short Opportunities: Traders may consider short positions on pullbacks toward resistance, particularly near 106.150, with a downside target of 104.900.
- Risk Management: A break above 106.150 could invalidate the bearish outlook, signaling a possible trend reversal or consolidation. In such a scenario, stops should be adjusted accordingly.
Conclusion
The CAD/JPY pair remains bearish, with 104.900 as the next key downside target. Resistance at 106.150 is crucial for maintaining the downtrend. Traders should monitor price action around these levels for confirmation of continued bearish momentum or a potential reversal. Stay cautious and trade with disciplined risk management.
Supply and Demand

GBP/AUD 1H technical and fundamental analysisGBP/AUD 1H technical and fundamental analysis
GBP/AUD has drifted slightly lower over the past week (≈ –0.47%) and month (≈ –0.18%), despite being up roughly +9% YTD. The pair remains under bearish pressure in the short term, primarily due to weaker-than-expected UK GDP data and dovish signals from the Bank of England, which have raised concerns over a potential economic slowdown and future rate cuts.
These fundamentals are weighing on the British Pound, while the Australian Dollar remains relatively stable due to commodity support and neutral RBA guidance.
Technical Outlook (1-Hour Timeframe):
GBP/AUD recently formed a triple top pattern at the upper range, signaling strong seller dominance. Price has since rejected and is heading lower, currently testing the 2.0850–2.0760 minor support zone.
After this zone was broken, price began accumulating sell positions, suggesting institutional interest in driving the pair toward a liquidity zone. We are now seeing a potential stop-loss hunt near 2.0740, which aligns with a smart money sell setup.
Once the market breaks below and closes a bearish candle under key support, it will confirm further downside continuation.
📊 Trade Setup
📍 Area of Interest (AOI): 2.07420 (Sell Limit after candle close below key level)
🛡 Stop-Loss: 2.08120 (Just above the liquidity zone, if clear manipulation is confirmed)
🎯 Take Profit: 2.05980 (Next minor key support / ~1:2 RR)

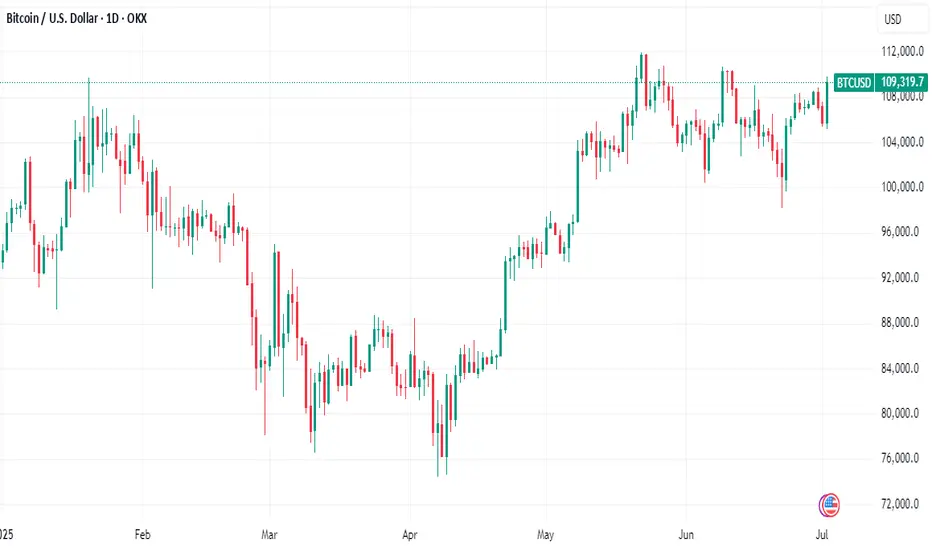
Bitcoin’s not done dropping. Selling pressure’s still on!Welcome aboard ✌️
In order for Bitcoin to climb higher, we first need a deeper correction.
Right now, price is stuck inside a channel — and it’ll take stronger momentum to break out.
🔻 So for now, I’m expecting further downside. Stick with me and don’t miss this bearish wave!
BINANCE:BTCUSD OANDA:BTCUSD

EURCHF 02/07/2025Weekly:
-Inverse H&S pattern.
-Previous week low liquidity sweep.
-Expecting a bullish reaction.
Daily:
-Bullish M pattern.
-Liquidity sweep.
-Daily lows.
4H:
-Inverse H&S pattern.
-Double bottom.

#XAU/USD SELL TRADE SETUP [SHORT]In this analysis we're focusing on 2H timeframe. As we know, Gold is moving in a strong bearish trend. The best selling zone is 3295 - 3305 key levels area. If gold encounters rejection from this zone, we can anticipate a potential decline in price towards its targeted levels.
Target 1:3260
Target 2:3250
Target 3:3240
Wait for a retracement to sell with strong confirmation and proper risk management.
#GOLD 2H Technical Analysis Expected Move.

Bitcoin Supply Shock Is No Longer a Theory, But a Reality
In the intricate and often frenetic world of digital assets, the market is constantly sending signals. Some are loud, ephemeral flashes of volatility that capture headlines for a day. Others are quiet, seismic shifts that build slowly beneath the surface, unnoticed by the masses until they erupt with earth-shattering force. Today, the Bitcoin network is broadcasting one of these profound, underlying signals. It speaks of a disappearance, a vanishing act on a scale never before seen, pointing toward a supply shock so significant that it threatens to redefine the very concept of price discovery for the world’s premier cryptocurrency.
The paradox currently facing market observers is the disconnect between Bitcoin’s somewhat range-bound price, which has struggled to decisively conquer the territory above $120,000, and the tectonic movements occurring in its fundamental market structure. While the price action might suggest a market in equilibrium, a state of indecisive calm, the data tells a story of immense and growing tension. It is a story of a collision course between two unprecedented forces: a relentless, programmatic wave of institutional demand and a rapidly dwindling, fiercely guarded supply.
The central piece of evidence, the smoking gun for this impending crisis, is the state of Bitcoin reserves on cryptocurrency exchanges. These platforms, the bustling marketplaces where buyers and sellers meet, have seen their Bitcoin inventories plummet to a seven-year low. Less than 15% of the total circulating Bitcoin supply now resides on these exchanges, a figure that is as statistically stark as it is historically significant. This isn’t merely a data point; it is a profound statement of intent from the global cohort of Bitcoin holders. It signifies a monumental shift from short-term speculation to long-term conviction, a collective decision to withdraw assets from the realm of immediate liquidity and into the deep, fortified vaults of cold storage. This great disappearance is the quiet prelude to a very loud event, and to understand its implications, one must dissect the powerful forces of both supply and demand that are pulling the market to its breaking point.
The Vanishing Act: Where Has All the Bitcoin Gone?
To grasp the gravity of the dwindling exchange reserves, one must first understand the role of an exchange in the life cycle of a Bitcoin. An exchange is a trading floor. Assets held there are, by their very nature, liquid and available for sale. A holder who moves their Bitcoin onto an exchange is signaling an intent to trade or sell, either immediately or in the near future. Conversely, moving Bitcoin off an exchange and into a personal, self-custodied wallet—often called cold storage—is a deliberate act of preservation. It is a declaration that the owner has no immediate intention of selling. They are choosing to become a long-term holder, a saver, effectively removing their coins from the active, tradeable supply.
For years, the flow of Bitcoin onto and off of exchanges has served as a reliable barometer of market sentiment. During the euphoric peaks of past bull markets, a predictable pattern emerged: as prices soared, a flood of Bitcoin would move onto exchanges as long-term holders finally decided to take profits. This influx of supply would help to satisfy the frenzied buying demand, eventually capping the rally and leading to a market correction.
This cycle, however, is fundamentally different. The opposite is happening. Despite prices reaching new all-time highs, the flow has been overwhelmingly outward. Coins are leaving exchanges at a historic pace, creating a supply-side vacuum. This exodus is not a new phenomenon, but the acceleration over the past 18 months has been breathtaking. It reflects a maturing market and a hardened investor base that has learned the lessons of previous cycles. They have witnessed Bitcoin’s resilience, its ability to weather brutal bear markets and emerge stronger each time. They are no longer content with selling for a 5x or 10x profit, only to watch the asset climb another tenfold in the subsequent years. They have transitioned from treating Bitcoin as a speculative trade to embracing it as a long-term savings technology, a digital store of value in an increasingly uncertain macroeconomic world. The coins are not lost; they have simply gone home, locked away by owners who have no interest in selling at today’s prices.
The Wall Street Leviathan: A New and Insatiable Source of Demand
While the available supply of Bitcoin has been quietly disappearing into private wallets, a new and powerful predator has entered the ecosystem, armed with an insatiable appetite. The launch of spot Bitcoin Exchange-Traded Funds (ETFs) in the United States marked the single most significant structural change in the history of the Bitcoin market. These regulated financial products, offered by the largest asset managers in the world, have constructed a permanent, one-way bridge connecting the traditional financial system to the digital asset space.
This bridge is not for casual tourism; it is a superhighway for capital. The ETFs, led by BlackRock’s behemoth iShares Bitcoin Trust (IBIT), have unleashed a torrent of institutional and retail money that is systematically draining the remaining available supply. The mechanics of these ETFs are crucial to understand. Unlike futures-based products, a spot ETF must acquire and hold the underlying asset—in this case, real Bitcoin—to back the shares it issues to investors. This means that for every dollar that flows into an ETF like IBIT, its managers must go into the open market and buy a corresponding amount of Bitcoin.
The scale of this operation is staggering. In a stunning testament to the demand for this new product, BlackRock’s Bitcoin ETF has, in its short 18-month existence, begun to generate more revenue from annual fees than its long-established and immensely popular S&P 500 fund. This is not a niche product for crypto enthusiasts; it is a mainstream financial blockbuster, attracting billions from investors seeking a simple, regulated way to gain exposure to Bitcoin.
This creates a relentless, programmatic buying pressure that the market has never before had to absorb. Every single trading day, the ETFs collectively purchase a significant amount of Bitcoin. This demand is constant and largely price-agnostic. It is driven by asset allocation decisions, not short-term market timing. This programmatic buying acts like a giant hydraulic pump, sucking up any loose supply available on exchanges. The daily demand from these Wall Street giants often outstrips the new supply of Bitcoin created by miners, creating a structural deficit that can only be filled by one source: the existing coins held by others. And as we’ve seen, those holders are increasingly unwilling to part with their assets.
The Diamond-Handed Super-Majority: A Trillion-Dollar Standoff
The collision between the insatiable demand of the ETFs and the shrinking available supply raises a critical question: why aren't the existing holders selling? With so much new money flooding into the market, basic economics would suggest that the rising price should entice current owners to sell and realize their gains. Yet, the data reveals a fascinating psychological standoff.
According to research from the on-chain analytics firm Glassnode, a "super-majority" of Bitcoin holders are currently sitting on a colossal $1.2 trillion in unrealized profits. This means that a vast portion of the network acquired their coins at prices far below the current level and are deep in the green. In any other market, such a massive overhang of profit would be seen as a significant risk, a powder keg of potential sell pressure waiting to be ignited.
But in the world of Bitcoin, it has become a fortress of conviction. Glassnode’s analysis concludes that the current price, even in the six-figure range, "is not compelling enough for investors to continue selling." This is a revolutionary insight into the mindset of the modern Bitcoin investor. Their price targets have shifted dramatically. They are not looking to sell at $120,000 or even $140,000. For many, these levels are seen as mere stepping stones on the path to a much higher valuation, one that properly reflects Bitcoin’s role as a global, non-sovereign store of value.
Further research into profit-taking behavior confirms this trend. The amount of realized profit—that is, coins being sold at a gain—in the current cycle has yet to match the levels seen during the peak of the 2024 rally. This suggests that the holders who were willing to sell at those prices have already done so. The remaining cohort is composed of the most steadfast believers, the "diamond hands," who are holding out for a much more significant repricing. Some analyses suggest that the Bitcoin price would notionally need to rise another 30%, toward the $140,000 mark, just to reach a point where this cohort even begins to feel tempted to part with their holdings in a meaningful way. This creates a powerful reflexive loop: the less they sell, the less supply is available, and the more explosive the potential price move when demand continues to pour in.
The Macroeconomic Perfect Storm
The conviction of Bitcoin holders and the flood of institutional capital are not occurring in a vacuum. They are a direct response to a global macroeconomic environment that is creating a perfect storm for a hard, scarce asset. The primary driver of this is the unprecedented expansion of the global money supply. The M2 money supply—a broad measure of currency that includes cash, checking and savings deposits, and money market funds—has reached a record high.
Governments and central banks around the world have engaged in years of quantitative easing and fiscal stimulus, effectively printing trillions of dollars to prop up their economies. While often necessary in the short term, this relentless monetary expansion has a corrosive long-term effect: it debases the value of fiat currencies. As the supply of dollars, euros, and yen increases, the purchasing power of each individual unit decreases.
In this environment, rational economic actors begin to search for a safe harbor, a place to protect their wealth from the slow-motion erosion of inflation. Historically, this role was filled by assets like gold. Today, a growing number of individuals, corporations, and even nation-states are turning to Bitcoin. Its mathematically enforced scarcity—a hard cap of 21 million coins that can never be altered—stands in stark contrast to the infinite printability of government-issued money.
This narrative has been supercharged by the recent performance of the US dollar itself. The world’s reserve currency experienced a dramatic 10.8% drop in its worst first-half performance since 1973, signaling a potential shift in global currency dynamics. As the dollar weakens, assets priced in dollars become cheaper for foreign investors, and the appeal of a non-sovereign alternative like Bitcoin grows. This macroeconomic backdrop provides the fundamental "why" behind the Bitcoin trade. It is no longer just a technological curiosity or a speculative bet; it is increasingly viewed as an essential component of a diversified portfolio, a hedge against the very real risks of monetary debasement and geopolitical instability. It is this understanding that underpins bullish price targets that sit around $170,000 and beyond.
Navigating the Uncomfortable Calm
With such a powerfully bullish confluence of factors, the question remains: why has Bitcoin been seemingly stuck in a consolidation pattern, unable to break out and sustain a move into the higher price ranges? Why did the market see a wobble that brought the price down to $105,000, causing anxiety among newer entrants?
The answer lies in the nature of market equilibrium. Even in the most ferocious bull market, there are always sellers. Miners, who must sell some of their newly minted Bitcoin to cover their operational costs, represent a constant source of supply. Early investors may take some profits to diversify their wealth. Short-term traders will try to play the ranges, and even some of the capital in the ETFs will inevitably be redeemed, forcing the funds to sell a corresponding amount of Bitcoin.
The current price range below $120,000 represents the battleground where the relentless, programmatic buying from the ETF leviathan is meeting and absorbing this natural, daily sell pressure. The market is in a state of accumulation and consolidation, building a strong base of support before its next major move. The fact that crypto market sentiment has held steady, even during price dips and the start of the third quarter—a period historically known for its weak seasonality—is a testament to the market's newfound maturity. The "weak hands," or investors with low conviction, have likely been shaken out, leaving a stronger, more resilient base of holders.
This period of sideways price action is likely to be deceptive. The historical seasonality of Bitcoin suggests that summer can often be a period of lackluster performance, lulling market participants into a state of complacency. The idea that Summer 2025 will "catch everyone off guard" stems from this dynamic. While the price chart may look boring, the underlying supply and demand forces are becoming ever more tightly coiled. The pressure is building, and the longer the market consolidates, the more violent the eventual breakout is likely to be.
The Inevitable Collision
The story of Bitcoin in 2025 is the story of an inevitable collision. On one side, you have the most powerful force of demand the asset has ever known: a fleet of Wall Street ETFs, led by the world's largest asset manager, programmatically buying Bitcoin every single day. This demand is structural, relentless, and here to stay.
On the other side, you have the most convicted group of holders in Bitcoin’s history. They are a super-majority, sitting on over a trillion dollars in profit, who have explicitly signaled through their actions and on-chain data that they have no intention of selling at these prices. They are withdrawing their coins from the market at a historic rate, creating a supply desert.
The dwindling reserve of Bitcoin on exchanges is the ticking clock in this grand drama. It is the visible measure of the supply shock in progress. Each day, the ETFs arrive in the market to fill their orders, only to find the shelves are increasingly bare. The deficit they create must be filled by prying coins from the diamond hands of long-term holders. But those holders have made their price clear, and it is not $120,000.
Therefore, the current market is not in a state of calm, but in a state of profound tension. It is the quiet moment before the lightning strike. The forces of an institutional-grade demand shock and a historic holder-induced supply squeeze are on a direct and unavoidable collision course. The question is no longer if this tension will resolve, but when and with what magnitude. The great disappearance of Bitcoin from the open market is the final signal that the supply problem is no longer a distant forecast. It is here, and it is about to change everything.
SOL — Liquidity Sweep & Demand Play1. Wait for price to sweep into demand
2. Enter long on SFP or strong bounce
3. Target: 240+
4. Stop: below demand zone
If no sweep, stay flat or wait for clear reclaim

#5572025 | BTCUSD Supply Zone 1:10BTCUSD Supply Zone Appears in D1 Time Frame Looking Price Action for Long Term Sell
Risk and Reward Ratio is 1:10
After 50 pips Profit Set SL Entry Level
"DISCLAIMER" Trading & investing business is "Very Profitable" as well as risky, so any trading or investment decision should be made after Consultation with Certified & Regulated Investment Advisors, by Carefully Considering your Financial Situation.

GOOG LongMarket Structure Breakdown
Initial Break of Structure (BOS) – Bearish Phase
A significant bearish BOS occurred after a liquidity sweep above the prior high. This marked the temporary dominance of sellers, driving price downward.
Change of Character (ChoCh) – Sentiment Shift
Following the bearish leg, price printed a sharp recovery and broke above internal lower highs, signaling a Change of Character. This is the first indication of buyers regaining control.
Bullish BOS – Confirmation of Uptrend
The bullish BOS validated the upward structural transition, establishing new higher highs and higher lows. This confirms that institutional order flow has shifted bullishly.
🔹 Liquidity Dynamics
The liquidity sweep at the recent low (marked with a red dot) is a critical manipulation event, removing weak longs before institutions accumulate.
The current price action is printing a re-accumulation range, where price is likely to dip into key zones to trap breakout sellers.
Multiple liquidity pockets (green shaded regions) below serve as potential inducement zones. These areas may be revisited to gather liquidity before the next leg higher.
Final target is projected near the higher time frame sell zone around the $186–188 level, where substantial resting liquidity likely exists from previous swing highs.
🔹 Risk Management Considerations
Entry Zones: Look for confirmation-based entries within the liquidity trap zones, avoiding premature positioning at highs.
Stop-Loss: Place invalidation levels below engineered sweep zones to prevent getting caught in liquidity grabs.
Scaling Strategy: A tiered entry model can be effective here — initiating partial entries at the first trap and scaling in on deeper retracements.
Targeting: Conservative traders can aim for the internal high; aggressive positioning could seek full mitigation of the higher time frame zone.

AMZN Short Market Structure Analysis
Break of Structure (BOS)
A bullish run culminated in a BOS to the upside, which typically signals a short-term bullish intent. However, this move acts as a liquidity grab, sweeping buy-side liquidity above the prior high.
Liquidity Sweep & Rejection
Price taps into the higher time frame sell zone, indicated by the shaded red region. The wick into this zone triggers stop-losses from breakout buyers and activates institutional selling interest, leading to a swift rejection.
Inducement & Trap Zones
Several trap zones are clearly mapped out on the descent:
These green areas represent engineered liquidity pockets where buy-side participants are induced to enter prematurely.
As price retraces into these zones, retail traders anticipate reversals, but these retracements serve only to fuel the continuation of the bearish leg.
Lower Liquidity Target (XXX zone)
The chart ultimately projects a move toward the equal lows marked near the $207 level—an area rich in sell-side liquidity. The consistent failure to break lower previously forms a pool of resting liquidity that smart money seeks to exploit.
Liquidity Engineering
The green dots on prior highs mark liquidity collection points—zones where retail buyers are most active.
The higher time frame red zone provides confluence for distribution and is a classic example of liquidity injection followed by reversal.
The step-by-step sell-off shows clear liquidity traps, where short-term demand is absorbed, reinforcing the bearish continuation.
Risk Management Considerations
Stop Placement: Must be placed above liquidity sweep highs and not within internal trap zones to avoid being manipulated out of the trade.
Scaling In: Given the presence of multiple trap zones, one could consider scaling in as price confirms rejection from each zone.
Targeting: A conservative target would be the liquidity void near $207; aggressive traders might look beyond if the structure accelerates.

Analysis on circle using tpo and regular chart longs and shortMust watch video giving 2 really nice Risk reward entries on the Newley listed stock Circle
In this video I highlight a region using limited data of where to get filled if you missed the IPO and want to buy some circle .
We are currently in a no trade zone for buyers as I anticipate that price will gravitate down to the .786/.886 level over time .
In this video I also use the TPO chart "Time price opportunity" and demonstrate what i am looking for from using this type of chart to add to my confluences for a high probability trade .
Also identified in the chart is a short trade off of the weekly pivots and the value area high of the range .
Thankyou for watching and i welcome any questions

to identify BPRs on Brent Oil FuturesI am not good at the ICT price action style. So I got 2 questions for traders that know this well.
1. Did i draw the correct BPRs? I use both bars and volume profile to filter FVGs
2. Do you only use BPRs to do after break trend following or position closing, or you can actually use them in resistance reversal entry?
Need your help and advice mates.

BTC SCALP TradeWait for the entry then take with small amount no high risk must use SL. If BTC don't retrace towards 106.5k in coming hours then don't take risk on shorting it will breakout towards 113k

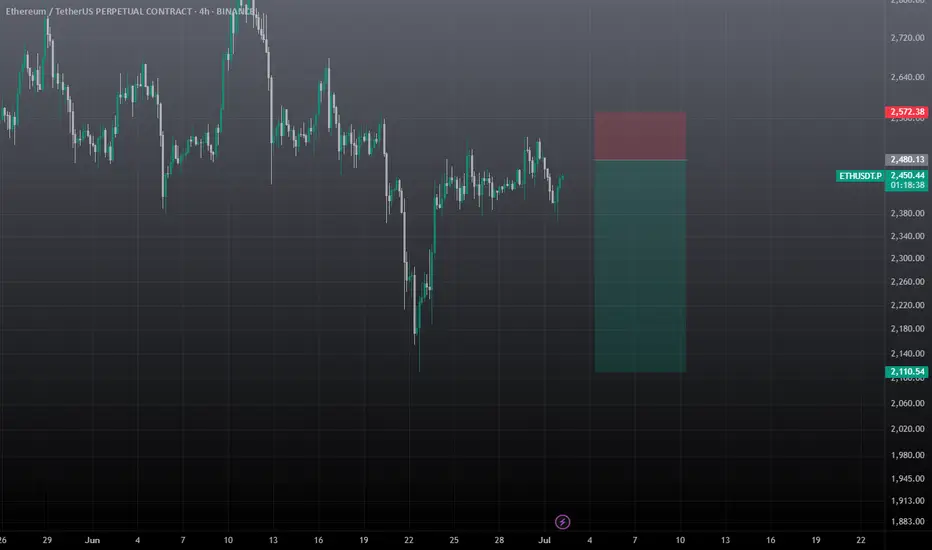
ETHUSDT SWING TRADE SetupWait for the entry and must use sl, if sl hits then wait for candle closure, candle managed to close above the SL, still there is lot of supply zone for eth till 2.7k, So fakeout also possible. I will comment the update, SO closely follow me.
Samsara’s IoT Surge: A Fleet Management Play with Space to GrowSamsara NYSE:IOT , a trailblazer in the Internet of Things (IoT) for fleet management, has been turning heads since its 2021 IPO. With a market cap hovering around $17 billion and its stock quadrupling since debut, the company is riding high on analyst optimism. But beyond the hype, what’s driving Samsara’s ascent-and what risks lie ahead?
From Startup to IPO Star: Samsara’s Journey
Founded in 2015 by Sanjit Biswas and John Bicket-veterans of the tech world who sold their previous startup, Meraki, to Cisco-Samsara hit the ground running. By 2018, it was a unicorn valued at $1 billion, and in 2021, it raised $805 million in a high-profile IPO, catapulting its valuation to $11.5 billion. Fast forward to today, Samsara's shares rose sharply if we compare it to its IPO price, demonstrating and reinforcing investor confidence in its growth.
The Business: IoT Meets Fleet Management
At its core, Samsara offers cloud-based platforms that help logistics and transportation companies optimize operations. Using a mix of cameras, GPS, and AI-powered sensors, its solutions provide real-time insights into vehicle location, driver behavior, and asset tracking. In 2019, the company introduced AI-driven dashcams to monitor driver safety, and by 2021, its subscription revenue topped $300 million with 20,000 customers.
Samsara got a lot of innovations, but what is the latest one? Bluetooth tags for tracking smaller assets, expanding its reach beyond vehicles to parcels and inventory. With annual recurring revenue (ARR) hitting $1.1 billion in 2024 and growing 35% year-over-year, the company’s momentum is undeniable.
Financial Status: Growth with a Profitability Horizon
Samsara’s financials paint a picture of rapid expansion. In Q3 2025, revenue jumped 36% to $322 million, while ARR climbed to $1.349 billion. Gross margins sit at a healthy 73%, and free cash flow is positive—a rarity for high-growth tech firms. Customer growth is equally impressive: the number of large clients (those spending over $100,000 annually) rose 30% in 2024.
Nevertheless, we should note that Samsara remains unprofitable, with net losses narrowing but still present. The company is laser-focused on scaling, reinvesting heavily in R&D and customer acquisition. Analysts expect it to reach breakeven soon, but the timeline still remains a wildcard.
Market Opportunity: A $100 Billion TAM Beckons
Samsara’s addressable market is vast. The Total Addressable Market (TAM) for fleet management and logistics IoT is estimated at $50 billion, with Samsara capturing just 1% of it. Expand that to adjacent sectors-manufacturing, industrial operations-and the TAM balloons to $100 billion. With a market share of only 1%, the runway for growth is immense.
The company’s leadership in its niche is clear, though rivals like Geotab (10% market share) and Verizon Connect NYSE:VZ loom large. Samsara’s edge? A relentless focus on innovation, as seen in its AI-powered Samsara Intelligence platform and partnerships with heavyweights like DHL and Tyson Foods.
Risks to Watch
High-growth tech isn’t without pitfalls. Samsara faces stiff competition in a crowded field, and its reliance on rapid scaling leaves little room for error. Regulatory hurdles, especially around data privacy, could also emerge as IoT adoption spreads. Plus, the company’s unprofitability-while shrinking-remains a concern for risk-averse investors.
A Growth Story with Legs
At $39 per share, Samsara trades below its all-time high, but analysts see plenty of upside. Wells Fargo and Piper Sandler peg its target at $54-$55, with a consensus forecast of $49.50. Samsara NYSE:IOT offers a compelling blend of innovation, market leadership, and a massive TAM. But it’s not a slam dunk-competition and profitability hurdles loom. Still, for those betting on the IoT revolution, Samsara’s growth engine looks hard to ignore.

BANKNIFTYBanknifty levels are based on imbalances
1. gapup 57500 long
2. 57500-56500 trade breakout
3. gapdown 56500 short

NIFTYNifty levels are based on imbalances
1. gapup 25600 long
2. 25600-25450 trade breakout
3. gapdown 25450 short

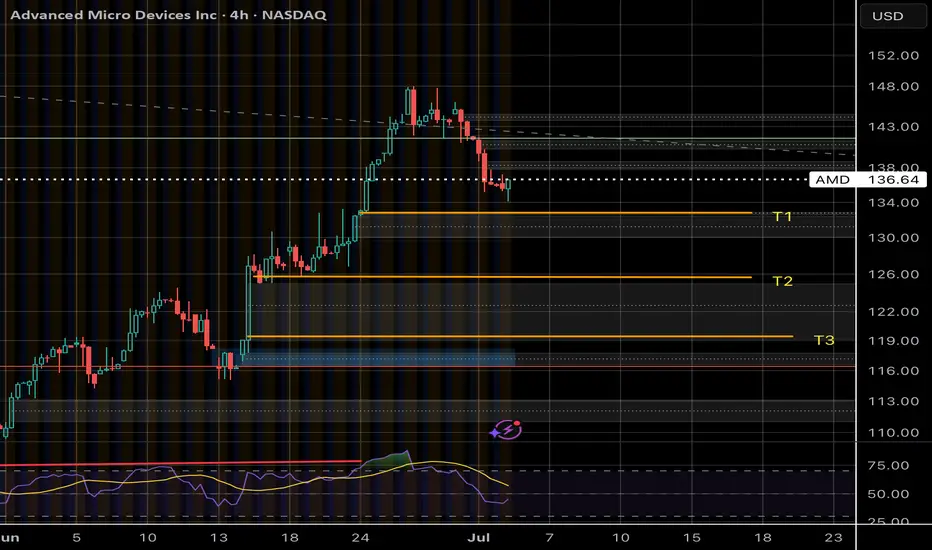
AMD If; ThenIf price goes below T1 I’ll be shorting to T2 and T3 as price fills gaps. As with my Bart pattern scalps, once price reaches a gap fill area it is quite reliable in direction
NZDCAD reached key resistance: Rebound to 0.82450 likelyPrice on NZDCAD has reached a pretty significant resistance level, that has been a key turning point in the past, with several strong reversals from the area. So naturally, I’ve been watching to see how price reacts here again.
We can already see early signs of rejection, so I will monitor this pair and I’ll be looking for short setups from the zone again.
🟥 My sell idea is based on the expectation that this resistance will hold. I would be targeting a move down toward the 0.82450 level , which I feel is a realistic target before any reversal could take from the gains, especially if price respects this structure continuously.
But if price breaks above and starts holding strong above the zone, then I’ll back off the bearish bias and reassess, and I’d consider the bearish idea invalidated, with potential for further upside.
Just sharing how I see the chart right now, not financial advice

Plata’s Bond Debut: A Bet on Mexico’s Digital Banking BoomMexico’s digital banking industry is gaining momentum, and Plata, a fast-emerging fintech player, is making waves with its debut bond issuance. Targeting $120 million (with the potential to scale up to $200 million) marks a turning point for a company transitioning from a credit card issuer to a full-fledged digital bank. For us, it’s a chance to tap into the growth of financial inclusion in Latin America’s second-largest economy. But with high rewards come risks we must note, as usual. So, here’s what we need to know about Plata and its latest move.
From Credit Cards to Banking: Plata’s Evolution
Plata started in 2023 as a credit card issuer, focusing on Mexico’s underbanked population—a segment that makes up roughly 60% of the country’s 130 million people. By December 2024, Plata secured a banking license from Mexican regulators, a game-changer that allows it to issue loans directly from its balance sheet and, starting in 2026, accept deposits upon meeting specific conditions. The change has undoubtedly expanded the company's scope of activity and its revenue potential.
The company’s flagship product, the Plata Card, offers an average credit limit of $10,000 at interest rates exceeding 30%, targeting small loans averaging $200 per customer. With 1.5 million cardholders by mid-2025, Plata has built a diversified portfolio designed to be manageable for its target market. Backed by $450 million in equity financing, including a hefty 70% stake from Baring Fintech Private Equity Americas Fund, Plata also boasts a management team with roots from Tinkoff Bank—a fintech known for its innovative, customer-first approach. For a more convenient analogy, this business model is very similar to that used by the American bank Capital One NYSE:COF , allowing customers to manage their finances entirely through digital channels, from opening an account to investing, without visiting branches. Most services are digitally oriented.
The Bond Offering: Terms and Appeal
Plata’s bond issuance introduces a three-year, senior unsecured note featuring a callable structure, designed to stimulate its growth ambitions while offering investors a compelling opportunity. The offering begins at $120 million, with the flexibility to expand to $200 million, indicating confidence in its market reception. The bond carries a tenor of three years, with call options kicking in after 18 months at 106% of par value, gradually declining to 101% near maturity, signaling the issuer’s optimism about achieving early repayment as the business scales. Initially marketed with a 16% coupon rate, investor demand briefly pushed expectations toward 12%, though the final rate is anticipated to stabilize between 15% and 16%, paid semi-annually, which underlines the bond’s high yield potential, stemming from Mexico’s emerging market dynamics and Plata’s nascent stage. A put option further enhances its appeal, allowing bondholders to exit at 101% if a change of control occurs, providing a safety net against ownership uncertainties. While this structure attracts yield-hungry investors, liquidity poses a challenge, as the minimum trading lot of $125,000 and settlement through a Norwegian central securities depository—linked to Euroclear via Scandinavian banks—may restrict secondary market activity.
Financial Snapshot: Growth at a Cost
Plata’s financials reflect the classic fintech tradeoff: heavy upfront investment for long-term gains. The company has burned through $260 million of its $450 million equity raise over three years, a planned cash burn to fuel customer acquisition and technology development. Despite this, Plata’s loan portfolio yields a net contribution margin of around 2%, and it’s on track to break even by Q2 2028.
Credit quality is improving, too. In June 2023, 33% of new cardholders defaulted after their first payment—a steep learning curve. By 2025, sharper underwriting has slashed non-performing loans (NPLs) to 15%, a manageable level given the 70% gross yield on its products. With an equity ratio projected at 22%, Plata’s capital cushion looks robust for a growth-stage bank.
Mexico’s Underbanked Opportunity
Mexico’s banking sector is ripe for disruption. Traditional banks have been slow to serve the underbanked, leaving room for digital players like Plata to step in. Leveraging an app-only platform and rapid credit card delivery, Plata follows successful footsteps of Tinkoff’s or the more well-known Capital One model, adapted for Mexico’s unique market. The company’s IT backbone, partly based in Cyprus at the upscale Trinity building, underscores its tech-driven approach. The company’s IT backbone, partly based in Cyprus at the upscale Trinity building, underscores its tech-driven approach.
Competition is intensifying, with established banks and other fintechs vying for the same customers. Yet Plata’s early traction—1.5 million users in two years—and its focus on small, accessible loans give it an edge. If it can scale while keeping NPLs in check, Plata could capture a sizable slice of this underserved market.
Risks to Watch
The allure of high yields comes with significant uncertainties, given Plata’s short operational history and heavy reliance on rapid expansion. The company faces potential threats from Mexico’s economic volatility, where currency fluctuations and macroeconomic instability could erode profitability, alongside the risk of regulatory shifts in banking or fintech that might upend its business model. Credit risk remains a concern, as a surge in possible defaults could pressure its balance sheet despite recent improvements in loan performance, while the bond’s modest $120 million size and reliance on a Norwegian depository could deter some investors and limit liquidity in the secondary market. Nevertheless, Plata’s credibility is bolstered by its backers at Baring Fintech, a firm with a successful track record supporting companies like Kaspi NASDAQ:KSPI and Revolut, which lends a degree of reassurance. Additionally, the bond’s flexible structure, with call and put options, helps mitigate some of these risks, offering both the issuer and investors strategic adaptability in navigating this high-stakes venture.
The Verdict: A High-Yield Play with Caveats
Plata’s bond debut is a pretty well entry point into Mexico’s digital banking surge. A 15-16% yield is hard to ignore, especially with a clear path to profitability and strong equity support. For investors comfortable with emerging market risk, it’s an opportunity to support a fintech with it big digital potential in a market begging for innovation.
But look first, then leap as some say. Thin liquidity and credit uncertainties mean this isn’t a casual investment. Those considering it should weigh the upside—growth in an underbanked hotspot—against the downside of a young bank in a volatile region. For the right portfolio, Plata’s bonds could be a calculated win. Just don’t expect a smooth ride.

TIA Scalp trade setupwait for the retest of breakout, set sl & tp. While on swing trade will long below 1.31 and tp 2.0$, TIA is extremely oversold, So less affected by BTC.

BTC: Price to 134,500$ , FVG, Fib 0.5 and 0.618 ratio ?Price to 134,500$:
Bitcoin is now moving in a triangle pattern, which is getting smaller. The price is around $107,758. Here is possible move is a breakout to the downside first, where the price may drop to fill the "Fair Value Gap" area, which is marked in purple. This area is between the Fibonacci levels of 0.5 and 0.618. After that, Bitcoin could go up again and reach the price of $134,000.
Trade Ideas:
I marked 2 areas with arrow let the price reach here and wait for confirmation in both areas. Specially in Fair Value Gap area.
Trade Signal:
I will provide both trade signal here so follow my account and you can check my previous analysis regarding BITCOIN. So don't miss trade opportunity so follow must.
BINANCE:BTCUSDT BITSTAMP:BTCUSD COINBASE:BTCUSD COINBASE:BTCUSD BINANCE:BTCUSDT.P CRYPTO:BTCUSD BYBIT:BTCUSDT.P BINANCE:BTCUSD

CADCHF - BEARISH - QUANT-LEVEL FX LISTDaily: Downtrend
H4: Downtrend
H1: Downtrend
m15: Downtrend
Risk of Entering Now: Better Zone a little higher
Target at least previous day low
tg@darksheeptrades
