AUDCAD Bullish week AUDCAD Bullish Confluence Analysis:
1. Daily Timeframe: Bullish daily candle closed after sweeping the previous day’s sell-side liquidity — indicating a strong rejection and potential shift in momentum.
2. 4H Structure: Price closed decisively above the key support/resistance level at 0.89300, confirming a break and potential continuation.
3. Daily Imbalance: A breakaway fair value gap (FVG) remains unfilled, with buyers showing strong intent by driving price higher — suggesting bullish pressure is still active.
4. Intraday Confirmation: Both 1H and 15M charts show breaker blocks and fair value gaps being filled, aligning with bullish targets and providing refined 15 min entry zone.
Supply and Demand

The Big Beautiful RXTWith the bill passing and TA indicators popping up. I see these long term channels starting to break and the entire price action start to flip to the other side.
Watch the break and retest, especially if we see a spike in volume soon.
Really hard to lose long term with this one.

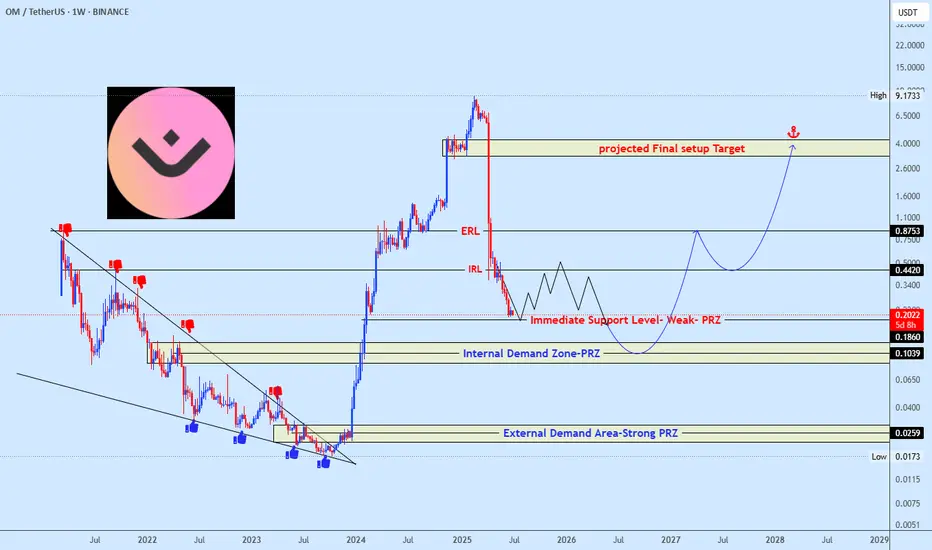
OMUSDT Approaching Demand ZonesOMUSDT has seen a sharp decline from its peak and is now approaching key demand zones. Price is reacting around a weak support level, with further downside likely toward the Internal PRZ (around $0.1039) and at this zone major reversal should happen unless if unexpected happen then the next area to keep an eye on is the External Strong PRZ (near $0.0259) which is mostly unlikely.
A strong bullish structure could form from these zones, targeting a long-term recovery toward $0.44, $0.87, and ultimately the $4.00 which serves as projected final setup target zone.
Watch price behavior closely at these levels for early signs of reversal.
We spotted the previous falling wedge setup accurately and this time will not be difference, make sure not to miss the opportunity when the price reaches the projected zone.
The price will drop to at least $230The price will drop to at least $230. after that can goes to $200. but i have to re-check at $230
If you are thinking of investing, this is not a good place to buy at all.
I recommend entering in the $200 range after getting the necessary confirmations.
If you would like to follow me to see the rest of my analysis.

SMCI Long Swing Setup – Positioned for AI-Driven Infrastructure Super Micro Computer, Inc. NASDAQ:SMCI is a critical player in the AI infrastructure boom, supplying high-performance servers to NVIDIA, AMD, and major data centers. With accelerating demand for compute power, SMCI is well-positioned for continued upside.
📌 Trade Setup:
• Entry Zone: Current market price or $40 – $43 support zone
• Take Profit Targets:
o 🥇 $70
o 🥈 $100
o 🥉 $120
• Stop Loss: Weekly close below $30

AUDJPY: Bullish Move From Support 🇦🇺🇯🇵
There is a high chance that AUDJPY will bounce
from the underlined horizontal support.
The price formed a bullish imbalance candle after its test.
I expect a rise to 94.49 level.
❤️Please, support my work with like, thank you!❤️
I am part of Trade Nation's Influencer program and receive a monthly fee for using their TradingView charts in my analysis.

Top of channel, weekly levelIREN is on a rocket ship right now
Top of channel lining up with this old weekly level, though,
I won't be thinking of a short unless we get a strong rejection, though; it could easily blast through the way it's been blasting through everything else.

if u seen previous idea am sure u are eating some pips so don't worry try joining buyers till those targets
any
way
not financial advice

SOL/USDT Scalping Setup – 1H Reversal from Demand with FibonacciMarket Context:
Solana has pulled back into a key short-term demand zone after a sharp rejection from recent highs. Price action is now showing signs of local exhaustion, with confluence from lower timeframe support and bullish structure attempting to form. The setup anticipates a bounce targeting the mid-Fibonacci zone.
Setup Idea:
Price tapped into a local support shelf around 148.80, where previous demand initiated the last impulsive leg up. With momentum indicators stretched and RSI divergence building, this offers a high-probability scalp opportunity.
Targeting the 0.5–0.618 Fibonacci retracement zone as first resistance, with confirmation needed for further continuation.
Trade Plan:
Entry: Around 148.80–149.00
Stop Loss: Below 148.30 (beneath local swing low and structure break)
Target: 154.50–155.90 (Fibonacci 0.5 to 0.618 zone)
Risk/Reward: Approx. 2.5R
Notes:
This is a reactive setup — price must hold the current level or print a higher low. If sellers regain control below 148.30, the trade is invalidated. Watch closely for volume shift and 1H candle confirmation before adding size.
Mid-Fibonacci level (154.57) is a logical area to de-risk or take partial profits.

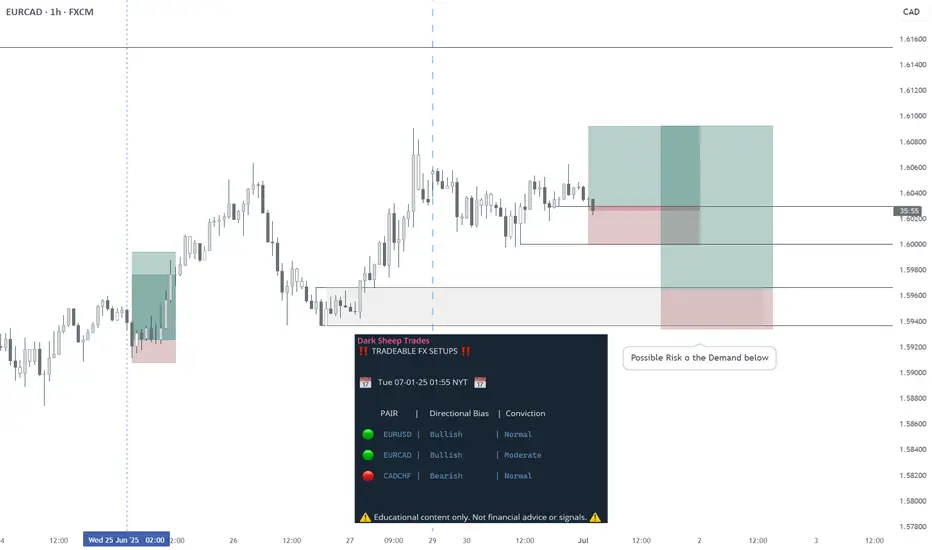
EURCAD - LONG - Statistically-backed FX shortlistEURCAD - LONG
Daily Outlook: Statistically-backed FX shortlist
@darksheeptrades
#XAUUSD:First Buy, Then Sell Swing! Big Move In Making! Gold failed to decline further as previously predicted in our analysis. Instead, it continues to exhibit bullish sentiment. The current price trading in a critical region between 3350 and 3360, where significant resistance is observed. We anticipate that the price must pass through this region before it can clearly surpass the 3400 mark.
When this occurs, it is advisable to implement precise risk management strategies while trading gold due to its volatile nature. Additionally, the DXY index is experiencing a decline and currently trading at its all-time low since 1976. This development will likely have a substantial impact on the gold price.
We wish you the best of luck and ensure safe trading practices.
Kindly consider liking, commenting, and sharing this idea.
Team Setupsfx_
❤️🚀

#XAUUSD(GOLD)): 29/06/2025 Last Analysis Going Great!Gold has been moving nicely since our last analysis, which we posted. Currently, 750+ pips have been generated, and we expect further price drops. There are still two targets in place, as per our previous analysis. We anticipate a steady decline in the price. We recommend all of you to follow strict risk management. This is not a guaranteed analysis or view, but rather an overview/educational chart analysis.
If you want to support us, you can do the following:
- Like
- Comment
- Share
Team Setupsfx_

SHORT ON BITCOINBITCOIN has continue to create lower highs at a major resistance zone.
I will be selling bitcoin looking to make over 8000 to 20,000 points.

XAU/USD – Testing 2H/1H Supply Zone | Breakout or Rejection?XAU/USD – Testing 1H/2H Supply Zone | Bullish Continuation or Rejection Ahead
Gold has rallied strongly from the support zone around 3,238–3,255, breaking multiple intraday resistance levels and now approaching a critical 1H/2H Supply Zone near 3,348–3,366.
This area previously acted as a strong sell-off zone, making it a key decision point.
Scenario 1: Bullish Continuation
If price breaks and closes above 3,366 with momentum, we could see further upside toward the next resistance at 3,400 and possibly retest the ATH zone at 3,486. A short consolidation or retest within the zone would confirm strength.
Scenario 2: Rejection from Supply Zone
If the supply holds, a rejection from the zone could lead to a pullback toward:
3,320.48 (minor support)
3,297.08 (support line)
Or deeper retracement to the 3,255–3,238 support zone
Key Technical Levels
Supply Zone: 3,348 – 3,366
Resistance: 3,400 – 3,486 (ATH)
Support Levels: 3,320 – 3,297 – 3,255 – 3,238
Pivot Line: 3,348

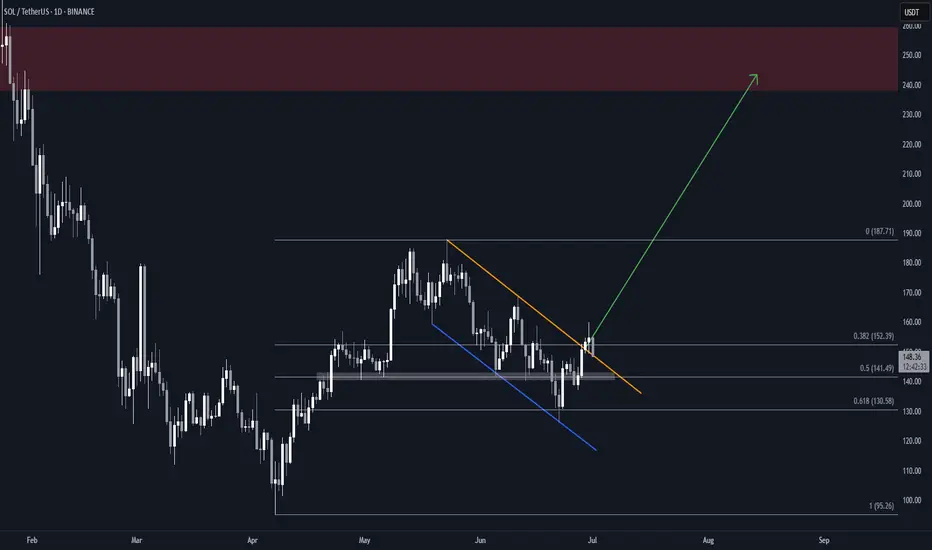
Solana (SOL) Flag & Pole Breakout (1D)BINANCE:SOLUSDT broke out of a textbook falling wedge two days ago, and is now retesting the former resistance as support.
Key Technicals
• Falling channel with clean structure and multiple touches
• Resistance trendline broken
• Price now retesting the breakout zone (~$148)
• Overhead supply zone at $238–$260
• Measured Target: $240, within supply
Why This Setup Matters
• Clear breakout followed by a retest, which can often precede the next leg up if support holds
• Falling channel retracement aligns with 0.618 Fib, a common reversal area
What to Watch
• Daily close above the previous resistance trendline
• Push above the local $160 high for full confirmation
EURJPY Follow Ascending channel bullish possible from support📈 EURJPY Technical Outlook – 4H Timeframe
EURJPY continues to respect the ascending channel, showing bullish momentum from the 168.100 support level.
🎯 Technical Targets:
1st Target: 169.700 – Key Supply Zone
2nd Target: 170.800 – Next Major Resistance
As long as price holds above 168.100, buyers remain in control.
🚨 Watch for potential reactions near these supply zones.
✨ Like, follow, comment, and join us for more premium updates and trade ideas!
— Livia 😜

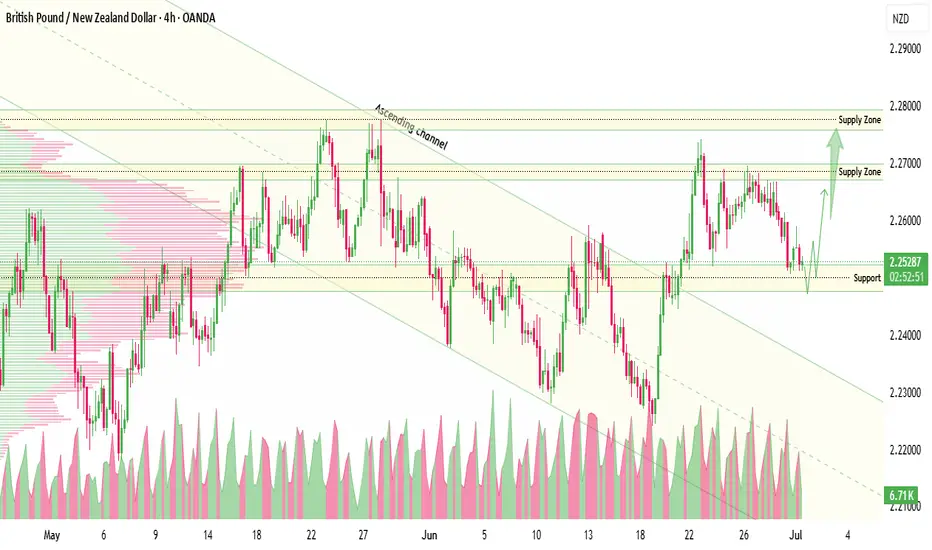
GBPNZD channel breakout buy possible from support📈GBPNZD Breakout Alert!
The pair has officially broken out of the ascending channel and bounced from key support at 2.25100 — confirming bullish momentum on the 4H timeframe!
🎯 Technical Targets:
1️⃣ First Target: 2.27000 – major supply zone
2️⃣ Second Target: 2.28000 – next resistance/supply area
This breakout setup is showing strong potential—watch price action near the targets and manage risk accordingly.
🧠 Trade smart. Stay sharp.
👇 Like, follow, and comment if you're riding this move!
📲 Join us for more real-time trade setups and updates.
🔥 Hashtags / Caption for “For You” strategy:
#ForexBreakout #GBPNZD #PriceAction #4HSetup #SmartMoney #FXTrades #ForYou #foryoupage #fyptrading #forexsetup #liviasetups 😜
Nifty levels - Jul 02, 2025Nifty support and resistance levels are valuable tools for making informed trading decisions, specifically when combined with the analysis of 5-minute timeframe candlesticks and VWAP. By closely monitoring these levels and observing the price movements within this timeframe, traders can enhance the accuracy of their entry and exit points. It is important to bear in mind that support and resistance levels are not fixed, and they can change over time as market conditions evolve.
The dashed lines on the chart indicate the reaction levels, serving as additional points of significance to consider. Furthermore, take note of the response at the levels of the High, Low, and Close values from the day prior.
We hope you find this information beneficial in your trading endeavors.
* If you found the idea appealing, kindly tap the Boost icon located below the chart. We encourage you to share your thoughts and comments regarding it.
Wishing you success in your trading activities!

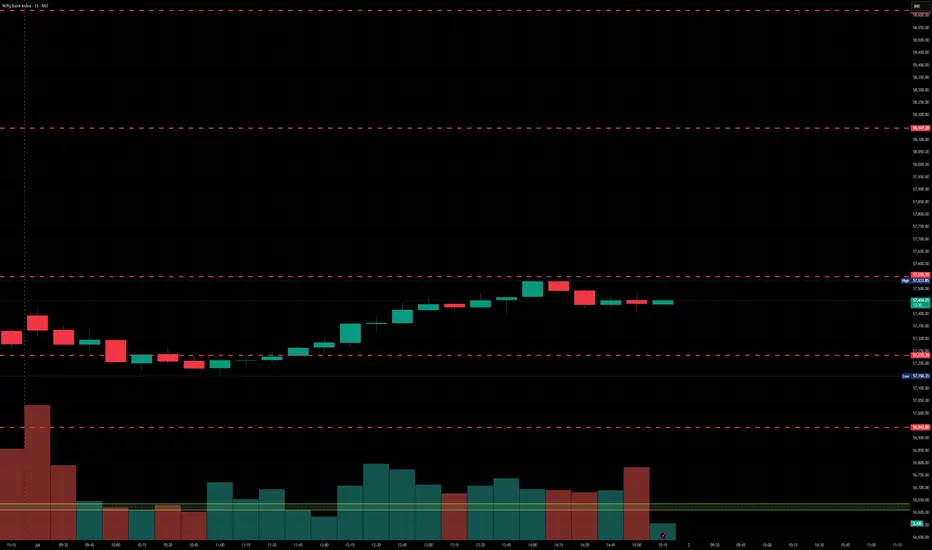
BankNifty levels - Jul 02, 2025Utilizing the support and resistance levels of BankNifty, along with the 5-minute timeframe candlesticks and VWAP, can enhance the precision of trade entries and exits on or near these levels. It is crucial to recognize that these levels are not static, and they undergo alterations as market dynamics evolve.
The dashed lines on the chart indicate the reaction levels, serving as additional points of significance. Furthermore, take note of the response at the levels of the High, Low, and Close values from the day prior.
We trust that this information proves valuable to you.
* If you found the idea appealing, kindly tap the Boost icon located below the chart. We encourage you to share your thoughts and comments regarding it.
Wishing you successful trading endeavors!
AUDUSD Breakout ascending channel and consolidation breakout 1D 📊 AUD/USD Technical Breakdown – 1D Time Frame
The Aussie has officially broken out of both the ascending channel and the consolidation phase, signaling strong momentum ahead. 🚀
📍 Entry Level: 0.65800
🔁 Possible Retest Zone (Support): 0.64000
🎯 Technical Targets:
✅ 1st Target: 0.66900 (Key Supply Zone)
✅ 2nd Target: 0.69000 (Major Resistance Level)
Market structure and price action suggest bullish continuation if the breakout holds. Always manage risk accordingly. 📈
---
💬 Drop your thoughts below
❤️ Like, 🔄 Follow, and 👥 Join us for more real-time updates and smart setups!
— Livia, keeping it sharp 😜

CADCHF - SHORT - Statistically-backed FX shortlistCADCHF - SHORT
Daily Outlook - Statistically-backed FX shortlist
@darksheeptrades

USDJPY Ascending channel breakout buy strong from demand zone📈 USDJPY Bullish Breakout Alert! 🚀
USDJPY has officially broken out of the descending channel from the 143.800 demand zone — showing strong bullish momentum on the 1H time frame! 🔥
🎯 Technical Targets:
1st Target: 145.000 – Supply Zone 💥
2nd Target: 146.000 – Key Resistance
3rd Target: 148.000 – Major Resistance Level
Momentum is building — bulls are in control! 🐂
👇 Like, Follow & Comment your thoughts below!
💬 Join our trading community for more real-time updates and analysis!
#USDJPY #ForexSignals #PriceAction #BreakoutTrade
#LiviaTrades 😜

EURUSD Selling from Resistance at 1.17500 EURUSD Analysis –
4H Timeframe
The pair continues to respect its ascending channel, but current price action suggests a potential sell opportunity from the 1.17500 resistance zone.
🎯 Technical Targets:
🔻 1st Target – 1.16000 (Key demand zone)
🔻 2nd Target – 1.14500 (Deeper support area)
🔻 3rd Target – 1.12500 (Bullish Order Block)
💡 Watch for confirmation signals near resistance before entering shorts.
💬 Like, follow, comment, and join us for more real-time trade ideas and updates!
📲 Let’s grow and trade smart together 💼✨
— Livia 😜
