ARTY Launch: Play-and-Earn goes live June 30KUCOIN:ARTYUSDT Artyfact (ARTY) is approaching a major milestone, with its Play-and-Earn platform scheduled to launch on June 30. In anticipation, the token is already showing signs of strength, trading around $0.188 and gaining upward momentum. This move comes off a clear technical structure: a double-bottom reversal followed by a breakout above the descending trendline.
Price action is beginning to confirm the shift in sentiment as the official Play-and-Earn tournament kickoff draws near. With just days left until June 30, anticipation is building as the launch will mark a real turning point. Until then, the current pre-launch sentiment continues to lean optimistic, driven by growing community engagement, strong social media traction, and increasing excitement around what Artyfact is building.
The anticipation surrounding the June 30 launch could be creating strong momentum, as traders and early supporters position themselves ahead of what could be a key moment for the project.
From a broader market perspective, Bitcoin continues to lead the risk-on rotation. BTCUSD recently had an aggressive bullish rally and is poised to maintain upward momentum if macro conditions remain favorable.
Historically, Bitcoin strength has preceded major capital inflows into small-cap altcoins. As BTC resumes its bullish trajectory toward the $110,000 zone, it provides ideal conditions for undervalued projects to reprice aggressively. The rotation effect tends to flow from BTC → ETH → high-utility altcoins and ARTY is positioned to benefit from this dynamic.
Fundamentally, ARTY is deeply undervalued relative to its potential.
Low market cap: A micro-cap with asymmetric upside.
80%+ of total supply is in circulation, reducing inflation risk and encouraging organic demand.
Holder base is expanding, reflecting early-stage adoption and network growth.
Major catalysts ahead:
🎮 Launches on PlayStation, Xbox
📱 Releases on AppStore and Google Play
🧩 NFT integration and metaverse gameplay expansion
These milestones could drive exponential user growth, attracting both gamers and crypto enthusiasts to the ecosystem. When combined with the convergence of technical bottoming, bullish macro conditions, and strong fundamental catalysts, the setup supports the potential for a sustained move toward the $1.00 zone as momentum builds post-launch.
Traders should monitor for confirmation:
-Higher low formations
-Expansion in bullish volume
-Strong closes above interim resistances
With BTC strengthening and capital rotating down the risk curve, early entries in fundamentally sound projects like ARTY offer high risk-reward profiles.
Supply and Demand

Whales Dump on Wall Street, Fueling Bitcoin's 'Inevitable' SurgeIn the high-stakes world of cryptocurrency, where fortunes are made and lost in the blink of an eye, a new narrative is taking shape. With Bitcoin's price hypothetically hovering around a robust $107,000, a significant portion of market analysis now suggests that a new all-time high is not just a possibility, but an inevitability. This confidence stems from a complex interplay of technical strength, unprecedented institutional demand, and a massive, yet healthy, transfer of wealth from early adopters to the new titans of finance.
The market is currently witnessing a fascinating dynamic: while the price consolidates above the monumental $100,000 psychological barrier, long-term holders, often referred to as "OG whales," are systematically selling their holdings. This activity, which could be misconstrued as bearish, is being interpreted by many as a necessary and constructive phase. Instead of suppressing the price, this distribution is meeting a voracious appetite from Wall Street, primarily through the mechanism of spot Bitcoin Exchange-Traded Funds (ETFs). This creates a state of equilibrium, a period of sideways consolidation where the market digests enormous gains and builds a foundation for its next explosive move. The target on the horizon is a liquidity cluster around $109,000, a key level that, if decisively flipped to support, could unlock a path to uncharted territory.
This article will delve into the multifaceted dynamics of this hypothetical market scenario. It will explore the significance of consolidating above $100,000, dissect the "great transfer" of Bitcoin from early believers to institutional giants, and analyze the technical and on-chain metrics pointing toward an imminent breakout. Finally, it will consider the potential risks and counterarguments that could challenge the prevailing bullish thesis, providing a comprehensive overview of a market at a pivotal crossroads.
Part 1: The New Paradigm - Consolidating Above $100,000
The act of breaking and holding a price level as significant as $100,000 represents more than just a numerical achievement; it is a profound psychological and structural shift for Bitcoin. In this hypothetical scenario, the market is not just visiting this level but is actively building a base above it, a process known as consolidation. This phase is crucial, characterized by sideways price movement within a defined range, often accompanied by decreasing trading volume, as the market takes a collective breath and establishes a new sense of fair value.
The Psychology of a Six-Figure Asset
For years, $100,000 was a distant, almost mythical target for Bitcoin. Surpassing and, more importantly, sustaining this level transforms market perception. It solidifies Bitcoin's status as a mature, global macro asset, moving it further away from its speculative past. This psychological victory attracts a new wave of capital from more conservative investors, wealth funds, and corporations who may have been hesitant to enter before such a milestone was reached. The consolidation phase above this level acts as a proof of stability, demonstrating that the asset can absorb significant profit-taking without collapsing, thereby building trust and confidence for the next wave of adoption.
Market Structure and Institutional Support
This period of stability is not happening in a vacuum. It is underpinned by a fundamental change in market structure, primarily the advent and overwhelming success of spot Bitcoin ETFs. These regulated financial products have provided a seamless bridge for Wall Street to pour billions of dollars into Bitcoin, creating a formidable wall of buy-side demand. In this scenario, where Bitcoin oscillates between $102,000 and $110,000, spot ETFs would be consistently recording massive net inflows, absorbing the supply being offered by sellers.
This dynamic is a textbook example of healthy consolidation. It is a tug-of-war where the immense selling pressure from profit-takers is effectively matched by the persistent buying pressure from new institutional entrants. This prevents a sharp price decline and allows the market to methodically transfer coins from one cohort to another without inducing panic. Technically, this phase often forms recognizable patterns like sideways ranges, bullish flags, or ascending triangles, all of which suggest that pressure is building for an eventual breakout to the upside. The decreasing volume during this time indicates that the market is reaching an equilibrium before the next major directional move.
Historical Precedent in a New Era
Bitcoin has experienced consolidation phases after breaking previous major milestones, such as $1,000 and $20,000. However, the current hypothetical consolidation above $100,000 is fundamentally different in both scale and participants. Previous cycles were largely driven by retail investors and a smaller group of early adopters. The current cycle is defined by the heavyweight presence of institutional players who bring not only massive capital but also a long-term strategic investment horizon.
The amount of capital required to absorb selling pressure at a six-figure price point is orders of magnitude greater than in any previous cycle. The fact that the market can achieve this stability highlights the depth and maturity it has developed. While past consolidations were precursors to further retail-driven mania, the current phase is about the systematic absorption of early investor supply by the largest financial institutions in the world, setting the stage for a rally built on a much stronger and more diverse foundation. This isn't just a pause; it's the construction of a launchpad for the next chapter in Bitcoin's story.
Part 2: The "Great Transfer" - Long-Term Holders vs. Wall Street
At the heart of the market's current dynamic is a historic transfer of wealth. This is the moment where the earliest and most steadfast believers in Bitcoin, the "OG Whales" or Long-Term Holders (LTHs), are realizing their life-changing gains by selling to the new behemoths of the financial world: Wall Street institutions. This process is not the bearish signal it might imply, but rather a critical market function that fuels the bull run's continuation.
Defining the Players: "OG Whales" and Long-Term Holders
Long-Term Holders (LTHs) are typically defined in on-chain analysis as addresses that have held their Bitcoin for more than 155 days (approximately five months). These are investors who have weathered significant volatility and have a deep conviction in the asset. "OG Whales" are a subset of this group, representing individuals or entities who accumulated vast amounts of Bitcoin in its nascent stages, often at prices of three figures or less. For them, selling at over $100,000 represents astronomical returns on their initial investment.
Their motivation to sell is rational and expected. It is a common market pattern for patient bottom buyers to take profits as the market approaches and surpasses new all-time highs. They understand that the euphoria surrounding these record prices is what attracts the necessary buy-side demand to absorb their large sell orders. This selling, or "distribution," is a hallmark of every Bitcoin bull market peak. The key question is whether the demand is strong enough to absorb this supply without crashing the price.
Deconstructing the "Dumping on Wall Street" Narrative
The essence of this transfer is that since the launch of spot Bitcoin ETFs, LTHs have been the primary source of selling pressure. They are, in effect, providing the liquidity that the newly launched ETFs require to meet the relentless demand from their clients.
This dynamic is precisely why the price has been able to stabilize at such high levels. The institutional buying frenzy is absorbing the supply unloaded by LTHs. This is not a malicious act of suppression but a symbiotic relationship: LTHs need massive buyers to sell to, and Wall Street needs massive sellers to source coins from. This is simply the natural ebb and flow of a market cycle where supply and demand are meeting at a new, higher equilibrium.
On-Chain Evidence of a Healthy Distribution
Several on-chain metrics provide a clear window into this phenomenon, confirming that the current selling is a sign of a healthy bull market, not an impending top.
• Spent Output Profit Ratio (SOPR): This metric shows the degree of realized profit for all coins moved on-chain. In this scenario, the LTH-SOPR would be extremely high, indicating that the coins being sold were acquired at a much lower cost basis and are now being sold for massive profits. While this signals profit-taking, it is typical of a bull market and, on its own, does not signal a top.
• Realized Profit: On-chain data would show a massive spike in realized profits, confirming that sellers are locking in gains. The market's ability to absorb these profits and continue consolidating is a sign of immense strength.
• Coin Days Destroyed (CDD) / Value Days Destroyed (VDD): These metrics measure the activity of older coins. A spike in VDD is synonymous with the LTH cohort spending their coins. This typically peaks shortly after breaking all-time highs because sellers need the liquidity that new buyers bring. The fact that this selling is being met with such strong institutional demand prevents it from turning into a bear market trigger.
• Long-Term Holder Supply: While some LTHs are selling, the overall supply held by this cohort may still be growing or stabilizing. This is because investors who bought six months prior are continuously "aging" into LTH status. This indicates that while the oldest hands are selling, a new generation of convicted holders is forming, providing a solid foundation for the market.
In essence, the "great transfer" is a feature, not a bug, of the current bull market. It is a sign of Bitcoin's maturation, where the asset is moving from the strong hands of early pioneers to the deep pockets of the global financial system. This process allows the market to de-risk, shed its over-leveraged players, and build a stronger base for what many believe is the inevitable next leg up.
Part 3: The Path to $109K and Beyond - Technical and Liquidity Analysis
With the market having established a strong foundation above $100,000, all eyes turn to the next key resistance levels. Technical and on-chain analysis points to a significant cluster of liquidity around the $109,000 mark, which is viewed as the final hurdle before Bitcoin can enter a new phase of price discovery. The argument for the "inevitability" of a new all-time high rests on a confluence of bullish technical patterns, resetting momentum indicators, and the overwhelming force of market liquidity.
Understanding Liquidity at $109,000
In financial markets, liquidity refers to the ease with which an asset can be bought or sold without causing a significant price change. On a price chart, liquidity is concentrated at levels with a high density of buy and sell orders. The area around $109,000 to $111,000 represents a major liquidity cluster. This is composed of:
• Sell Orders (Asks): A large number of investors who bought at lower prices have placed take-profit orders at this psychological and technical level.
• Short Position Liquidations: Traders who are betting against Bitcoin have placed their stop-losses above this resistance. If the price breaks through, these short positions are automatically closed with a buy order, creating a "short squeeze" that adds explosive fuel to the rally.
Analysis of order book data shows significant liquidation levels stacked just above this zone. Successfully breaking through and absorbing this sell-side liquidity would remove a significant barrier, clearing the path for a rapid move higher. A decisive flip of the $109,000 level from resistance to support is what bulls are watching for as the ultimate confirmation of upward momentum.
Bullish Technical Indicators
The consolidation phase has allowed Bitcoin's technical indicators to cool off and prepare for the next advance.
• Chart Patterns: On higher timeframes, the price action is forming classic bullish continuation patterns. There is potential for formations like an inverted head-and-shoulders pattern or a bullish engulfing candlestick, both of which have historically high success rates in predicting upward moves. A bullish engulfing pattern on the daily chart, for instance, has shown a high probability of leading to new local highs when appearing in a broader uptrend.
• Momentum Oscillators: Indicators like the Relative Strength Index (RSI) and the MACD (Moving Average Convergence Divergence) have likely reset from "overbought" conditions during the consolidation. This reset is healthy and necessary, allowing momentum to build again from a neutral base rather than an overheated one. It signals that the market has shed its speculative froth and is ready for a more sustainable trend.
• Moving Averages: Throughout the consolidation period, the price would find strong support at key moving averages, such as the 21-week exponential moving average (EMA) or the 50-day simple moving average (SMA). These levels act as dynamic support, with dip buyers consistently stepping in, reinforcing the strength of the underlying trend.
•
The "Inevitability" Thesis Synthesized
The argument that a new all-time high is "inevitable" is built on the convergence of these powerful forces:
1. Unprecedented Demand: The constant, price-agnostic inflows from spot Bitcoin ETFs provide a demand floor that the market has never experienced before.
2. Supply Absorption: The selling pressure from long-term holders, which would have crushed the market in previous cycles, is being successfully absorbed by this new institutional demand.
3. Healthy Reset: The market has undergone a healthy consolidation, allowing technicals to cool off, leverage to be flushed out, and a strong support base to be built.
4. Psychological Breakthrough: The conquest of the $100,000 level has fundamentally altered market perception and opened the door to price discovery, with the next logical target being the liquidity pool at $109,000.
While no outcome in financial markets is ever truly guaranteed, the confluence of persistent institutional buying, constructive on-chain dynamics, and bullish technical setups creates a powerful case that Bitcoin is coiling for a significant breakout. The move through $109,000 is seen not as a question of "if," but "when."
Part 4: Risks and Counterarguments
Despite the overwhelmingly bullish sentiment in this hypothetical scenario, a prudent analysis requires examining the potential risks and counterarguments that could challenge or delay the ascent to new all-time highs. The cryptocurrency market remains susceptible to a variety of internal and external shocks, and overconfidence can be a precursor to sharp corrections.
Macroeconomic Headwinds
Bitcoin's increasing integration into the global financial system means it is more sensitive to macroeconomic conditions than ever before. A sudden and severe global recession, an unexpected spike in inflation leading to aggressive monetary tightening by central banks, or major geopolitical conflicts could trigger a "risk-off" event across all asset classes, including Bitcoin. Investors might flee to the perceived safety of cash or government bonds, causing even the strong institutional demand for Bitcoin to waver. It is often noted that traders wait for clarity on key macroeconomic data and policy updates before committing to a trend, and any negative surprises could trigger a sell-off.
Overwhelming Profit-Taking
The thesis of a new all-time high hinges on the ability of institutional demand to absorb the selling from long-term holders. However, there is a risk that this supply could become too overwhelming. The profits held by early investors are immense, and there may be a price point—perhaps on the approach to $110,000 or just beyond—where profit-taking accelerates to a pace that even the ETFs cannot sustain. If a large cohort of whales decides to sell in unison, it could create a supply shock that temporarily breaks the market structure and forces a deeper correction.
Market Exhaustion and Valuation Metrics
While consolidation is healthy, a prolonged sideways period can sometimes signal exhaustion rather than accumulation. On-chain metrics that compare Bitcoin's market value to its realized value are crucial for gauging how overheated the market is. These tools help identify periods of extreme overvaluation. If such metrics were to enter their highest zones, it would suggest that the market is reaching peak froth, making it vulnerable to a sharp reversal, regardless of the positive narrative. It is understood that while Bitcoin's price has a strong correlation to global liquidity, internal market dynamics can cause it to decouple, especially during periods of extreme valuation.
Regulatory and Black Swan Risks
The risk of unforeseen "black swan" events always looms over the market. This could include a sudden and harsh regulatory crackdown in a major jurisdiction, the collapse of a major crypto exchange or institution, or the discovery of a critical flaw in the Bitcoin protocol itself. Furthermore, the concentration of Bitcoin within a few large ETF products, while providing demand, also introduces a new vector of risk. If these institutions were to face regulatory pressure or decide to offload their holdings for strategic reasons, the resulting sell pressure could be catastrophic.
In conclusion, while the path to a new all-time high appears clear and well-supported by current dynamics, it is by no means guaranteed. A combination of adverse macroeconomic shifts, overwhelming selling pressure, extreme valuations, or an unexpected black swan event could easily derail the bullish momentum. Investors and analysts must remain vigilant, balancing the optimistic on-chain and technical data with a realistic appreciation of the inherent risks in this volatile asset class.
Conclusion
The hypothetical scenario of Bitcoin consolidating above $100,000 while eyeing a breakout to $109,000 and beyond represents a pivotal moment in the asset's history. It paints a picture of a market that has achieved a new level of maturity, driven by a paradigm shift in its investor base. The central thesis—that a new all-time high is now "inevitable"—is not born from baseless hype, but from a powerful confluence of observable market forces.
The successful establishment of the six-figure price level as a support floor, rather than a speculative peak, is the first pillar of this argument. This consolidation is made possible by the voracious and sustained demand from Wall Street institutions, which are using spot Bitcoin ETFs to absorb the immense selling pressure from early adopters. This dynamic, the "great transfer" of Bitcoin from OG whales to institutional treasuries, is not a sign of a market top but a healthy and necessary distribution that de-risks the market and fuels the next leg of the bull run.
The on-chain analysis provides a framework for understanding this phase not as stagnation, but as a constructive consolidation where the market builds energy for a parabolic advance. This narrative is supported by bullish technical patterns, resetting momentum indicators, and a clear liquidity target at $109,000, which, once breached, could trigger a powerful short squeeze and propel Bitcoin into a new phase of price discovery.
However, this bullish outlook must be tempered with an awareness of the significant risks that remain. Macroeconomic instability, the sheer scale of potential profit-taking, and the ever-present threat of regulatory or black swan events could challenge the prevailing trend.
Ultimately, this analysis reveals a Bitcoin that is at a crossroads, but one where the path forward appears more clearly defined and well-supported than ever before. The interplay between the old guard of crypto and the new titans of finance is forging a stronger, more resilient market. While no outcome is certain, the evidence strongly suggests that Bitcoin is not at the end of its run, but is merely pausing to build a higher launchpad for its journey into the financial mainstream.

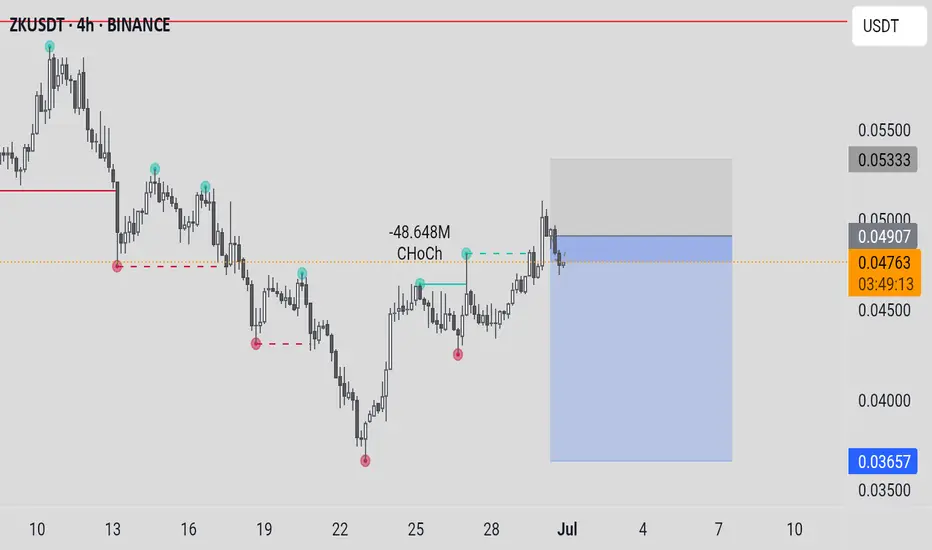
VETUSDTCryptocurrency Futures Market Disclaimer 🚨🚨🚨
Trading cryptocurrency futures involves high risks and is not suitable for all investors.
Cryptocurrency prices are highly volatile, which can lead to significant gains or losses in a short period.
Before engaging in crypto futures trading, consider your risk tolerance, experience, and financial situation.
Risk of Loss: You may lose more than your initial capital due to the leveraged nature of futures. You are fully responsible for any losses incurred.
Market Volatility: Crypto prices can fluctuate significantly due to factors such as market sentiment, regulations, or unforeseen events.
Leverage Risk: The use of leverage can amplify profits but also increases the risk of total loss.
Regulatory Uncertainty: Regulations related to cryptocurrencies vary by jurisdiction and may change, affecting the value or legality of trading.
Technical Risks: Platform disruptions, hacking, or technical issues may result in losses.
This information is not financial, investment, or trading advice. Consult a professional financial advisor before making decisions. We are not liable for any losses or damages arising from cryptocurrency futures trading.
Note: Ensure compliance with local regulations regarding cryptocurrency trading in your region.
thanks for like and follow @ydnldn
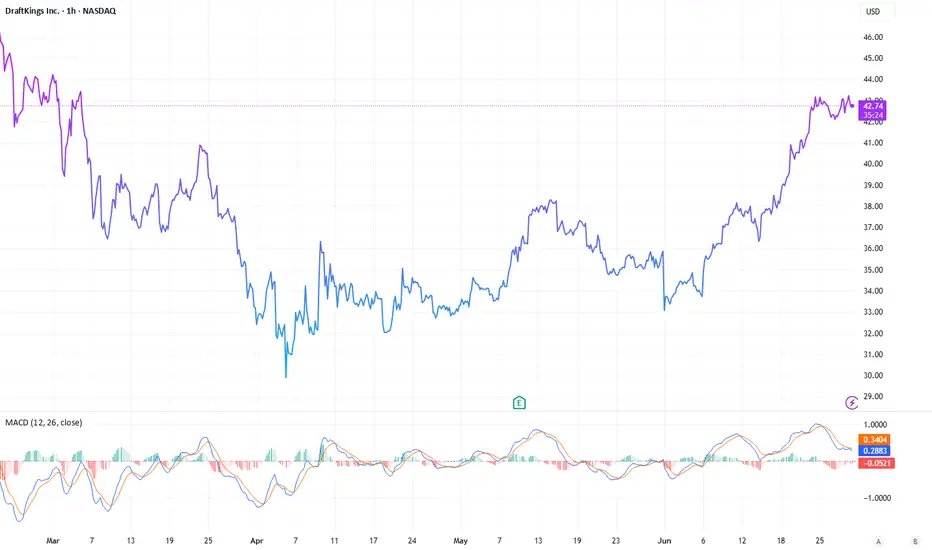
DraftKings & Evolution: Riding the Wave of Gambling GrowthNASDAQ:DKNG OMXSTO:EVO
The North American online gambling sector is experiencing a surge, with companies like DraftKings and Evolution emerging as standout performers. In the past month, Evolution’s stock rose an impressive 15%, while DraftKings continues to show strong potential in the sports betting arena. As legal licenses expand across U.S. states, this industry is poised for significant growth, outpacing traditional benchmarks like the S&P 500.
Market Momentum and Company Highlights
The online gambling market in North America is in a growth phase, largely due to the legalization of sports betting and casino operations. Evolution, a leader in online casino services, saw its stock climb to $41 as of June, with a market capitalization of $20.5 billion. Evolution's growth reflects the sector’s broader upward trend, bolstered by both stock appreciation and dividend payouts. DraftKings, meanwhile, dominates the sports betting space and is positioned as a future industry leader, capitalizing on the increasing availability of legal betting licenses.
The sector’s potential is fueled by untapped markets. Not all U.S. states have legalized gambling, meaning new licenses could significantly expand the user base. Analysts project a compound annual growth rate (CAGR) of 16.7% over the next 10–15 years, far exceeding the S&P 500’s historical average of 9.8% (or 6% adjusted for inflation since 1926). So, according to this growth trajectory, both companies could outperform broader market indices in the long term (by the way, we talked a lot about Evolution here):
Financial Performance and SBC Challenges
Despite their promise, both companies face financial challenges that investors should consider. DraftKings is currently unprofitable, with a net loss of $151 million over the last 12 months. The company is impacted by a substantial share-based compensation (SBC) expense of $550 million. SBC involves offering employees stock options or shares instead of cash to boost motivation. Such expense is recorded in profit and loss (P&L) statements as a "paper expense" without actual cash outflow. CrowdStrike is a similar case; excluding SBC would have turned a $400 million loss into a profit.
For DraftKings, this SBC-related drag has contributed to a recent dip in earnings per share. But the company is narrowing its losses, with accelerating revenue growth. Analysts anticipate a shift to positive net profit by late 2025 or early 2026, thanks to market share expansion. Evolution is also affected by SBC but benefits from a more established position, which supports its recent 15% stock gain and dividend payments.
Investment Appeal and Sector Dynamics
The growth potential of DraftKings and Evolution hinges on the evolving acceptance of gambling in North America. DraftKings is poised to lead in sports betting, while Evolution is set to dominate online casinos. The specialization reflects a market where younger generations are embracing regulated betting as a social activity. Let’s take as a little example two friends placing $2–3 bets on a game while watching at a bar. This cultural shift, coupled with legal expansions, underpins the sector’s robust outlook.
However, gambling’s stigma remains a consideration. Critics liken it to vices like alcohol or tobacco, but the industry counters that it targets controlled, recreational use rather than fostering addiction. With modern education and awareness—parents discussing gambling with children—the market is adapting to promote responsible engagement too, which may support long-term investment potential well.
Risks and Opportunities
Investing in DraftKings and Evolution carries risks, particularly the high SBC costs that inflate reported losses. Yet, this is offset by rapid revenue growth and a shrinking loss margin. The sector’s exclusion from major indices like the S&P 500 TVC:SPX limits institutional investment, making it a niche play for private investors or family offices. Isolation like this could drive outsized returns as demand grows from savvy individuals seeking undervalued opportunities.
Over the next decade, the 16.7% CAGR suggests significant upside. DraftKings’ leadership in sports betting and Evolution’s casino dominance position them to outpace the S&P 500. For investors willing to navigate SBC-related volatility and societal perceptions, these stocks offer a compelling long-term bet.
A Niche Opportunity Worth Watching
DraftKings and Evolution represent a dynamic corner of the North American market, with growth rates that dwarf traditional indices. While SBC challenges and limited institutional backing pose hurdles, their revenue momentum and expanding legal landscape signal strong potential. As of Evolution and DraftKings showing similar promise, these stocks are worth considering for those seeking high-growth, niche investments. Proceed with due diligence, as the sector’s evolution will continue to shape its financial story.
MSTR breakout time? NASDAQ:MSTR attempting to breakout of the channel on the 4th test, the high probability magic number!
Channel pattern target is 9% move to $426. The High Volume Node EQ at $438 is a more likely area of resistance if we get this love.
Safe trading

BTCUSDT Trade SetupBTC Still in sideways no major move, wait for the entries. While on weekly tf still expecting a final shakeout, 95-93k then a final leg up towards to 120k. For now wait for the entries to be filled first then must use sl.

THE KOG REPORT - UpdateEnd of day update from us here at KOG:
Not a bad start to the week with the path working well, we got the swoop we wanted and the opportunity for the long presented itself. We've completed quite a few of the bias targets as well as the red box targets, so now, with it being the last trading day of the month and quarter and tomorrow being the first, we'll take a back seat.
Support stands at the 3275 level with resistance still at 3404-6. Higher box is defence so we'll stick with it and see if it works how we intended.
KOG’s bias for the week:
Bullish above 3250 with targets above 3278✅, 3285✅, 3297 and above that 3306
Bearish below 3250 with targets below 3240, 3232, 3220 and below that 3212
RED BOX TARGETS:
Break above 3275 for 3279✅, 3285✅, 3289✅ and 3306 in extension of the move
Break below 3260 for 3255, 3251, 3240 and 3235 in extension of the move
As always, trade safe.
KOG

ethusdt no trade zoneETH is stuck in a range, wait for the sweep of range high, then closing below the range high and take the short, target weekly low. 2nd scenario is wait for to take out the weekly low and any daily candle closing failed to close below this level take the long entry and target the range high. Otherwise expecting this week choppy mean sideways. no major move. Will update if found any good trade.

BANKNIFTYBanknifty levels are based on imbalances
1. gapup 57700 long
2. 57700-57500 trade breakout
3. gapdown 57500 short

Internal and external liquidity Here's another mechanical lesson for you.
In my last post I covered a mechanical technique to identify swing ranges. Rule-based, simple and repeatable.
In this post, I want to share another little technique, again part of the mechanical series. But this time I want to talk about liquidity.
Most traders talk about liquidity, they might even have a grasp of what it is. But most do not know how liquidity forms the sentiment and how that creates a type of algo for the market.
You might have heard of Elliott wave theory. There is a saying along the lines of "you ask 10 Elliott traders for their count and you get 11 answers".
But the point is here, when you simplify the concept, it's clear to see that sentiment caused by liquidity swings is what causes a repeatable pattern in the market.
Let's take the idea of the ranges from my last post.
Now after a fair amount of accumulation, this level becomes "defended" - the price will gradually move up until old short stop losses are tagged and new long entries are entered into.
This allows the institutional players to open up their orders without setting off the alarm bells.
Price then comes back from external liquidity to find internal liquidity (more on this in a later post).
But then it looks for the next fresh highs.
As the highs are put in, we can use the range technique to move our range to the new area as seen in the image above.
Next we will be looking for an internal move, not just internal to the range, but a fractal move on the smaller timeframe that drives the pullback down. See this in blue.
The logic here is simple; on the smaller timeframes we have witnessed an accumulation at the 2 region and as we spike up for 3; we will witness a distribution on the smaller timeframes.
Wyckoff called this the accumulation, followed by a mark-up and then the distribution and a mark-down.
It is this pattern, over and over again that leads to this type of structure.
This will then be re-branded by various analysts who will call it things like a head and shoulders, smart money will see a change of character and a retest before breaking the structure.
This is all the same thing - just a different naming convention.
Again, I hope this helps some of you out there!
Disclaimer
This idea does not constitute as financial advice. It is for educational purposes only, our principal trader has over 25 years' experience in stocks, ETF's, and Forex. Hence each trade setup might have different hold times, entry or exit conditions, and will vary from the post/idea shared here. You can use the information from this post to make your own trading plan for the instrument discussed. Trading carries a risk; a high percentage of retail traders lose money. Please keep this in mind when entering any trade. Stay safe.

BTCUSDT:Sharing of the Latest Trading StrategyAll the trading signals last week have resulted in profits!!! Check it!!!👉👉👉
Bitcoin Technical Analysis (4-Hour Chart):
Price remains within an ascending channel. The MACD above the zero line with expanding red histograms indicates bullish dominance. After firmly breaking above the key resistance at $105,000, price is testing $110,000.
Caution: The RSI near 70 has entered overbought territory, increasing short-term pullback risks.
Support levels: $106,000 and $105,000.
Trading Recommendation for Aggressive Traders
Consider light long positions near $106,000 on pullbacks, with stop-loss set below $105,000.
Trading Strategy:
buy@105000-106000
TP:108000-110000

SHORT ON EUR/USDEUR/USD has a rising wedge within a consolidation zone.
The dollar looks like it will rise which will cause this pair to fall.
I will be selling EU looking to catch 150-300 pips this week.

GBPUSD PullbackGBPUSD is in an overall bullish market
However, after a large bullish push, I am expecting price to pullback (sell off).
Price met resistance a weekly supply zone and closed as an indecision candle on the Daily.
The lower blue EMA crossed below the higher RED EMA on the 1hr chart.
Expecting price to selloff and find support at the 50.0 Fib level which also correlates with a demand zone, before continuing the overall trend.

USOIL:Sharing of the Latest Trading StrategyAll the trading signals last week have resulted in profits!!! Check it!!!👉👉👉
Fundamental Analysis:
The ceasefire agreement between Israel and Iran has eased tensions in the Middle East, the primary factor behind the recent decline in oil prices. Meanwhile, market rumors suggest the U.S. may ease sanctions on Iran, which—if realized—would raise expectations of increased crude supply and further pressure oil prices.
Additionally, OPEC+ plans to continue increasing production by 411,000 barrels per day in July, with supply growth expectations exerting long-term downward pressure on oil.
Technical Analysis (4-Hour Chart):
USOIL prices have pulled back from highs and currently hover near $65.20, approaching the S2 pivot point at around $64.69 and the 4-hour 200-period moving average. The prior appearance of a long candlestick may signal short-term support.
Notwithstanding, the current market remains in a bearish trend, so the strategy prioritizes buying on rebounds.
Trading Strategy:
Sell@67-66
TP:65-64

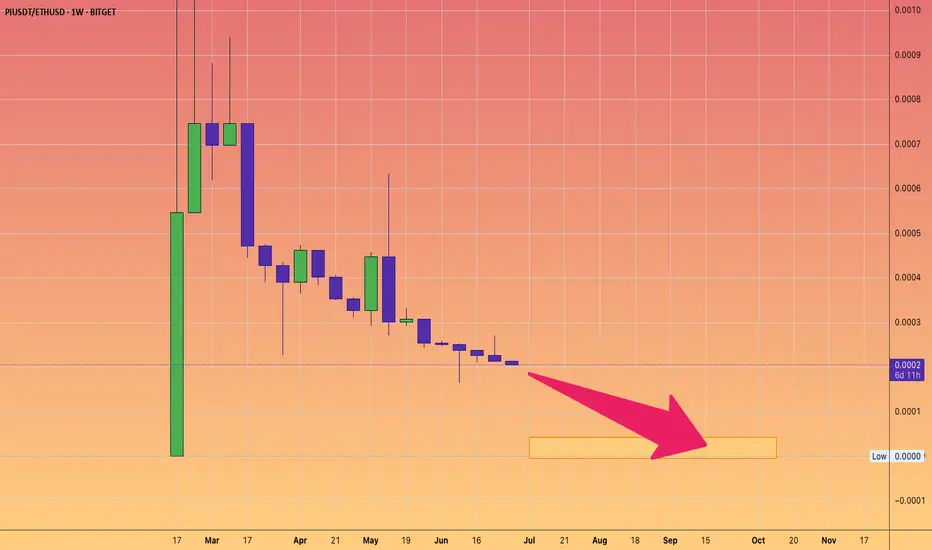
DON'T BUY Pi Network. It's a PUMP and DUMP.But feel free to short it if you desire.
This is Pi v ETH chart
It will continue it's trend to near ZERO.
Market makers will keep dumping into oblivion.
XAUUSD:Sharing of the Latest Trading StrategyAll the trading signals this week have resulted in profits!!! Check it!!!👉👉👉
Early Session Dynamics:
Gold rebounded in today’s early trading after finding support at the prior low of 3245, aligning with our weekly forecast. The intraday strategy prioritizes a low-level rebound correction, with short positions to be initiated at resistance levels.
Key Technical Levels:
Resistance: 3295–3308
Support: 3250–3240
4-Hour Chart Perspective:
The market remains weak with high volatility. The double-bottom effect at 3245 is unconfirmed, and no bottoming pattern has emerged. Thus, the week’s initial outlook is for a range-bound oscillation between 3308 and 3240:
A rebound opportunity exists as long as 3240 holds.
A break above 3308 could trigger upward momentum.
Intraday Trading Strategy:
Lacking follow-through in the European session, the short-term trend is viewed as range-bound
Sell@3305-3295
TP:3285-3250
buy@3250-3260
TP:3285-3300


EURUSDHello, I hope you have a good day ❤
Please don't forget to support us so that our activities can continue!🚀
The trend of the above times is completely upward and this move is not far from expected.
But since it is the first week of the new month, be sure to observe capital management.
Be profitable💲💎

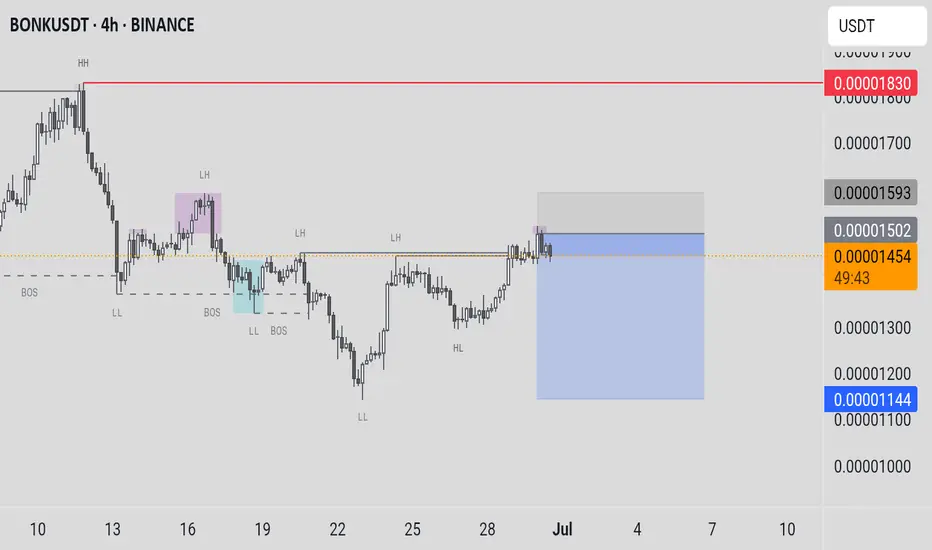
BONKUSDTCryptocurrency Futures Market Disclaimer 🚨🚨🚨
Trading cryptocurrency futures involves high risks and is not suitable for all investors.
Cryptocurrency prices are highly volatile, which can lead to significant gains or losses in a short period.
Before engaging in crypto futures trading, consider your risk tolerance, experience, and financial situation.
Risk of Loss: You may lose more than your initial capital due to the leveraged nature of futures. You are fully responsible for any losses incurred.
Market Volatility: Crypto prices can fluctuate significantly due to factors such as market sentiment, regulations, or unforeseen events.
Leverage Risk: The use of leverage can amplify profits but also increases the risk of total loss.
Regulatory Uncertainty: Regulations related to cryptocurrencies vary by jurisdiction and may change, affecting the value or legality of trading.
Technical Risks: Platform disruptions, hacking, or technical issues may result in losses.
This information is not financial, investment, or trading advice. Consult a professional financial advisor before making decisions. We are not liable for any losses or damages arising from cryptocurrency futures trading.
Note: Ensure compliance with local regulations regarding cryptocurrency trading in your region.
thanks for like and follow @ydnldn
GBPCHF: Strong Bearish SignalGBPCHF has been in a prolonged consolidation since mid-June, remaining within a significant horizontal range on the 4-hour chart.
Following the weekend market opening, the pair appears to be strongly bearish.
The violation of a support level within this range suggests the end of a bearish accumulation phase, creating potential for further upward movement, with the next resistance level to watch at 1.0889.

Gold sell setup H4Hello! Friends,
Greetings. Please leave a Like if you like the idea.
Before start talking about technical Let's share your LOVE by giving me LIKES to support this work. Thanks in advance.

SOL Ready To Breakout?SOL had a decent move this weekend overcoming descending resistance and now testing as support.
Price appears to have a completed a wave (2) at the .618 Fibonacci retracement and S1 daily pivot and a larger degree wave 2 at the channel bottom, High Volume Node support and .618 Fibonacci retracement.
If a wave (3) of 3 is underway then we should expect a strong move sooner rather than later with an initial target of the swing high resistance a/ R2 daily pivot $208-$216 range
Safe trading.

Bitcoin - Will Bitcoin Hit a New ATH?!Bitcoin is trading above the 50- and 200-EMAs on the four-hour time frame and is within its short-term descending channel. Bitcoin can be bought from the demand zone indicated. A break of the channel ceiling would pave the way for Bitcoin to rise to a new ATH.
It should be noted that there is a possibility of heavy fluctuations and shadows due to the movement of whales in the market and compliance with capital management in the cryptocurrency market will be more important. If the downward trend continues, we can buy within the demand range.
In recent days, Bitcoin has been trading in a range of around $107,000, and the market is going through a consolidation phase with complex but deeply fundamental characteristics. What matters at this point is not just the current price, but the precise mix of capital flows, the behavior of major players, on-chain data, and macroeconomic ratios that shape Bitcoin’s short- and medium-term trajectory. Overall, although Bitcoin’s rapid growth after the halving has stopped, internal market signals point to a continuation of the upward trajectory in a more stable framework.
The first important component is the significant influx of institutional capital into the market via ETFs. In the past week, according to CoinShares, more than $1.24 billion in new capital entered crypto products, with Bitcoin accounting for more than $1.1 billion. This marks the 10th consecutive week of capital inflows into the market, bringing the total inflows for 2025 to over $15 billion. Prominent ETFs such as BlackRock’s IBIT and Fidelity’s FBTC are attracting hundreds of Bitcoins per day, indicating steady institutional demand that has weathered the momentary volatility and is more focused on long-term asset building.
Alongside this capital inflow, the Onchain data also paints a mixed but highly interpretable picture. While the average active address rate has declined slightly and the MVRV (market value to realized value) has fallen from 2.29 to 2.20, these changes are more indicative of profit-taking by investors than selling pressure! In fact, rather than fear of a correction or crash, the market is witnessing a “gentle shift of ownership” between short-term and long-term holders. UTXO data also shows a roughly 5% increase in Bitcoin held for over 8 years, a strong sign of long-term accumulation and a decrease in the willingness to sell at current prices!
This can be seen as a period of supply and demand equilibrium; a period in which large investors have entered, but on the other hand, some older players are taking reasonable profits. This has led to a kind of price consolidation, which in June showed itself with only 2% growth—the weakest monthly growth since July last year. However, CoinDesk and Glassnode analysts rightly emphasize that this consolidation is not a sign of market weakness, but rather evidence of the maturity of Bitcoin’s price behavior. The price is reacting to data rather than becoming emotional.
From a macroeconomic perspective, Bitcoin remains highly sensitive to the Federal Reserve’s monetary policy, the value of the dollar, and interest rates. While the market is still waiting for interest rate cuts in the second half of the year, Bitcoin will remain in a quasi-expectant state until then, reacting to macro data, short-term and reactive. However, given that most ETFs follow long-term accumulation models, any stabilization in interest rates or easing geopolitical pressures could trigger a new wave of upside. Common analyst scenarios predict a range of $120,000-$130,000 for Bitcoin by the end of the summer if current conditions are maintained and capital inflows continue. In summary, Bitcoin is now at a stage where the dynamic combination of institutional accumulation, supply and demand balance, and on-chain data has transformed it from a purely risky asset into a strategic investment vehicle. The market has moved beyond the emotional phase and entered a phase of stability and maturity. This is a promising sign for long-term investors, provided that risk management is maintained and sensitivity to macro events is maintained. Bitcoin is preparing for the next stage of its rally—but unlike in the past, this time it is standing on the shoulders of fundamentals that are much stronger than at any time in the asset’s history.
ETFs with the most volume traded on Friday
Total: $501M
BlackRock: $153M
Fidelity: $165M
Grayscale: $0M
