NQ Power Range Report with FIB Ext - 6/30/2025 SessionCME_MINI:NQU2025
- PR High: 22842.50
- PR Low: 22751.50
- NZ Spread: 202.75
Key scheduled economic events:
09:45 | Chicago PMI
Weekend volatility taking auction into new ATHs
Session Open Stats (As of 12:45 AM 6/30)
- Session Open ATR: 345.85
- Volume: 33K
- Open Int: 261K
- Trend Grade: Neutral
- From BA ATH: +0.1% (Rounded)
Key Levels (Rounded - Think of these as ranges)
- Long: 23239
- Mid: 21525
- Short: 20383
Keep in mind this is not speculation or a prediction. Only a report of the Power Range with Fib extensions for target hunting. Do your DD! You determine your risk tolerance. You are fully capable of making your own decisions.
BA: Back Adjusted
BuZ/BeZ: Bull Zone / Bear Zone
NZ: Neutral Zone
Supply and Demand

USD/CAD 15-Minute Time Frame (15TF) Technical & Fundamental AnalUSD/CAD 15-Minute Time Frame (15TF) Technical & Fundamental Analysis
Last week, we highlighted potential bullish momentum building in USD/CAD. That narrative continues to develop, supported by the latest economic data.
The U.S. Core PCE Price Index came in at 0.2%, slightly higher than the previous 0.1%, indicating persistent inflationary pressure that could keep the USD supported. On the other hand, Canada’s GDP contracted by -0.1%, a significant drop from the previous 0.2% growth, weighing on the CAD.
Technical Outlook:
Following the price rejection near 1.37500, USD/CAD entered an accumulation phase around 1.3680–1.3690, signaling smart money building long positions.
After accumulating buy orders and sweeping liquidity below the key level at 1.36750, price has broken above a minor resistance zone, indicating bullish intent. A visible manipulation pattern within a liquidity pocket further supports this move.
We now anticipate a continuation higher from a key re-entry zone around recent breakout structure.
📊 Trade Setup
📍 Area of Interest (AOI): 1.36770 (Buy Limit Order)
🛡 Stop-Loss: 1.36570 (Below liquidity zone)
🎯 Take Profit: 1.37280 (Next key resistance / ~1:2.5 RR)
This trade aligns with institutional behavior — accumulation, liquidity grab, and break of structure — suggesting a bullish continuation as long as price respects the recent breakout zone.
📌 Disclaimer:
This is not financial advice. Always wait for proper confirmation before executing trades. Manage risk wisely and trade what you see—not what you feel.

Gold M15 Structure Plan – 3283 is the Mirror (June 30)🟡 Gold – M15 Analysis | June 30
Reflecting live market structure using principles from Chapter 9: H4–M15 Synchrony — from The Chart Is The Mirror
🔻 Setup Overview:
Gold is now trading at a M15 lower high supply zone — a short-term decision point.
Structure offers two clear possibilities :
🔸 Plan A – Short Setup
If price respects the 3283 zone and:
– M1 gives an internal structure shift
– Followed by a clean micro BOS
➡️ I’ll consider a short entry.
🔸 Plan B – Bullish Shift
If the M15 lower high breaks , it becomes a CHoCH .
Then I’ll wait for a proper BOS to confirm bullish intent.
📌 No BOS = No Trade
🧭 H4 Context Reminder:
The 4H structure still suggests price may reach the 3225 POI
before any major bullish continuation resumes.
Patience is key — let structure lead.
📖 From the Mirror Philosophy:
“Trade what the chart reflects — not what you expect.”
The market doesn’t care about bias.
It reflects your patience, discipline, and presence.
📘 Shared by @ChartIsMirror
Author of The Chart Is The Mirror — a structure-first, mindset-driven book for serious traders.

$XAUTUSDt 300625 TRADE SETUPWaiting for Price to show its hand, then I'll take a Trade.
Overall 🔺BULLISH; anticipating the PWL to be souped where I will start hunting Entries to LONG.
For Entertainment. Not a Financial/Investment Advice.
What's your view❓

USDJPY 29/06/2025Weekly:
-Bearish W pattern.
-Liquidity sweep.
-Expecting a bearish weekly candle.
Daily:
-Bearish W pattern.
-IC.
4H:
-Bearish W pattern.
-IC.

Bearish Reversal at Supply – GBP/USD🧠 Trade Breakdown:
Price broke structure cleanly to the downside, leaving behind a clear supply zone on the higher timeframes. Now we’re seeing a textbook pullback into that zone — slow, weak volume — signaling distribution before the next potential move down.
📍 Key Confluences:
• Higher timeframe supply zone respected
• Break of structure followed by clean pullback
• Consolidation + order buildup into the zone
• High reward-to-risk (estimated 7:1)
• Supply zone: 1.3718 – 1.3735
• Entry: 1.37206
• SL: Above 1.3735
• TP: 1.36275
📸 Trade Setup:
Waiting for a bearish reaction or engulfing confirmation from inside the purple supply zone. If rejection holds, I’m targeting the green demand zone below.
🧠 Mindset:
No chasing. No forcing. This is a sniper setup only. Full trust in my zone and risk management.
Trade Simple. Live Lavish.
— Quil Lavish

VIRTUAL – Setting Up for a July Breakout - $4 in the Horizon!
Another coin worth bidding on: $VIRTUAL.
It's setting up nicely above the mid-range of the current trading range, with a clean S/R flip off the previous cluster zone.
The 3-day MA is holding well, and the downtrend from the local highs is set to expire on July 6th.
Expecting a strong trend to kick in during the second week of July, with potential to push toward the $4 mark.

Uj bearish scenario Uj confirmed bearish
Bearish Momentum
Smc completely forms and
Confirmed with counter trade break
Good early entry

NOTUSDTmy entry on this trade idea is taken from a point of interest below an inducement (X).. I extended my stoploss area to cover for the whole swing as price can target the liquidity there before going as I anticipate.. just a trade idea, not financial advise
Entry; $0.001675
Take Profit; $0.002677
Stop Loss; $0.001499

WLDUSDTmy entry on this trade idea is taken from a point of interest below an inducement (X).. I extended my stoploss area to cover for the whole swing as price can target the liquidity there before going as I anticipate.. just a trade idea, not financial advise
Entry; $0.932
Take Profit; $1.229
Stop Loss; $0.835

Risk On! The US Dollar Is Weak! Buy The Major Pairs!This is the FOREX futures outlook for the week of Jun 29 - July 4th.
In this video, we will analyze the following FX markets:
USD Index, EUR, GBP, AUD, NZD, CAD, CHF, and JPY.
Investors are taken money out of safe havens and putting it into risk assets. The US Dollar saw those outflows last week, and we are likely to see that continue going into this week.
Buy the EUR, GBP and CHF vs USD. JPY should also see some upside.
The AUD and NZD continue to grind upwards as well.
Enjoy!
May profits be upon you.
Leave any questions or comments in the comment section.
I appreciate any feedback from my viewers!
Like and/or subscribe if you want more accurate analysis.
Thank you so much!
Disclaimer:
I do not provide personal investment advice and I am not a qualified licensed investment advisor.
All information found here, including any ideas, opinions, views, predictions, forecasts, commentaries, suggestions, expressed or implied herein, are for informational, entertainment or educational purposes only and should not be construed as personal investment advice. While the information provided is believed to be accurate, it may include errors or inaccuracies.
I will not and cannot be held liable for any actions you take as a result of anything you read here.
Conduct your own due diligence, or consult a licensed financial advisor or broker before making any and all investment decisions. Any investments, trades, speculations, or decisions made on the basis of any information found on this channel, expressed or implied herein, are committed at your own risk, financial or otherwise.

Risk On! Buy Stock Indices, Sell Gold, Silver.In this Weekly Market Forecast, we will analyze the S&P 500, NASDAQ, DOW JONES, Gold and Silver futures, for the week of June 29 - July 4th..
Stock Indices are pointed to the all time highs. Take advantage of the "risk on" environment while it lasts!
Gold and Silver have seen the outflows and profit taking... so look for lower prices this week.
Oil ... be patient. After a huge dump in prices when the tensions eased up between Israel/US and Iran, price is moving sideways in consolidation. I suspect lower prices to come, but I urge patience! Wait for the signature of price to show it intends to move lower. A sweep of the range highs and a run of the range lows right after... is the signal to sell.
Enjoy!
May profits be upon you.
Leave any questions or comments in the comment section.
I appreciate any feedback from my viewers!
Like and/or subscribe if you want more accurate analysis.
Thank you so much!
Disclaimer:
I do not provide personal investment advice and I am not a qualified licensed investment advisor.
All information found here, including any ideas, opinions, views, predictions, forecasts, commentaries, suggestions, expressed or implied herein, are for informational, entertainment or educational purposes only and should not be construed as personal investment advice. While the information provided is believed to be accurate, it may include errors or inaccuracies.
I will not and cannot be held liable for any actions you take as a result of anything you read here.
Conduct your own due diligence, or consult a licensed financial advisor or broker before making any and all investment decisions. Any investments, trades, speculations, or decisions made on the basis of any information found on this channel, expressed or implied herein, are committed at your own risk, financial or otherwise.

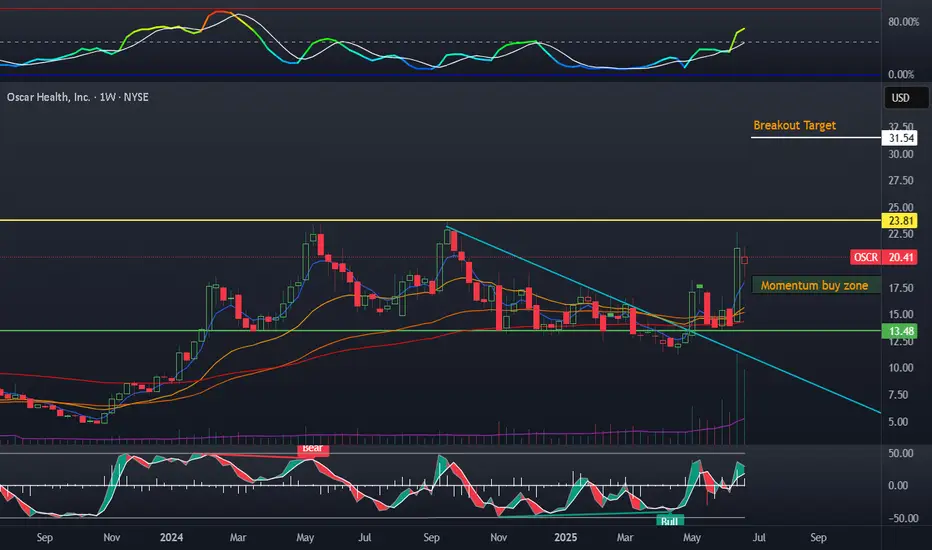
OSCR played out, where to DCA?OSCR played out nicely with a huge pop off price action. I was able to sell my leaps, and have already realized a few weeks of unassigned covered-calls. During the bounces near the bottom zone I was adding every few days. Where do I plan on averaging up? Around 17.5$ if we get there. I will also sell CSP within this zone.
Oscar like hims challenges the big legacy model of healthcare. The 24$ zone will continue to be an area of huge resistance. This is the highest volume the stock has ever had, a good sign.
MASK Analysis (3D)The correction for MASK has started from the area marked as “Strat” on the chart.
This appears to be forming a symmetrical correction, and we seem to be approaching the end of wave I.
The green zone is considered the most favorable and low-risk area for the completion of wave I.
Targets are indicated on the chart.
A daily candle closing below the invalidation level will invalidate this analysis.
For risk management, please don't forget stop loss and capital management
Comment if you have any questions
Thank You

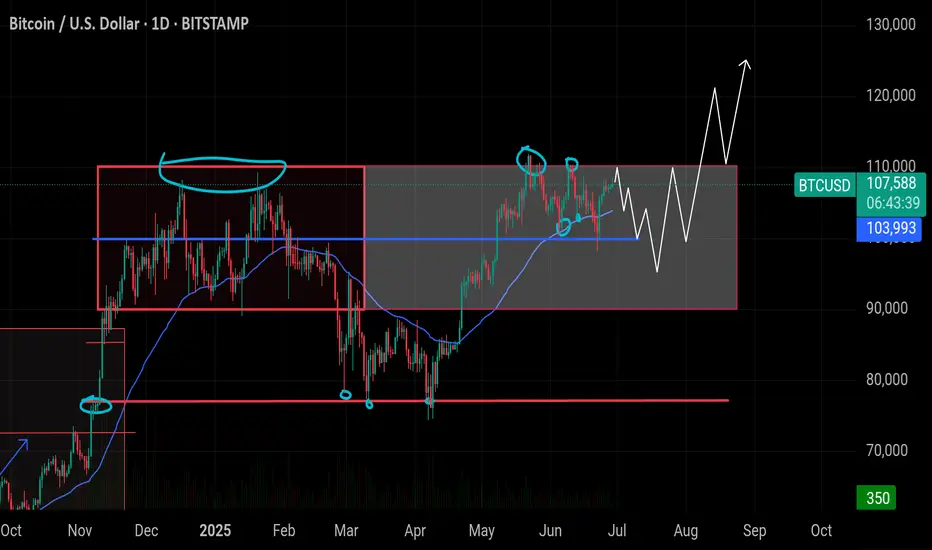
$BTC: Breakout Loading – Massive Opportunity Ahead! BTC is consCRYPTOCAP:BTC : Breakout Loading – Massive Opportunity Ahead!
BTC is consolidating within a major structure for 224+ days. Current price action is forming a bull flag, signaling strong potential for a breakout toward $120,000–$150,000. Short-term volatility expected, but long-term trend remains bullish.
🔸 Support at $90,000–$93,000:
Strong confluence in this region including CME gap, liquidity pools, and previous structure support. Rejection from $113K could trigger a flush into this zone. Long setups should be considered here. Whales are accumulating.
🔸 Upside Target: $120,000 – $150,000
Long-term breakout from consolidation range aligning with historical accumulation patterns and macro indicators like M2 lag. Break of $113K with strength opens doors to $120K+. Clean structure with confirmed support will fuel rally continuation.
🔸 Risk Level at $88,000:
If BTC breaks below $88K with volume and closes under structure, it would invalidate the bull flag scenario short-term and signal deeper correction.
🔸 Outlook:
Monitor price reaction near $113K. Prepare for fakeout and potential sweep into $90K–$93K zone. Place laddered long orders in that range for optimal R:R. If dip occurs, treat it as a gift entry. No bearish outlook unless macro conditions shift drastically. Momentum remains upward.
AUDUSD Bullish Ready for long position**Description (AUD/USD Long Setup):**
This is a 1-hour chart of **AUD/USD**, showing a textbook **bullish continuation setup**. The price has recently pulled back in a **bullish flag** (descending channel) and is now showing signs of a breakout above the flag's upper boundary.
Price is reacting from a **Weekly Area of Interest (AOI)** — a zone of previous support — while remaining above the **200 EMA (red)** and reclaiming the **50 EMA (blue)**.
All major timeframes (W, D, 12H, 6H, 4H) are **100% bullish**, adding confluence and confidence to this buy idea.
---
**Why I want to enter Buy:**
* ✅ **Bullish flag breakout** — strong bullish pattern indicating trend continuation.
* ✅ **Price bounced from Weekly AOI** — key support zone respected.
* ✅ **Reclaiming EMAs** — bullish strength returning.
* ✅ **Confluence of timeframes** — momentum aligned from 4H to Weekly.
* ✅ **Great Risk-to-Reward (R\:R)** — defined invalidation below support (Daily AOI), and upside toward **Daily AOI @ 0.66500**.
---
🎯 **Target:** 0.66500
🛡️ **Stop loss:** Just below 0.64500
📈 **Entry idea:** Either aggressive on breakout or conservative on retest of flag breakout / AOI
This setup reflects smart money reaccumulation at a key zone with multi-timeframe alignment — high probability for bullish continuation.

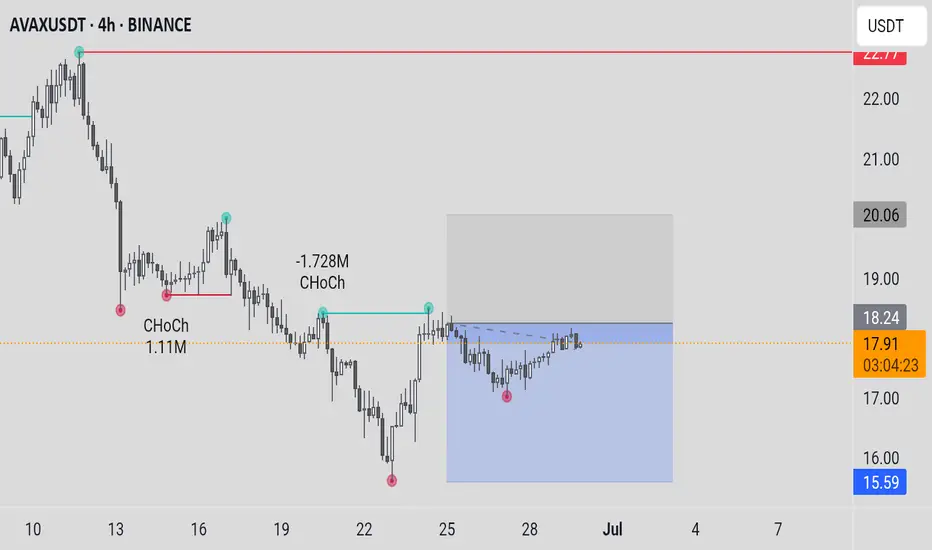
AVAXUSDTCryptocurrency Futures Market Disclaimer 🚨🚨🚨
Trading cryptocurrency futures involves high risks and is not suitable for all investors.
Cryptocurrency prices are highly volatile, which can lead to significant gains or losses in a short period.
Before engaging in crypto futures trading, consider your risk tolerance, experience, and financial situation.
Risk of Loss: You may lose more than your initial capital due to the leveraged nature of futures. You are fully responsible for any losses incurred.
Market Volatility: Crypto prices can fluctuate significantly due to factors such as market sentiment, regulations, or unforeseen events.
Leverage Risk: The use of leverage can amplify profits but also increases the risk of total loss.
Regulatory Uncertainty: Regulations related to cryptocurrencies vary by jurisdiction and may change, affecting the value or legality of trading.
Technical Risks: Platform disruptions, hacking, or technical issues may result in losses.
This information is not financial, investment, or trading advice. Consult a professional financial advisor before making decisions. We are not liable for any losses or damages arising from cryptocurrency futures trading.
Note: Ensure compliance with local regulations regarding cryptocurrency trading in your region.
thanks for like and follow @ydnldn
DYDXUSDTCryptocurrency Futures Market Disclaimer 🚨🚨🚨
Trading cryptocurrency futures involves high risks and is not suitable for all investors.
Cryptocurrency prices are highly volatile, which can lead to significant gains or losses in a short period.
Before engaging in crypto futures trading, consider your risk tolerance, experience, and financial situation.
Risk of Loss: You may lose more than your initial capital due to the leveraged nature of futures. You are fully responsible for any losses incurred.
Market Volatility: Crypto prices can fluctuate significantly due to factors such as market sentiment, regulations, or unforeseen events.
Leverage Risk: The use of leverage can amplify profits but also increases the risk of total loss.
Regulatory Uncertainty: Regulations related to cryptocurrencies vary by jurisdiction and may change, affecting the value or legality of trading.
Technical Risks: Platform disruptions, hacking, or technical issues may result in losses.
This information is not financial, investment, or trading advice. Consult a professional financial advisor before making decisions. We are not liable for any losses or damages arising from cryptocurrency futures trading.
Note: Ensure compliance with local regulations regarding cryptocurrency trading in your region.
thanks for like and follow @ydnldn

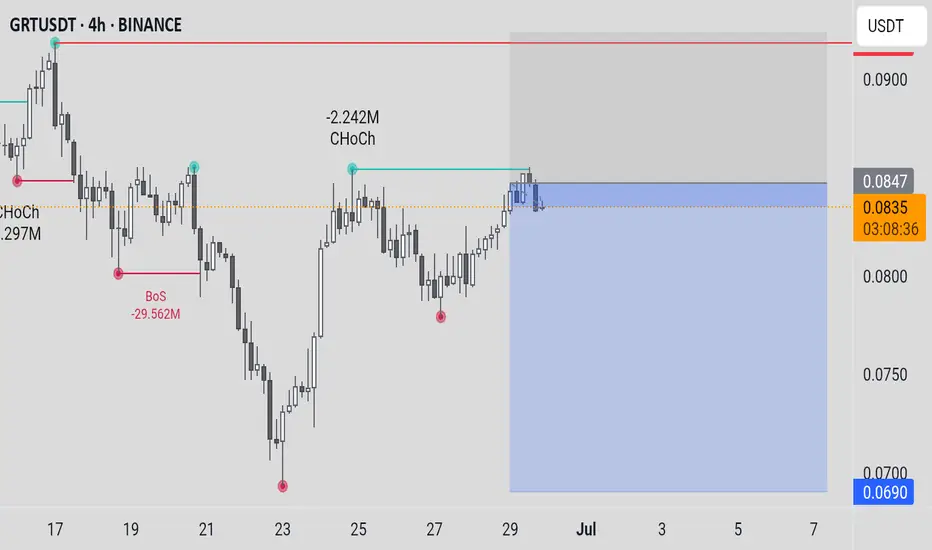
GRTUSDTCryptocurrency Futures Market Disclaimer 🚨🚨🚨
Trading cryptocurrency futures involves high risks and is not suitable for all investors.
Cryptocurrency prices are highly volatile, which can lead to significant gains or losses in a short period.
Before engaging in crypto futures trading, consider your risk tolerance, experience, and financial situation.
Risk of Loss: You may lose more than your initial capital due to the leveraged nature of futures. You are fully responsible for any losses incurred.
Market Volatility: Crypto prices can fluctuate significantly due to factors such as market sentiment, regulations, or unforeseen events.
Leverage Risk: The use of leverage can amplify profits but also increases the risk of total loss.
Regulatory Uncertainty: Regulations related to cryptocurrencies vary by jurisdiction and may change, affecting the value or legality of trading.
Technical Risks: Platform disruptions, hacking, or technical issues may result in losses.
This information is not financial, investment, or trading advice. Consult a professional financial advisor before making decisions. We are not liable for any losses or damages arising from cryptocurrency futures trading.
Note: Ensure compliance with local regulations regarding cryptocurrency trading in your region.
thanks for like and follow @ydnldn
Positioning Buy idea on Sugar (SB1!)Based on :
- Cot at extremes potential reversal
- Seasonality and quantitative analysis
- 2 Demand zones

GBPCHF Buy Trade IdeaHello Traders
In This Chart GBPCHF HOURLY Forex Forecast By FOREX PLANET
today GBPCHF analysis 👆
🟢This Chart includes_ (GBPCHF market update)
🟢What is The Next Opportunity on GBPCHF Market
🟢how to Enter to the Valid Entry With Assurance Profit
This CHART is For Trader's that Want to Improve Their Technical Analysis Skills and Their Trading By Understanding How To Analyze The Market Using Multiple Timeframes and Understanding The Bigger Picture on the Charts

Natural Gas is in the Buying DirectionHello Traders
In This Chart NATGAS HOURLY Forex Forecast By FOREX PLANET
today NATGAS analysis 👆
🟢This Chart includes_ (NATGAS market update)
🟢What is The Next Opportunity on NATGAS Market
🟢how to Enter to the Valid Entry With Assurance Profit
This CHART is For Trader's that Want to Improve Their Technical Analysis Skills and Their Trading By Understanding How To Analyze The Market Using Multiple Timeframes and Understanding The Bigger Picture on the Charts

Silver is in the Bearish trend after testing ResistanceHello Traders
In This Chart XAGUSD HOURLY Forex Forecast By FOREX PLANET
today XAGUSD analysis 👆
🟢This Chart includes_ (XAGUSD market update)
🟢What is The Next Opportunity on XAGUSD Market
🟢how to Enter to the Valid Entry With Assurance Profit
This CHART is For Trader's that Want to Improve Their Technical Analysis Skills and Their Trading By Understanding How To Analyze The Market Using Multiple Timeframes and Understanding The Bigger Picture on the Charts
