Supply and Demand

#GBPUSD: Bulls are in control, DXY Dropping Sharply!Hello Team,
We have identified a promising opportunity with a favourable price movement. The Pound Sterling to US Dollar (GBPUSD) pair has exhibited strong bullish volume, indicating potential further appreciation.
The current geopolitical tensions, particularly the involvement of the United States in the Iran-Israel conflict, are expected to negatively impact the US Dollar. This decline could potentially lead to an appreciation of the GBPUSD pair and other USD-denominated currencies.
It is advisable to closely monitor the price behaviour of the GBPUSD pair and consider potential investment opportunities based on its current trend.
Best regards,
Team Setupsfx

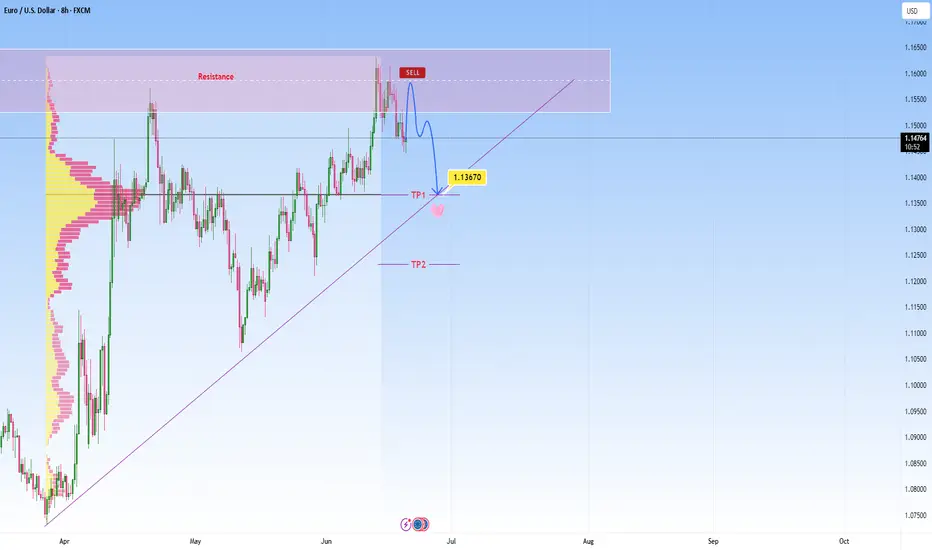
EURUSD heads towards resistance, short-term reversal expectedEURUSD has been in a strong uptrend, and we’re currently observing price action is reaching a notable resistance zone. I am watching for a reversal here as marked on my chart, not expecting a major move, but rather a short-term rejection with a downside target at around 1.13670 , which also aligns with the POC.
This is where it can become a decision point, either price finds support and bounces, or it breaks below, and that’s when we might see the move start to extend lower.
If we get a decisive breakdown through that ascending trendline, my next area of interest is marked as TP2. From there we can expect either potential accumulation or another reaction, depending on broader market sentiment at the time.
That said, we're navigating a complex backdrop currently:
The EU macro environment is under pressure, as weak economic data from Europe is contributing to cautious sentiment around the euro.
Meanwhile, a sustained USD bid continues, supported by stronger U.S. growth expectations, favorable yields, and persistent global demand. This further weighs on EURUSD.
Adding to the uncertainty, escalating tensions between Israel and Iran have rattled markets this week. This geopolitical risk could be pushing oil prices higher:
It’s important to note that if price convincingly rejects here and loses structure, especially with high volume and obvious bullish structure, this setup would become invalid. In that case, I would reassess and adapt
CRV ANALYSIS (1D)The smaller structure of CRV is bearish. It is expected to reject downward from the red zone, with our rebuy zone being the green area.
Given that the internal structure is bearish, it is ultimately expected to reach the green zone.
Closing a daily candle below the invalidation level will invalidate this analysis.
For risk management, please don't forget stop loss and capital management
When we reach the first target, save some profit and then change the stop to entry
Comment if you have any questions
Thank You
TON New Update (1D)This analysis is an update of the analysis you see in the "Related publications" section
Since we started publishing a series of bearish analyses on TON, the coin has experienced a significant drop | despite the ongoing growth of the Telegram app and its expanding user base.
Before reaching the support zone mentioned in our previous analysis, a strong intermediate demand zone is visible along the way, located just below a notable liquidity pool. A solid bullish reaction is expected from this identified demand area.
Targets are clearly marked on the chart.
A daily candle close below the invalidation level will invalidate this analysis.
For risk management, please don't forget stop loss and capital management
When we reach the first target, save some profit and then change the stop to entry
Comment if you have any questions
Thank You

Silver has follow the bullish trend buying possible from support📈 Silver Alert – Bullish Momentum Building! 🚀
Silver is showing strong bullish movement after bouncing off key support at 34.9000 on the 4H timeframe.
🎯 Technical Targets:
1st Target: 36.6000 – Approaching key supply zone
2nd Target: 37.5000 – Major resistance level to watch
The trend looks solid with momentum picking up — bulls are in control for now!
💬 Like, follow, comment & join us for more real-time updates and expert insights.
Stay ahead of the market with Livia 😜
#Silver #XAGUSD #TechnicalAnalysis #TradingSignals #BullishTrend #PriceAction

XTIUSD Breakdown from ascending channel now buy from supportXTIUSD Technical Update – 1H Timeframe 🚨
Crude Oil (XTIUSD) has broken down from the ascending channel, but is now showing a strong bullish reaction from the key demand zone at 65.10.
📈 Upside Targets:
🔹 1st Target: 70.00 – Local supply zone
🔹 2nd Target: 74.00 – Key supply zone
🔹 3rd Target: 77.00 – Bearish order block
The momentum is shifting – bulls are stepping in! Watch for confirmations on lower timeframes and manage risk accordingly. 🔍
✅ Like
✅ Follow
✅ Comment
💬 Join us for more real-time updates and analysis!
— With 💖,
Livia 😜

EURUSD: Support & Resistance Analysis for Next Week 🇪🇺🇺🇸
Here is my latest structure analysis
and important supports & resistances for EURUSD for next week.
Consider these structures for pullback/breakout trading.
❤️Please, support my work with like, thank you!❤️
I am part of Trade Nation's Influencer program and receive a monthly fee for using their TradingView charts in my analysis.

GBPJPY Major Resistance Breakout Ahead📈 GBP/JPY Technical Analysis – 4H Time Frame 🔍
GBPJPY has maintained its ascending structure and recently broke above the previous supply zone at 196.900, signaling bullish strength.
🎯 Entry Idea:
Watch for a retracement to the 196.900 zone — now turned potential demand — for a possible long entry.
📌 Technical Targets:
1st Target: 198.600 (key resistance)
2nd Target: 200.000 (psychological resistance level)
The breakout confirms bullish momentum — a clean retest could offer a solid risk-to-reward setup.
💬 Like, follow, and drop your thoughts in the comments!
📢 Join us for more real-time updates and smart trade setups.
— With love,
Livia 😜✨

BTCUSD Descending channel breakout bullish possible from SupportBTCUSD Breakout Alert!
1H Timeframe Analysis
Bitcoin has broken out of the descending channel with a strong bullish candle — signaling a potential reversal from the key demand zone around 103,600.
📈 Technical Targets:
🔹 First Target: 108,000
🔹 Second Target: 110,000
This breakout could offer a solid long opportunity, but as always — manage risk wisely! ✅
💬 What’s your bias?
❤️ Like | 🔁 Share | 💭 Comment
📲 Join us for more real-time updates and insights!
#BTC #Bitcoin #CryptoTrading #TechnicalAnalysis #Breakout #BullishMomentum

XAUUSD Has Ascending channel breakdown selling strong now🔔 XAUUSD Update – 4H Breakdown Alert!
Gold (XAUUSD) has officially broken down from the ascending channel, signaling strong bearish momentum starting from 3322.
📉 Technical Targets Ahead: 1️⃣ 3280 – First demand zone
2️⃣ 3240 – Next key demand zone
3️⃣ 3160 – Major support level
We're seeing solid selling pressure, and the 4H timeframe confirms the structure shift. Keep an eye on price action around these zones for potential reaction or continuation.
💬 Drop your thoughts in the comments!
👍 Like | 🔁 Share | ✅ Follow for live insights and real-time market updates.
Join the team for more smart trades & updates 💼
— Livia 😜

GBPUSD Selling From Bearish Order Block At 1.36200GBPUSD Technical Breakdown
Timeframe: 1H
Price has officially broken out of the descending channel and is now reacting from the bearish Order Block around 1.36200. We're looking for short opportunities as momentum shifts.
🎯 Bearish Targets:
🔻 1st Target: 1.35500 – Key Demand Zone
🔻 2nd Target: 1.34700 – Deeper Demand Zone
🔻 3rd Target: 1.34000 – Bullish Order Block
📉 Setup looks clean – watching PA confirmation on each level.
👇 Like, follow, comment, and join us for more updates & smart trade setups.
Trade smart. Trade safe. 💼✨
— Livia 😜

EURUSD Selling From bearish ob at 1.16100 strong sell📉 EURUSD Analysis – 4H Timeframe 📉
The pair is currently respecting an ascending channel, but we’re eyeing a potential reversal from the bearish Order Block (OB) around 1.16100 – a prime sell zone.
🎯 Technical Targets:
1st Target: 1.14500 – Demand Zone
2nd Target: 1.13000 – Demand Zone
3rd Target: 1.11000 – Key Support Level
This setup offers clean risk-reward with price action confirming supply pressure at the top.
🚨 Watch for confirmations before entering – smart entries win the game.
💬 Like, follow, comment your thoughts, and join the team for more real-time updates and insights!
With love,
Livia 😜💹

USDCHF Bullish Strong From Key Demand Zone 0.80400📉 USD/CHF Technical Outlook (4H Chart) 📈
The pair has been respecting a descending channel, recently tapping into a key demand zone around 0.80400. Bullish momentum is now building, signaling a potential reversal.
🎯 Upside Technical Targets:
1️⃣ 0.82000 – Initial Supply Zone
2️⃣ 0.83200 – Secondary Supply Zone
3️⃣ 0.84500 – Major Resistance Level
💡 Watch for bullish confirmation signals in the zone before entering. As always, manage your risk.
✨ Like, Follow, Comment, and Join us for more timely updates!
— Livia 😜 | #ForexWithLivia

USDJPY Ascending channel breakdown ahead selling strong📉 USDJPY Breaks Down!
Strong sell-off from the key supply zone at 145.500 – the ascending channel has been broken on the 1H timeframe, signaling momentum shift.
🎯 Technical Targets:
🔹 1st Target: 144.000 – key demand zone
🔹 2nd Target: 143.000 – strong support level
Bearish pressure is building — price action confirms the shift. Eyes on lower zones as sellers take control. 📊
🔔 Like, Follow, and Comment your thoughts!
💬 Join us for more timely market updates and clean setups!
#USDJPY #ForexAnalysis #TechnicalTrading #PriceAction #FXSetup #LiviaTrades 😜

Last week of June EU outlookWeekly forecast for EU. We have seen a very bullish June so far. We approached a weekly POI before starting to consolidate.
We are now entering the last week of the month where the monthly candle's upper wick needs to be formed.
In this video I have identified a potential area where we could see the pullback take place.

XOM daily setup to $117XOM gave us a 50% retracement on the daily (I use 24 hour chart since it includes after hours), swept a key level, and bouncing off bullish FVG.
We break and hold $110.94 and we're in business.
Targeting $117.05. I have July 18 $110 calls.

US30 looking for the short on Bearish PAI believe we can expect a pull back down to JuBias: Short-term Bearish (Contingent Setup)
Context: Price is currently trading just below a high-probability supply zone between 44,048 – 44,277. This area aligns with prior highs and liquidity, making it a prime zone to look for a short-term rejection if strong bearish price action (PA) appears on the 4H or Daily timeframes.
We are currently seeing strong bullish momentum on the Weekly, Daily, and H4 candles. Any short positions from this zone must be reactive — not anticipatory. A clear bearish signal (e.g., engulfing, structure break, supply confirmation) is required to consider entry.
Key Zone:
Seek bearish PA between 44,048 – 44,277
Contingency: If price breaks and closes above 44,250 (2024 highs), expect continuation toward 45,000
Short Targets if Rejection Occurs:
Target 1: 43,350
Target 2: 42,500
Extended Target: 41,734 (June Low)
Post-Rejection Bullish Scenario:
If we do get a rejection and targets are met, we will then look for bullish PA in the demand zones (42,500 or 41,700) to consider long setups back toward the 2024 highs and potentially beyond.
Breakout Scenario:
If price breaks and closes above the 44,277 zone early this week, we anticipate the next leg to 45,000 before any meaningful reversal.
At this stage, it’s a waiting game — let price action lead. We don’t predict, we react.ne lows before an

FARTCOIN Flipped Key EMA—Is This the Start of a Pump or Trap?Yello Paradisers ! Are we looking at a breakout that could deliver massive upside, or is this just another emotional trap before the next leg down? The market has been ruthless lately, and unless you base your decisions on structure, probability, and proper confirmation, you’re gambling—not trading. Let’s break down this #FARTCOIN setup from a professional standpoint.
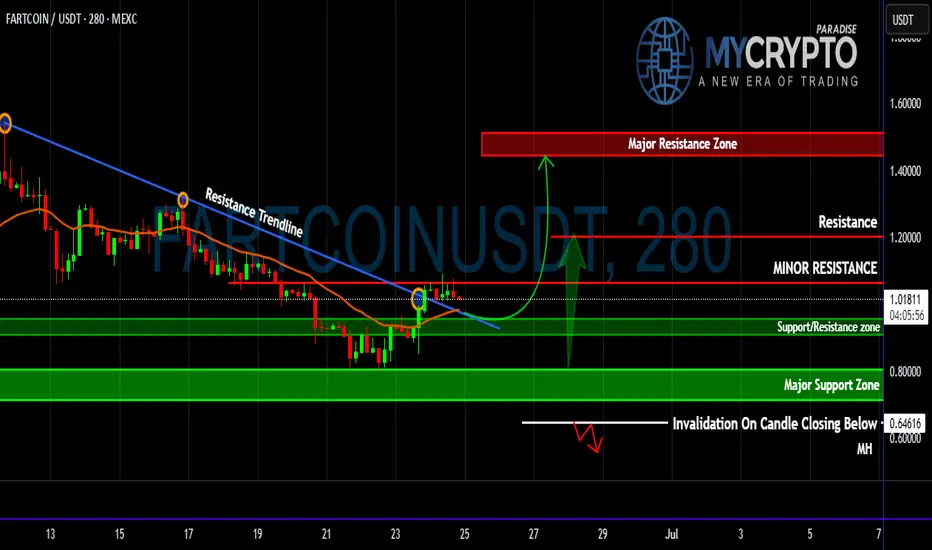
💎#FARTCOIN has finally broken above a clearly defined descending resistance trendline, signaling a potential probable shift in short-term momentum. This breakout occurred precisely as the price reclaimed the multi-timeframe EMA —a key dynamic level that has consistently acted as resistance throughout the downtrend. The reclaim and hold above this EMA significantly increase the probability of a short- to mid-term trend reversal, especially as it aligns with an early attempt to build a bullish market structure.
💎Price is now trading just below a minor resistance level. This zone has capped previous upward attempts and is the first level bulls must overcome for continuation. A confirmed 4H/1H or daily candle close above this resistance will open the door to a measured move toward the next key level at $1.20265, with extended upside potential into the major resistance zone between $1.44660 and $1.55099. Should bullish momentum pick up with increasing volume, a Probable upside move becomes a realistic scenario.
💎However, none of this is guaranteed. We're dealing with probabilities, not certainties. The support/resistance flip zone between $0.95949 and $0.90596 now becomes a crucial reference point. A healthy retest of this area could provide a higher-probability long entry, especially if price continues to respect the reclaimed EMA. Below that, the major support zone from $0.80693 to $0.71058 represents a broader demand block. If the price pulls back this far, it may signal the formation of a larger accumulation range rather than immediate continuation.
💎To manage risk effectively, traders must monitor the invalidation level at $0.64616. A 4H candle close below this level would nullify the bullish breakout scenario and increase the probability of renewed bearish control, suggesting the recent breakout was a deviation or fakeout.
Stay sharp, Paradisers! Will this be a breakout or a fake-out? Only time—and disciplined trading—will tell!
MyCryptoParadise
iFeel the success🌴
Gold RangeThis reaccumulation model for gold just popped into my head, so I wanted to post it on my profile to see how wrong I was later. My main focus right now is this potential internal distribution, which will likely take some time to confirm/invalidate. I'll take a closer look if there are more signs that it's playing out.

Weekly Forex Outlook Sun.June.29.2025 - Fri.July.4.2025Like and Comments would be appreciated :D Not Financial Advice, Just my outlook/opinion

Weekly Market ReportIn this week’s video, I break down the key technical levels and market dynamics across four major instruments: S&P 500 (/ES), Gold (XAUUSD), Crude Oil (WTI), and Bitcoin (BTCUSD).
We explore price structure, liquidity zones, and potential setups with a focus on probability-based trade planning and risk management. Whether you're a swing trader or intraday participant, this breakdown offers valuable insight into the week ahead.

Market Re-Cap and Outlook for NEXT WEEKHere I am giving you a little insight as to what trades I am currently in, taken & looking to take for the week just gone and the week coming.
1 Winning trade on EU
1 Current open position on EU
EURGPB - Breakdown
AUDUSD - Breakdown
NZDUSD - Breakdown
Gold - Breakdown
If there are any pairs you would like me to share my feedback on give me a message and I will be happy to try and do so.
Thanks
Happy Hunting
