Nifty levels - Jun 30, 2025Nifty support and resistance levels are valuable tools for making informed trading decisions, specifically when combined with the analysis of 5-minute timeframe candlesticks and VWAP. By closely monitoring these levels and observing the price movements within this timeframe, traders can enhance the accuracy of their entry and exit points. It is important to bear in mind that support and resistance levels are not fixed, and they can change over time as market conditions evolve.
The dashed lines on the chart indicate the reaction levels, serving as additional points of significance to consider. Furthermore, take note of the response at the levels of the High, Low, and Close values from the day prior.
We hope you find this information beneficial in your trading endeavors.
* If you found the idea appealing, kindly tap the Boost icon located below the chart. We encourage you to share your thoughts and comments regarding it.
Wishing you success in your trading activities!
Supply and Demand

AR Looks Bullish (1D)The AR symbol appears to be completing a double corrective pattern | the first part being a plapyonic diametric and the second part a flat. The green zone represents a demand area that could potentially push the price upward. Note that this type of setup is generally safer for spot trading, while futures trading would require more precise entry levels.
Targets are marked on the chart.
A daily candle closing below the invalidation level will invalidate this analysis.
For risk management, please don't forget stop loss and capital management
Comment if you have any questions
Thank You

Gold Distribution I missed the perfect entry for this distribution model, but since the technical target hasn't been reached yet, I'll look for valid entries if they arise. The time displacement is good, it swept internal liquidity and left more to the downside. It looks more like a trend than a range deviation, so I'll be cautious with this trade if I take it.

XAU/USD 27 June 2025 Intraday AnalysisH4 Analysis:
-> Swing: Bullish.
-> Internal: Bullish.
Analysis and bias remains the same as analysis dated 23 April 2025
Price has now printed a bearish CHoCH according to my analysis yesterday.
Price is now trading within an established internal range.
Intraday Expectation:
Price to trade down to either discount of internal 50% EQ, or H4 demand zone before targeting weak internal high priced at 3,500.200.
Note:
The Federal Reserve’s sustained dovish stance, coupled with ongoing geopolitical uncertainties, is likely to prolong heightened volatility in the gold market. Given this elevated risk environment, traders should exercise caution and recalibrate risk management strategies to navigate potential price fluctuations effectively.
Additionally, gold pricing remains sensitive to broader macroeconomic developments, including policy decisions under President Trump. Shifts in geopolitical strategy and economic directives could further amplify uncertainty, contributing to market repricing dynamics.
H4 Chart:
M15 Analysis:
-> Swing: Bullish.
-> Internal: Bullish.
Following previous high, and printing of bearish CHoCH, price has pulled back to an M15 supply zone, where we are currently seeing a reaction. Therefore, I shall now confirm internal high.
Price is now trading within an established internal range.
The remainder of my analysis shall remain the same as analysis dated 13 June 2025, apart from target price.
As per my analysis dated 22 May 2025 whereby I mentioned price can be seen to be reacting at discount of 50% EQ on H4 timeframe, therefore, it is a viable alternative that price could potentially print a bullish iBOS on M15 timeframe despite internal structure being bearish.
Price has printed a bullish iBOS followed by a bearish CHoCH, which indicates, but does not confirm, bearish pullback phase initiation. I will however continue to monitor, with respect to depth of pullback.
Intraday Expectation:
Price to continue bearish, react at either M15 supply zone, or discount of 50% internal EQ before targeting weak internal high priced at 3,451.375.
Note:
Gold remains highly volatile amid the Federal Reserve's continued dovish stance, persistent and escalating geopolitical uncertainties. Traders should implement robust risk management strategies and remain vigilant, as price swings may become more pronounced in this elevated volatility environment.
Additionally, President Trump’s recent tariff announcements are expected to further amplify market turbulence, potentially triggering sharp price fluctuations and whipsaws.
M15 Chart:

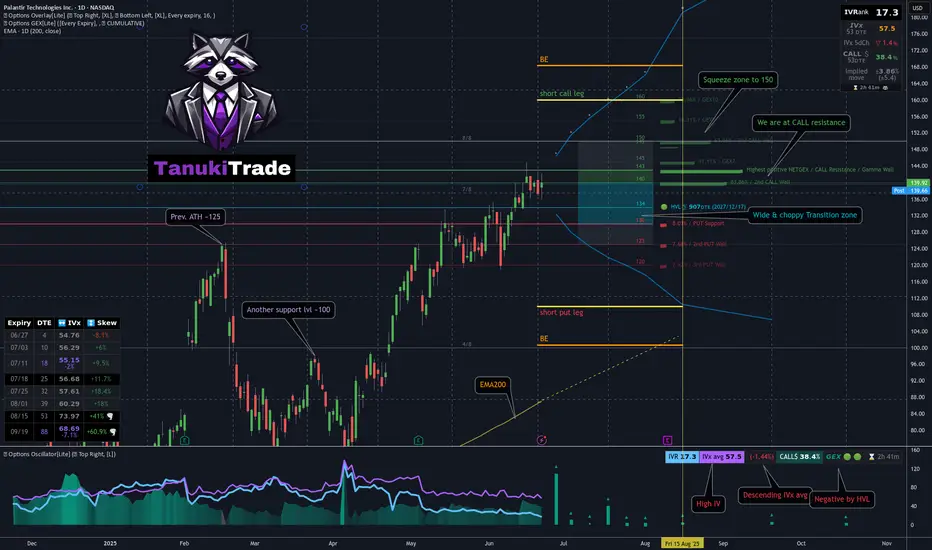
Jade Lizard on PLTR - My 53DTE Summer Theta PlayMany of you — and yes, I see you in my DMs 😄 — are trading PLTR, whether using LEAPS, wheeling, or covered calls.
I took a closer look. And guess what?
📈 After a strong move higher, PLTR was rejected right at the $143 call wall — pretty much all cumulative expiries cluster resistance there
Using the GEX Profile indicator, scanning all expirations:
After a brief dip, the market is repositioning bullish
Squeeze zone extends up to 150
The most distant GEX level is sitting at 160
On the downside, 130 is firm support, with some presence even at 120 — the market isn’t pricing in much risk below that
📉 From a technical standpoint:
We’re near all-time highs
125 (previous ATH) and 100 are key support levels
The OTM delta curve through August is wide, and the call side is paying well — with a current call pricing skew
🔬 IVx is at 57, trending lower + call pricing skew📉 IV Rank isn't particularly high, but the directional IVx matters more here
💡 Summer Theta Play: Jade Lizard on PLTR
Since I’ll be traveling this summer and don’t want to micromanage trades, I looked for something low-touch and high-confidence — and revisited an old favorite: the Jade Lizard.
If you're not familiar with the strategy, I recommend checking out Tastytrade's links and videos on Jade Lizards.
🔹 Why this setup?
Breakeven sits near $100, even with no management
On TastyTrade margin:~$1800 initial margin ~$830 max profit
53 DTE — plenty of time for theta to work
Earnings hit in August — I plan to close before then
Covers all bullish GEX resistance zones
Quickly turns profitable if IV doesn’t spike
Highly adjustable if needed
My conclusion: this strategy covers a much broader range than what the current GEX Profile shows across all expirations — so by my standards, I consider this to be a relatively lower-risk setup compared to most other symbols right now with similar theta strategies.
🔧 How would I adjust if needed?
If price moves up:
I’d roll the short put up to collect additional credit
Hold the call vertical as long as the curve supports it
If price drops:
Transition into a put ratio spread
Either extend or remove the call vertical depending on conditions
🛑 What’s the cut loss plan?
I have about 20% wiggle room on the upside, so I’m not too worried — but if price rips through 160 quickly, I’ll have to consider early closure.
If that happens, the decision depends on time:
If late in the cycle with low DTE:→ Take a small loss & roll out to next month for credit
If early with lots of DTE remaining:→ Consider converting to a butterfly, pushing out the call vertical for a small debit→ Offset this with credit from rolling the put upward
As always — stay sharp, manage your risk, and may the profit be with you.
See you next week!– Greg @ TanukiTrade
Technical outlook for the EUR/GBP pair!The EUR/GBP pair had been trading in a general uptrend on the 4-hour chart, forming higher highs and higher lows, until the recent pullback on June 24, 2025. During this decline, the price broke below the last higher low located at the 0.85257 level and recorded a lower low.
This recent drop suggests the end of the uptrend on the 4-hour chart and a shift toward a downtrend.
What is the next possible move?
A rise in price toward the 0.85607 level would be considered a corrective move before another potential drop targeting the 0.85241 level.
A rise above the 0.85749 level followed by a 4-hour candle closing above it would indicate a return to the uptrend and invalidate the negative scenario mentioned above.

USDCAD BUY 1.3568On the 4-hour chart, USDCAD fluctuated and fell. Currently, we can pay attention to the area around 1.3568 below, which is a potential buying position for a bullish bat pattern. At the same time, this position is within the previous demand area.

USDCAD – Friday June 27th, 2025USDCAD played beautifully to our bias, breaking the 1.36647 safe sell level and delivering 46 pips clean before pulling back.
If you weren’t already in, the pullback offered a decent re-entry window — but at this point I’m not looking for new trades today.
📌 Still Bearish
Here’s what I’m watching now:
Retest of 1.36647 → possible add-on entry
Break and close below 1.35432 → continuation play
No need to force anything ahead of the weekend. Structure remains bearish and we’ll reassess post-weekend for continuation.

NQ Power Range Report with FIB Ext - 6/27/2025 SessionCME_MINI:NQU2025
- PR High: 22713.50
- PR Low: 22669.25
- NZ Spread: 98.75
Key scheduled economic events:
08:30 | Core PCE Price Index (YoY|MoM)
Session Open Stats (As of 12:35 AM 6/27)
- Session Open ATR: 348.99
- Volume: 21K
- Open Int: 260K
- Trend Grade: Neutral
- From BA ATH: -1.7% (Rounded)
Key Levels (Rounded - Think of these as ranges)
- Long: 23239
- Mid: 21525
- Short: 20383
Keep in mind this is not speculation or a prediction. Only a report of the Power Range with Fib extensions for target hunting. Do your DD! You determine your risk tolerance. You are fully capable of making your own decisions.
BA: Back Adjusted
BuZ/BeZ: Bull Zone / Bear Zone
NZ: Neutral Zone
Keep in mind this is not speculation or a prediction. Only a report of the Power Range with Fib extensions for target hunting. Do your DD! You determine your risk tolerance. You are fully capable of making your own decisions.
BA: Back Adjusted
BuZ/BeZ: Bull Zone / Bear Zone
NZ: Neutral Zone

GOLD drops sharply to 3300 and found important support areaThe recent bearish momentum on GOLD has met a good support zone and at present we started to see early signs of bullish interest returning, right after we got a beautiful rejection from the zone.
Currently I’m expecting for the price to bounce to the target near 3,390 . If this bullish push continues with strong volume and momentum, I’ll be locking in that bias and planning my entry accordingly. I could get involved right here for a more aggressive entry. It’s a bit riskier, but if the structure confirms, I’m more than happy to take the shot, as sometimes the best trades come when you trust your setup.
This is not financial advice.

USD/CAD 15-Minute Time Frame (15TF) Technical & Fundamental AnalUSD/CAD 15-Minute Time Frame (15TF) Technical & Fundamental Analysis
The Bank of Canada (BoC) recently held its benchmark interest rate steady at 2.75%, providing temporary support to the Canadian dollar (CAD). This decision pushed the loonie to an eight-month high as markets interpreted it as a sign of cautious optimism from the BoC.
However, recent data paints a more mixed picture. Weak May retail sales and cooling labor market figures have raised expectations for a possible rate cut later this year, which could weigh heavily on the CAD if confirmed. This divergence in short-term strength and longer-term concern is currently shaping the USD/CAD price action.
Technical Outlook:
USD/CAD has fallen to fresh weekly lows around 1.3626–1.3630, following a breakout above a key level at 1.3680, which was immediately followed by Accumulation and liquidity sweep below that breakout zone.
After hunting stop-losses, price is now pulling back and preparing for potential distribution, as smart money behavior appears to be unfolding.
A limit buy setup is forming at the area of reaccumulation.
📊 Trade Setup
📍 Area of Interest (AOI): 1.36390 (Buy Limit Order)
🛡 Stop-Loss: 1.36300 (Below liquidity grab)
🎯 Take Profit: 1.36680 (Next minor resistance / ~1:2.5 RR)
This trade idea is supported by institutional patterns — breakout, liquidity grab, and reaccumulation — which suggest a bullish continuation move if structure holds.
📌 Disclaimer:
This is not financial advice. Always wait for proper confirmation before executing trades. Manage risk wisely and trade what you see—not what you feel.

EURCHF 26/06/2025Weekly:
-Inverse H&S pattern.
-Previous week low liqudity sweep.
-IC.
Daily:
-Bullish M pattern.
-Liqudity sweep.
4H:
-Bullish M pattern.
-Inverse H&S pattern.

XAUUSD 📉 XAUUSD Technical Overview (15-min TF)
Recommendation: Bearish.
The pair is showing clear downside momentum, with price having broken below recent intraday highs and forming a series of lower highs and lower lows on the 15‑minute chart.
Target:
We are targeting the prior intraday low around 3295, which represents a logical short-term support area and likely liquidity target before price could consolidate or correct.

POTENTIAL EURUSD SHORT OPPORTUNITY...POSITION TRADEHello hello TradingView family! Hope you guys are doing amazingly well! Just wanted to come on here and make another post for a potential longer term opportunity I am seeing on the major currency pair EURUSD. So put your seat belts on and let's dive in!!
OK so I'm going to keep this very very simple. Not because I don't want to go in depth but because my trading is very simple and I'm just going to give it to you straight. So here are the points
1. Price is @ monthly supply
2. Price has made new highs & sitting at a monthly fib extension
3. Monthly RSI overbought conditions
4. Weekly has bearish divergence forming
5. Weekly/Daily buyer is slowing down
Make sense? If not..then I know you will figure it out. Watch for price to potentially poke a little higher but nice confluences for a fall in price. Appreciate you all!
EURUSD - Potential buying opportunityLooking at EURUSD
We are still very bullish with no sign of it slowing.
I am aware of a potential weekly liquidity point to the left, however, until EURUSD shows its hand it's important that we still remain bullish.
We have set up a lovely liquidity point before a lovely demand area.
So I will be setting a pending order at the demand area after the New York close and the Asian session begins.

Gold Potential UpsidesHey Traders, in today's trading session we are monitoring XAUUSD for a buying opportunity around 3,300 zone, Gold is trading in an uptrend and currently is in a correction phase in which it is approaching the trend at 3,300 support and resistance area.
Trade safe, Joe.

ORDIUSDT Hanging by a Thread Before the Next Leg Down?Yello Paradisers! Are you ready for the next big move on #ORDIUSDT? Because if you’re not already positioned or thinking three steps ahead, this structure could catch you off guard. We’re seeing signs of exhaustion, and the market is setting up for another potential drop. Here’s what you need to know before it's too late.
💎#ORDIUSDT remains in a clear downtrend, printing consistent lower highs and lower lows. Each rally is weaker than the last, and buyers have failed to break above key resistance zones. After the most recent failed bounce into the 7.28–7.51 area—where support has now flipped to resistance—sellers regained control and pushed price back below the 21 EMA. This confirms the
bearish momentum remains dominant and is high probability to go further down.
💎The structure continues to print classic breakdown signals. Multiple breaks of structure (BOS) further validate the downtrend. As long as price remains under the 8.47 invalidation level, there's no technical reason to consider a bullish scenario. Any short-term bounce into resistance is more likely to be a selling opportunity rather than a reversal signal.
💎If price continues lower from here, we’re watching the support levels at 6.46 and then the major support level between 5.79–5.53. A sweep of those levels could trap late shorts, but until we see a confirmed shift in market structure, our bias remains bearish. Patience will be rewarded here.
💎This is a classic scenario where retail traders often get chopped up. The real move comes after both sides get squeezed. Don't be part of the noise.
Strive for consistency, not quick profits. Treat the market as a businessman, not as a gambler. The downtrend is clear, but only disciplined traders will be able to extract profits here without emotional mistakes. Stay sharp, stay strategic, and above all—stay safe, Paradisers.
MyCryptoParadise
iFeel the success🌴

US100 (NASDAQ 100 Index) – Breakout with Clear Upside ProjectionUS100 has broken out cleanly above the key resistance at 22,097.1, indicating bullish continuation. The breakout is supported by strong upward momentum, targeting the next key level around 23,441.9, as illustrated by the projected range.
Support at: 22,097.1 🔽 | 20,750.0 🔽
Resistance at: 23,441.9 🔼
🔎 Bias:
🔼 Bullish: Sustained price action above 22,097.1 keeps the bullish breakout valid, aiming toward 23,441.9.
🔽 Bearish: A drop back below 22,097.1 would invalidate the breakout, possibly pulling price toward 20,750.0.
📛 Disclaimer: This is not financial advice. Trade at your own risk.

Possible movement on the near future, if it close under 3332If the prices closes under 3332 and we have enough volume in the markets we will hunt the liquidity in the 3320-3315 area, before a possible move to the upside.

Advance technical analysis AUX USD ✅ Advanced Technical Analysis – XAU/USD (Gold) – 1H Timeframe
🧩 Chart Overview:
Timeframe: 1 Hour (H1)
Current Price: 3,333.675
Recent High: 3,451.525
Recent Low: 3,293.500
Marked with BOS (Break of Structure), CHoCH (Change of Character), supply and demand zones.
---
🔍 Step-by-Step Technical Breakdown:
---
1️⃣ Market Structure (Price Action)
🔺 Bullish Phase:
From June 13 to June 22, price showed a series of H1 BOS, confirming bullish structure.
🔻 Shift to Bearish:
After June 22, we observe several H1 CHoCH and BOS to the downside.
This indicates a clear transition from bullish to bearish, or at least a corrective phase.
---
2️⃣ Supply & Demand Zones
🟢 Demand Zone:
Marked between 3,293.5 and ~3,310
Price dipped into this zone and showed a minor bullish reaction (lower wick = liquidity grab)
🔴 Supply Zones:
Resistance at 3,393.509 (minor)
Stronger supply between 3,440 and 3,451 (previous unbroken highs)
---
3️⃣ Fibonacci & Potential Reversal Targets
If demand holds and bullish confirmation appears:
TP1: 3,393
TP2: 3,440
TP3: 3,451.5
These levels align well with structure and historical resistance.
---
4️⃣ Candlestick Behavior
Recent candles show price tapping the demand zone with some rejection.
Look for bullish engulfing, pin bars, or momentum candles as confirmation.
---
5️⃣ Potential Long Setup (If Confirmed):
Element Value
Entry Zone 3,305 – 3,315
Stop Loss Below 3,293 (e.g., 3,285)
TP1 3,393
TP2 3,440
TP3 3,451
Risk–Reward Estimated 1:3 to 1:5
---
⚠️ Risks & Considerations:
If the 3,293 demand zone breaks, bearish structure may continue.
Liquidity grabs and false breakouts are possible – wait for solid confirmation.
Align your entries with higher timeframe signals (e.g., H4) for stronger confluence.
---
❗️Disclaimer:
> This analysis is provided for educational purposes only and does not constitute financial advice or a recommendation to buy or sell.
You are solely responsible for your own trading decisions.

SNOW Based on the current 15-minute chart for SNOW (Snowflake Inc.), we are observing a clear liquidity sweep and internal CHoCH (Change of Character) following a strong bearish impulse. Price has aggressively retraced and is now approaching a key supply zone near 222.00, which also aligns with the most recent internal high and potential inducement zone.
I anticipate price may push slightly above 222, tapping into remaining liquidity from late buyers before reversing. This aligns with a higher timeframe resistance, suggesting the up-move is corrective rather than impulsive.
From a structural standpoint:
The prior Break of Structure (BoS) confirms bearish intent.
Liquidity was taken both at the highs and lows, typical of distribution before a larger move.
The ideal short entry is upon confirmation of rejection from this 222+ level, targeting the demand zones around 217.00 and possibly as low as 211.00, respecting the higher timeframe bearish narrative.
Risk Management Tip: Wait for a bearish engulfing or clear rejection pattern on the lower timeframes within the 222–223.20 range before entering short. Set stop-loss slightly above the last high and manage position accordingly as price approaches each demand zone.

THE KOG REPORT - UpdateEnd of day update from us here at KOG:
Again, just like yesterday, we completed the long trade into the red box, RIPPED then played red box hockey before swooping the low and coming back up. What madness on the markets with continuous whipsawing which is not allowing traders to hold positions without huge stop losses.
For now, we have support at the 3325-8 level which if held should give us a move upside towards the red box. What we want to see here is do we get a lower high or not?
MA's still drawn together and more choppy price action expected in the sessions to come.
As always, trade safe.
KOG

EUR/USD | Bullish SMC SETUP EUR/USD | 15min | Bullish SMC Setup 🚀💶
Price swept Asian session lows into a higher timeframe demand zone, followed by a strong bullish BOS (Break of Structure). We’re now anticipating a pullback into the FVG (Fair Value Gap) + LQC (liquidated candle) and demand zone for potential continuation to the upside.
The entry idea is based on:
🔹 Liquidity Grab (sell-side sweep)
🔹 BOS confirmation
🔹 FVG + Demand confluence
🔹 Expecting bullish continuation toward previous high and premium zone.
Waiting for price to tap the zone before riding the wave up! 📈
You can wait for confirmation on 5min TF after tap into POI
Let’s see if it delivers.
#SMC #EURUSD #Liquidity #SmartMoney #FXTradingClub #OrderFlow #Sam_trades_smc
