META Short📈 Scenario Outlook:
Bias: Bearish
Primary Expectation: Price is currently in a corrective decline and is expected to continue toward the 676.67 CHoCH level.
Bearish confirmation was seen upon rejection from the 713.20 mid-level, with price now printing lower highs and lower lows on the 4H chart.
This move may ultimately form a larger distribution pattern on the daily timeframe.
📌 Key Zones ("Your Borders"):
🔴 Mid-Supply Rejection Zone (Resistance)
Level: ~713.20 (50% equilibrium of last bearish swing)
This level acted as the midpoint during the retracement following the initial selloff from the top.
The market respected this region as a mid-range rejection, further reinforcing bearish momentum.
Failure to reclaim this level confirms bearish dominance in the short-to-medium term.
⚪ Target Zone / CHoCH Demand Test
Zone: 676.67 (CHoCH)
This is your projected draw on liquidity and primary downside target. It marks a structurally significant low where prior bullish order flow initiated.
If this level fails to hold, META may shift into a broader corrective phase, potentially unwinding a large portion of the prior rally.
Supply and Demand

Ethereum (ETH) – Strategic Trade PlanEthereum (ETH) continues to show resilience, currently trading around $1,790 after a strong bounce earlier this month. While the crypto market remains volatile, ETH is holding key technical levels that could fuel a major move in the coming weeks.
🎯 Entry Points:
Market Price: $1,790 — Ideal for an early position, as ETH holds above critical support zones.
$1,645 — Secondary strong support, aligning with the 20-day EMA; great for scaling in if market pulls back.
$1,400 — Deep value zone, offering a high-risk/high-reward setup if broader market correction occurs.
💰 Profit Targets:
$2,500 — First major resistance. A realistic mid-term target if bullish momentum sustains.
$3,000 — Psychological milestone and breakout confirmation level.
$3,800+ — Ambitious but achievable with broader crypto market recovery and strong ETH network metrics.
🛡️ Risk Management:
Set stop-losses dynamically below each entry support level.
Scale into positions progressively to manage volatility.
Monitor macroeconomic trends and Bitcoin's influence closely.
🔍 Key Observations:
Strong on-chain activity supports a bullish thesis.
Current resistance around $1,812 must be broken to confirm bullish continuation.
Be cautious of sudden market-wide corrections — always plan your exits and manage your risk accordingly.
📢 Disclaimer: This is not financial advice. Trading cryptocurrencies involves significant risk, and you should only invest what you can afford to lose. Always perform your own research before entering any position.

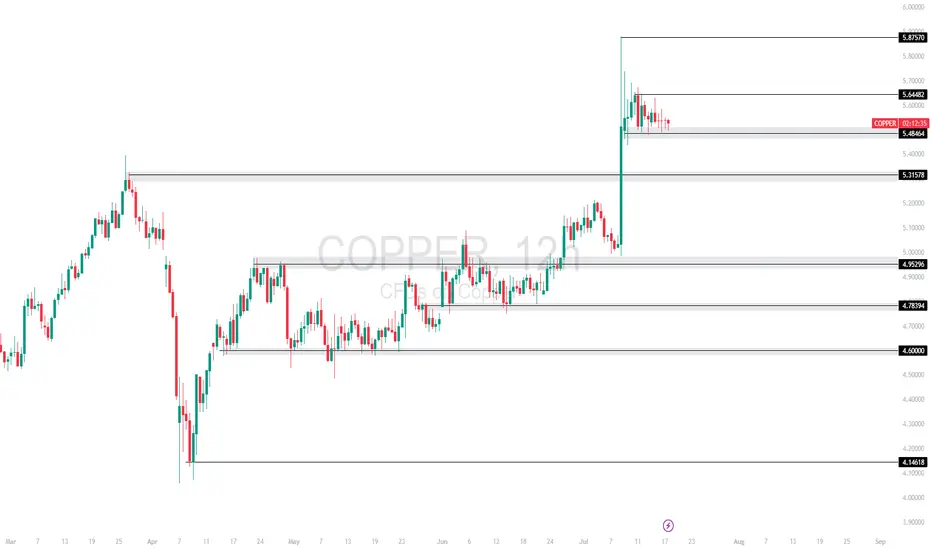
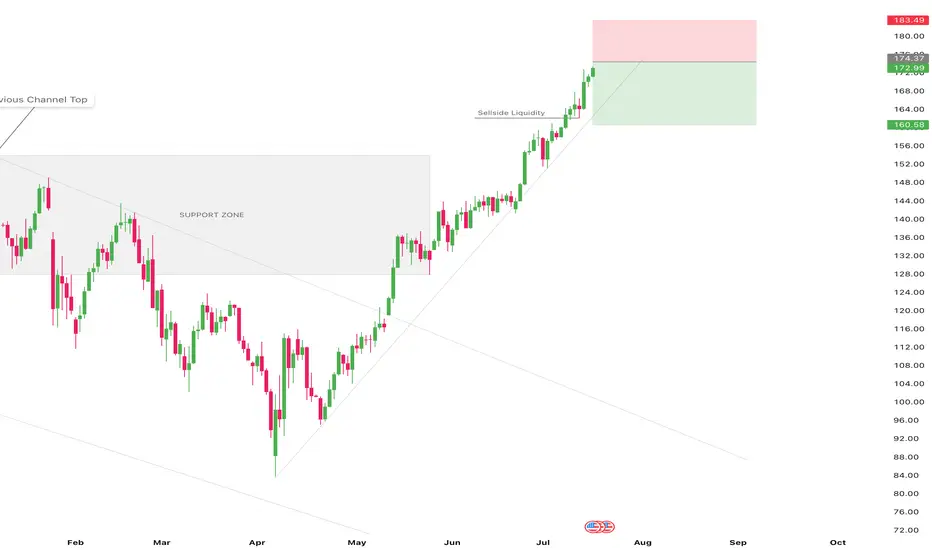
COPPER TECHNICAL ANALYSISCopper spiked into 5.8750 but is now consolidating just below short-term resistance at 5.6448, showing signs of a bullish continuation pattern. Price remains supported at the 5.4864 zone.
Currently trading at 5.4864, with
Support at: 5.4864 / 5.3157 / 4.9929 🔽
Resistance at: 5.6448 / 5.8750 🔼
🔎 Bias:
🔼 Bullish: Break above 5.6448 could push price toward 5.8750 and beyond.
🔽 Bearish: Loss of 5.4864 may trigger downside toward 5.3157.
📛 Disclaimer: This is not financial advice. Trade at your own risk.
$NQ Supply and Demand Zones - All Time High! 7/17/25This chart is for SEED_ALEXDRAYM_SHORTINTEREST2:NQ only.
We recently hit ATH this AM session and now price is accumulating and we are waiting to see what it wants to do next. Continue to hold support at ATH before we breakout higher, or break below and close below ATH support for a retest lower?

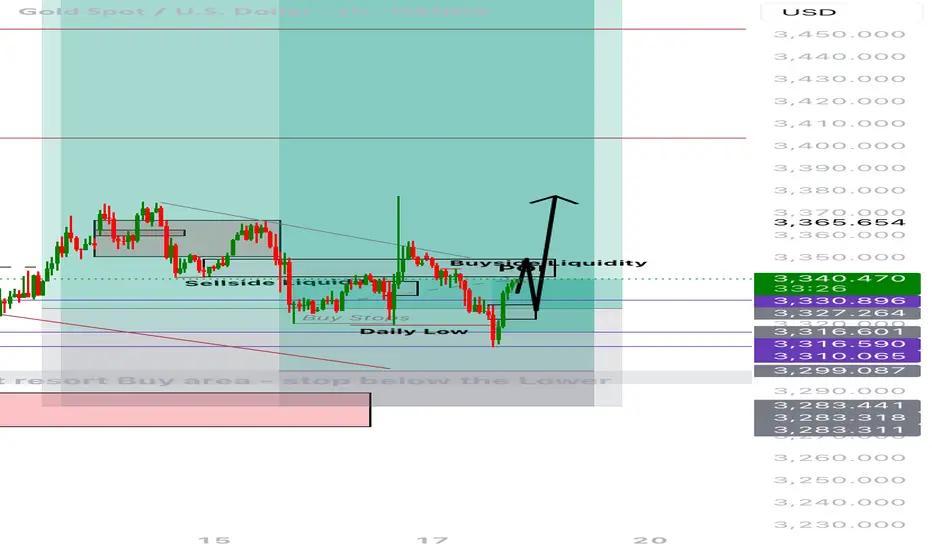
Re-attempt to buy?Trade Journal Entry – XAUUSD (Gold Spot)
Date: July 17, 2025
Platform: TradingView (Demo Account)
Timeframe: 1H/4H
Direction: Long Bias
Status: Stopped Out – Awaiting New Setup
Result of Last Trade: +£33
New Plan: Wait for buy opportunity in Asian or London session
Previous Trade Outcome
Entry was valid at POI based on bullish setup logic.
Trade failed to break structure to the upside convincingly.
Stop-out occurred after price pushed below mitigation zone (~3,316).
However, due to early partials and trade management, the result was a net profit of £33.
Updated Outlook
Price has rebounded aggressively from just below Daily Low.
Current price near 3,339.305 — strong push back into prior structure.
Buyside liquidity and POI overhead acting as short-term magnet.
Ideal pathing (marked with black arrows):
→ Sweep POI
→ Retest structure (likely near 3,327–3,330)
→ Continuation toward 3,365+, targeting liquidity void above.
Entry Plan
Await price to revisit POI, potentially after liquidity run.
Ideal confirmation setup:
- SFP or bullish engulfing on M15–H1
- Volume divergence or re-accumulation pattern
Target entry during Asian or early London session when liquidity is typically engineered.
Management Approach
- Keep risk tight on re-entry (0.5% max risk)
- SL below new HL formed during retest
- TP: 3,365 / extended 3,380–3,390 depending on session follow-through
- If no clean retest, skip trade — don’t chase
Emotional Reflection
Felt more in control than previous attempts. Took the stop like a professional.
No revenge trades — staying focused on structure and quality.
Grateful that proper risk management led to a small win despite being stopped out.
Reflection Questions
- Did I adjust my expectations quickly once structure failed?
- Am I giving the market enough space and time to form clean entries?
- Will I stay patient for session-specific setups?
GBPCAD – Key Level, Buy Setup & Dual StrategyRight now, price is sitting on a major level.
📌 If a valid buy signal shows up, I’ll enter a long position.
But that’s not all…
🔁 If price reaches the next resistance level, I’ll:
Hold my long position
Open a short position there
This way: ✅ If price reverses → my long trade is closed by trailing stop
✅ And my short trade runs into profit
→ I profit both from below and above
⚠️ If my short trade’s SL hits, no worries —
My long is still open and growing in profit.
📈 But if the resistance breaks and we get a pullback,
➡️ I’ll activate pyramiding and build more position with zero added risk.

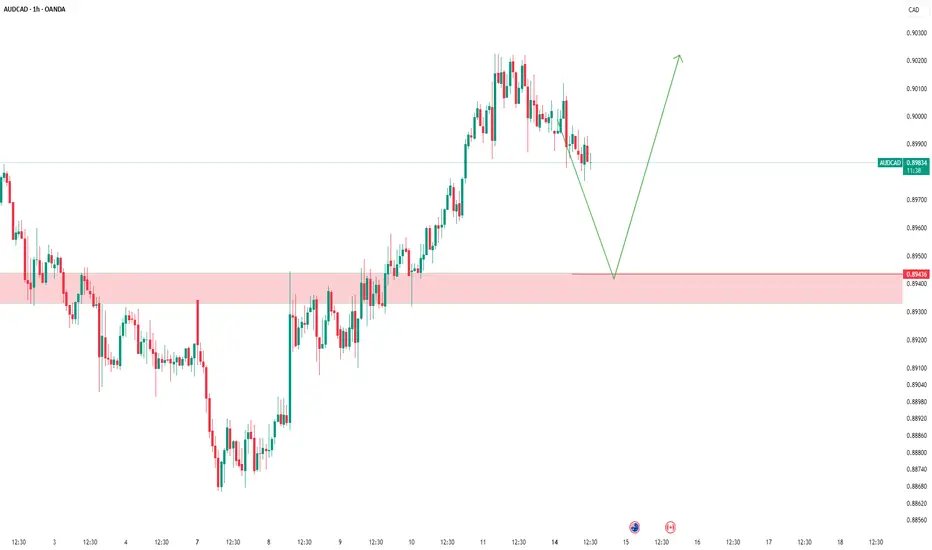
AUDCAD - Possible Buy Setup AheadThe market is approaching a significant zone.
We’re standing by — no rush, no guessing.
If a clean bullish signal appears, we go long.
If it breaks through, we wait for a pullback and adapt.
Our job isn’t prediction — it’s reaction.
Follow the plan. Let the profits take care of themselves
Gold Holding Demand — New Buy Setup FormingThe demand zone on the higher timeframe is still holding, and price is starting to move higher.
A new buy opportunity is forming upon the break of the downward trendline.
gold analyse*The content on this analysis is subject to change at any time without notice, and is provided for the sole purpose of assisting traders to make independent investment decisions.
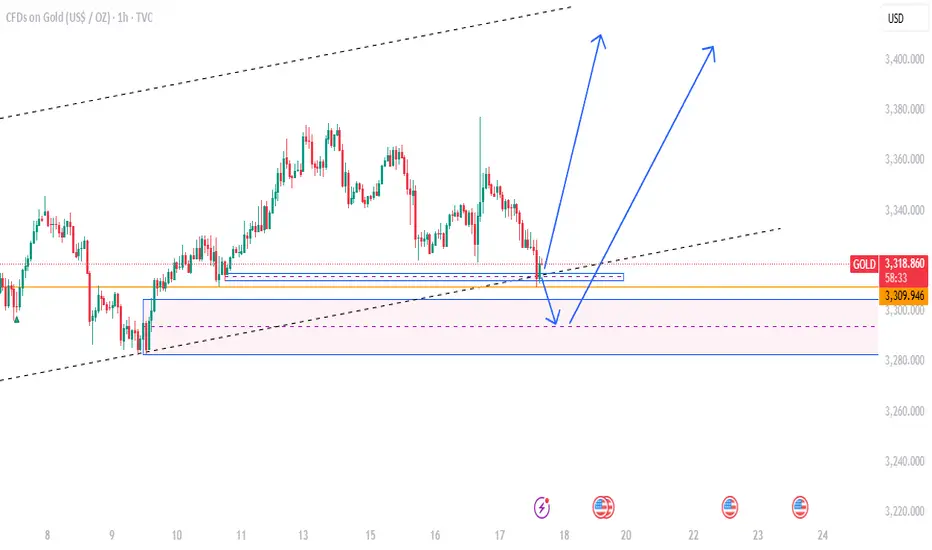
Gold Ranging Between HTF Zones — Buy Setup FormingHello everybody!
Price is fluctuating between two higher timeframe supply and demand areas.
The market structure on the lower timeframes changed yesterday, and now we’re watching to see if the newly formed small demand zone will hold.
The break of the downward trendline is our signal to enter a buy position.
Trade Setup: EUR/USD 15min | OB Mitigation Play⚙️ Type: Countertrend (Risk-managed Buy)
Direction: Long
Entry Zone: 1.15850–1.15886 (Refined OB)
Entry Type: Buy Limit
Stop Loss: Below the OB low → 1.15790
Take Profit Targets:
TP1: 1.16043 (minor imbalance fill)
TP2: 1.16140 (supply zone re-test / 50% fib)
Risk to Reward: ~1:3 minimum (depending on fill and management)
🎯 Why This Setup Works
Price swept sell-side liquidity into a refined OB from the CPI move.
Confluence with 0.786 retracement, suggesting algo entry interest.
Strong momentum imbalance above gives room for retracement pullback.
DXY showing signs of short-term exhaustion at intraday highs.
🔒 Invalidation Criteria
15m candle close below 1.15790
Clean break and hold of OB low → Flip bias bearish

AUDNZD - Short-Term Pullback Expected from Key ResistanceAUDNZD - Short-Term Pullback Expected from Key Resistance
📈 Setup Overview:
AUDNZD has been trending bullish but has now reached a critical resistance level that aligns with the upper boundary of the ascending trendline. This confluence suggests a potential short-term pullback opportunity.
🔍 Analysis:
Strong bullish wave structure intact
Price testing key resistance + ascending trendline upper boundary
Expecting retracement toward trendline support
Overall bullish structure remains favorable for continuation after pullback
📊 Trade Details:
Entry: Sell Stop at 1.091745
Risk Management: 1:2 Risk-to-Reward Ratio
Bias: Short-term bearish pullback within larger bullish trend
⚠️ Risk Disclaimer: This is not financial advice. Trade at your own risk and always use proper position sizing.

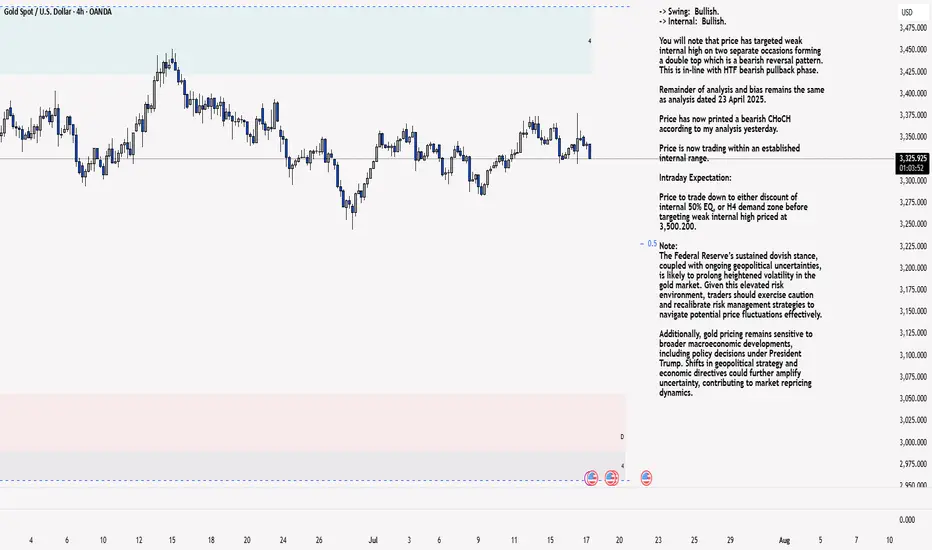
XAU/USD 17 July 2025 Intraday AnalysisH4 Analysis:
-> Swing: Bullish.
-> Internal: Bullish.
You will note that price has targeted weak internal high on two separate occasions forming a double top which is a bearish reversal pattern. This is in-line with HTF bearish pullback phase.
Remainder of analysis and bias remains the same as analysis dated 23 April 2025.
Price has now printed a bearish CHoCH according to my analysis yesterday.
Price is now trading within an established internal range.
Intraday Expectation:
Price to trade down to either discount of internal 50% EQ, or H4 demand zone before targeting weak internal high priced at 3,500.200.
Note:
The Federal Reserve’s sustained dovish stance, coupled with ongoing geopolitical uncertainties, is likely to prolong heightened volatility in the gold market. Given this elevated risk environment, traders should exercise caution and recalibrate risk management strategies to navigate potential price fluctuations effectively.
Additionally, gold pricing remains sensitive to broader macroeconomic developments, including policy decisions under President Trump. Shifts in geopolitical strategy and economic directives could further amplify uncertainty, contributing to market repricing dynamics.
H4 Chart:
M15 Analysis:
-> Swing: Bullish.
-> Internal: Bullish.
H4 Timeframe - Price has failed to target weak internal high, therefore, it would not be unrealistic if price printed a bearish iBOS.
The remainder of my analysis shall remain the same as analysis dated 13 June 2025, apart from target price.
As per my analysis dated 22 May 2025 whereby I mentioned price can be seen to be reacting at discount of 50% EQ on H4 timeframe, therefore, it is a viable alternative that price could potentially print a bullish iBOS on M15 timeframe despite internal structure being bearish.
Price has printed a bullish iBOS followed by a bearish CHoCH, which indicates, but does not confirm, bearish pullback phase initiation. I will however continue to monitor, with respect to depth of pullback.
Intraday Expectation:
Price to continue bearish, react at either M15 supply zone, or discount of 50% internal EQ before targeting weak internal high priced at 3,451.375.
Note:
Gold remains highly volatile amid the Federal Reserve's continued dovish stance, persistent and escalating geopolitical uncertainties. Traders should implement robust risk management strategies and remain vigilant, as price swings may become more pronounced in this elevated volatility environment.
Additionally, President Trump’s recent tariff announcements are expected to further amplify market turbulence, potentially triggering sharp price fluctuations and whipsaws.
M15 Chart:
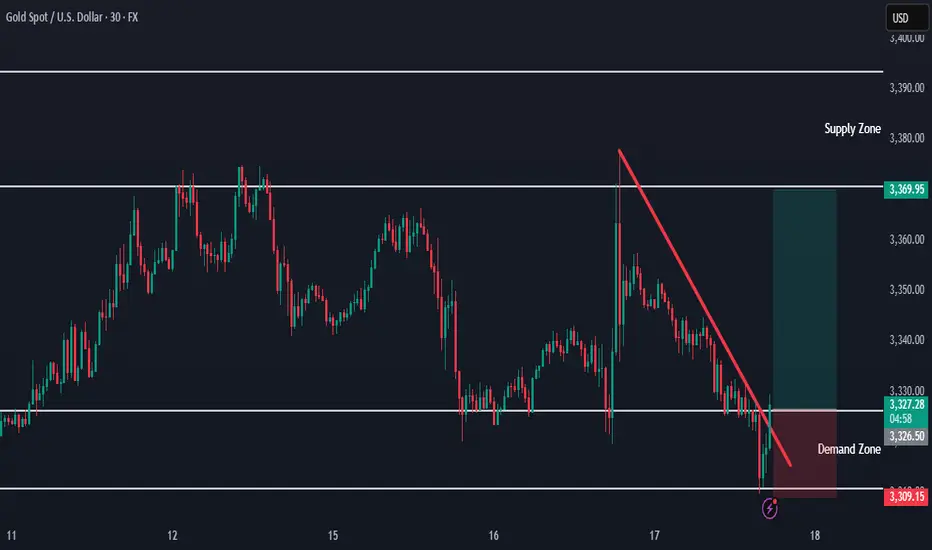
gold sellsGold sells from 3340
Trying to flow with price
Idk what else to write lol tradingview keeps saying its a brief description
closed at 3332

Bitcoin Buy analysis/ideaThis analysis is based on the 4-hour and 1-hour timeframes and executed using Supply and Demand trading and trend formation. Complete explanation in the video!

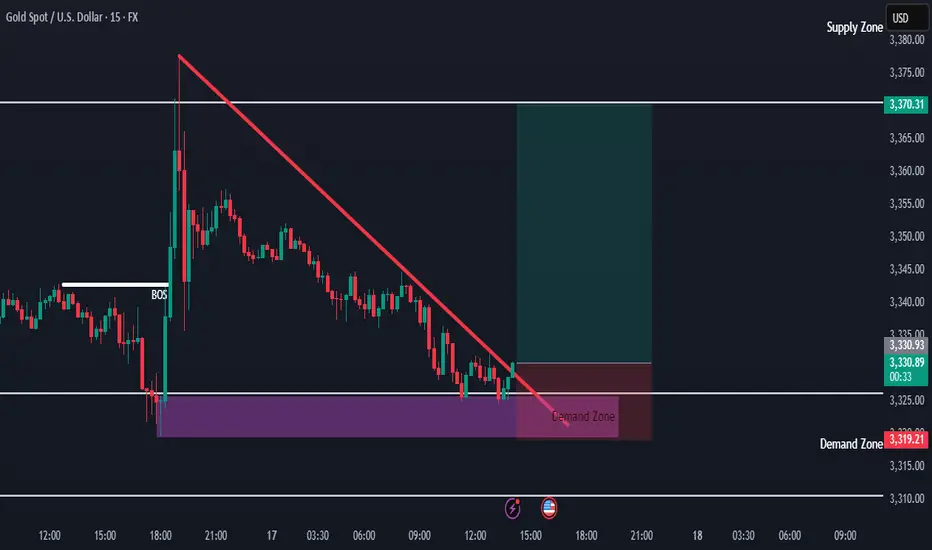
Gold Trade Setup Eyes on 15M Demand ZonePrice is coming close to 3338, where we have a 15-Minute Order Block (OB) 📍. This is a fresh demand zone and can give a bullish reaction when price taps into it 🟢.
📌 Plan:
We will wait for price to tap the OB ✅
If we see bullish signs like rejection wicks or bullish candles, we will enter a buy 📈
Our target will be near 3366, just below the bearish FVG 🎯

DOGE Short SetupTight SL, 1:3 Risk-Reward.
We might go higher, but current key levels and price actions tells me to go short setup.

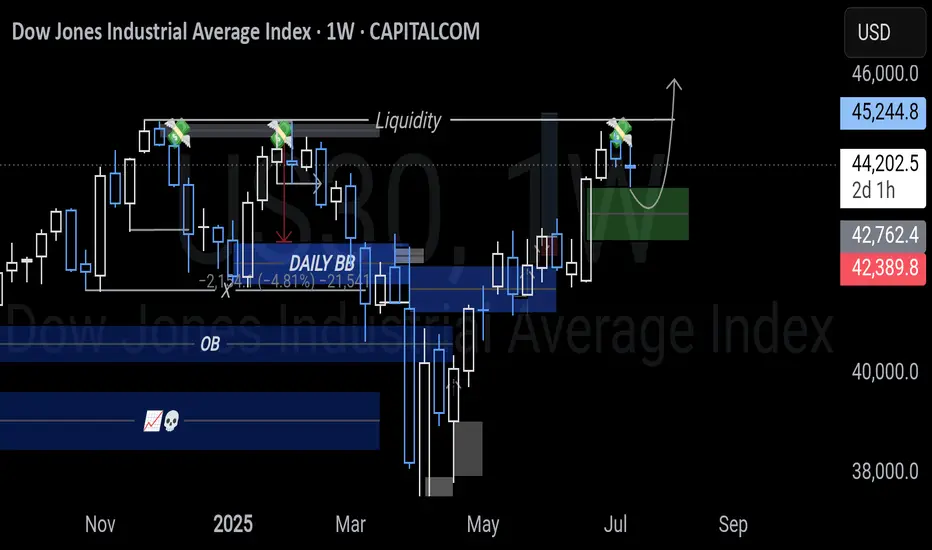
US30 DOW BULLISH ANALYSIS Triple tops are the next liquidity targets from a fvg support as shown. the tops are week as we have seen NASDAQ and S&P500 hav3 liquidated their highs its. Lear US30 is following the same path.
GBPUSD - Is it Ready? Looking at GBPUSD
We have had a Market shift to the upside from a HTF Point of Interest. I am now waiting for price to come back into a 15min demand area and hopefully price will take off to the upside from here.
We have also swept liquidity before a drastic move to the upside.
Lets see how this one plays out
[$CLSK] CleanSpark Inc. - Farming [$BTC] LongNASDAQ:CLSK
no finanical advice
📑market outlook
+ Fed rate cut priced in --> short term risk-on environment
+ total FIAT-debasement in motion --> Precious &Crypto are poomping
- geo-political risk can drag down the 'weaker ANTI-Fiat' risk-on positions
💡idea
we want to farm BTC indirectly by selling covered-calls /placing cash secured puts
🧪approach
derivatives options with i.e. 0.1 BTC ~ 10,000 USD
🏁target
get 2% yield per month
⚠️ caution
Only weekly options: --> Crypto Cycle could take hits of -50% which would basically demolish your position
--> check weekly volume/sentiment on BTC
Don't forget:
⏳ Theta is our alley. Always have been!

Potential buys?Trade Journal Entry – XAUUSD (Gold Spot)
Date: July 16, 2025
Platform: TradingView (Demo Account)
Timeframe: 4H
Direction: Long
Status: Active, In Profit
Unrealized Profit: +301.54 GBP
Entry: ~3,327
Stop Loss: Below 3,316 zone
Take Profit (TP): ~3,492
Risk:Reward Estimate: ~1:4 or better
Market Context
Previous pullback into the sell-side liquidity and POI zone held firmly.
Price rejected from POI and aggressively moved upward, confirming bullish order flow.
POI (Point of Interest) is marked intentionally — awaiting a return to the zone after price closes above the wick.
A full buy confirmation is expected only upon a bullish close above the wick, followed by a retest into the POI.
Trade Logic
Trade was initiated based on:
- Break of market structure (BMS)
- Sweep of sell-side liquidity
- Bullish intent shown via momentum candles
- Expectation: price returns to POI after wick close for full confirmation
Management Plan
- Consider partial TP at 3,365–3,375 zone.
- Trail SL below latest higher low on lower TF.
- Wait for price to revisit POI after close above wick before scaling in full size.
Emotional Reflection
Feeling composed. The trade plan is well-structured with a POI-based confirmation strategy. No rush to fully size until POI is respected post-wick close.
Reflection Questions
- Did I stick to my POI confirmation logic?
- Am I patient enough to wait for a close above the wick?
- Is my entry risk properly managed while awaiting confirmation?

GBPJPY in Premium Zones of 2008 Financial Crisis - {17/07/2025}Educational Analysis says that GBPJPY (FX pair) may give trend Trading opportunities from this range, according to my technical analysis.
Broker - FXCM
So, my analysis is based on a top-down approach from weekly to trend range to internal trend range.
So my analysis comprises of two structures: 1) Break of structure on weekly range and 2) Trading Range to fill the remaining fair value gap
Will Jpy start to lose value like it is doing since 2019 or it will do free fall same like 2008 crisis.
Let's see what this FX pair brings to the table for us in the future.
Please check the comment section to see how this turned out.
DISCLAIMER:-
This is not an entry signal. THIS IS FOR EDUCATIONAL PURPOSES ONLY.
I HAVE NO CONCERNS WITH YOUR PROFIT OR LOSS,
Happy Trading.
