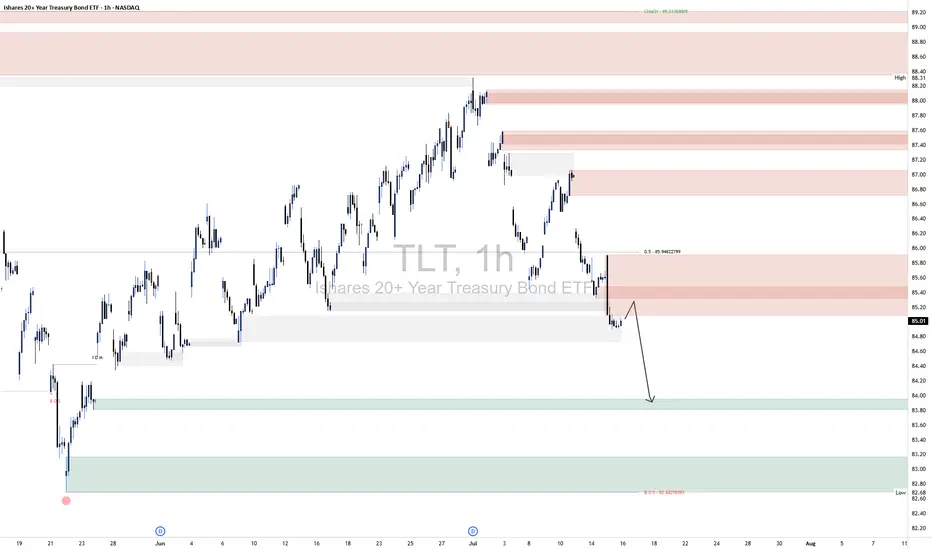
TLT ShortTLT 1H Technical Analysis
📈 Outlook:
The current setup suggests a bearish continuation scenario:
A corrective move toward the 85.20–85.60 supply.
Rejection from this area confirms continuation of the downtrend.
Target: 83.20–83.60, where resting liquidity and untested demand reside.
This sequence follows a classic liquidity sweep + supply mitigation + continuation pattern. Unless price breaks convincingly above 85.80, the bearish outlook remains intact.
🔼 Supply Zones (Bearish Liquidity Layers):
Primary Zone: 85.20–85.60
This is the most immediate area of interest, aligning closely with the 50% equilibrium level of the last bearish impulse (~85.84). Price is likely to reject from here as it also coincides with a previously unmitigated supply block and market inefficiency.
Stacked Supply Above: 86.40–88.00
Should price break the lower supply, these zones will come into play. However, the current structure suggests strong probability of rejection before reaching these levels.
🔽 Demand Zones (Target Areas):
First Demand: 83.20–83.60
This is your marked initial downside target. It represents the next logical draw on liquidity and aligns with prior accumulation and support structure. It’s likely to act as a temporary reaction zone or the next entry point for accumulation.
Deeper Demand Zone: 82.40–82.80
Marked by your secondary border, this range offers higher time-frame confluence and could act as the final sweep zone if the 83s fail to hold.
Supply and Demand
XAUUSD 1HXAUUSD 1H Technical Analysis
📈 Expected Scenario:
Your projection implies the following:
Short-term pullback into the 3,305–3,315 demand zone.
A bullish reversal from this level, supported by price structure and prior demand imbalance.
Upside targets: First at 3,365 (minor supply), then extension toward 3,385–3,400.
This view is technically valid, as the market seems to be collecting liquidity below intermediate lows while maintaining structural integrity.
📌 Key Zones ("Your Borders"):
🔽 Demand Zone (Support)
Location: 3,305 to 3,315
Purpose: Your chart illustrates this as the primary reaccumulation zone. It aligns with a mid-structure demand zone and could serve as the launchpad for the next leg up, especially if paired with bullish order flow or volume confirmation.
Below this: A deeper, stronger demand lies around 3,285–3,295 (also marked by your 0.5 level at ≈3,286.14), which may act as a final liquidity grab zone before continuation.
🔼 Supply Zones (Resistance)
Lower Supply: 3,355–3,365
Upper Supply: 3,375–3,385
These zones represent potential profit-taking areas for any longs initiated at the demand. A breakout above 3,385 would suggest a continuation toward the 3,400–3,420 macro resistance.

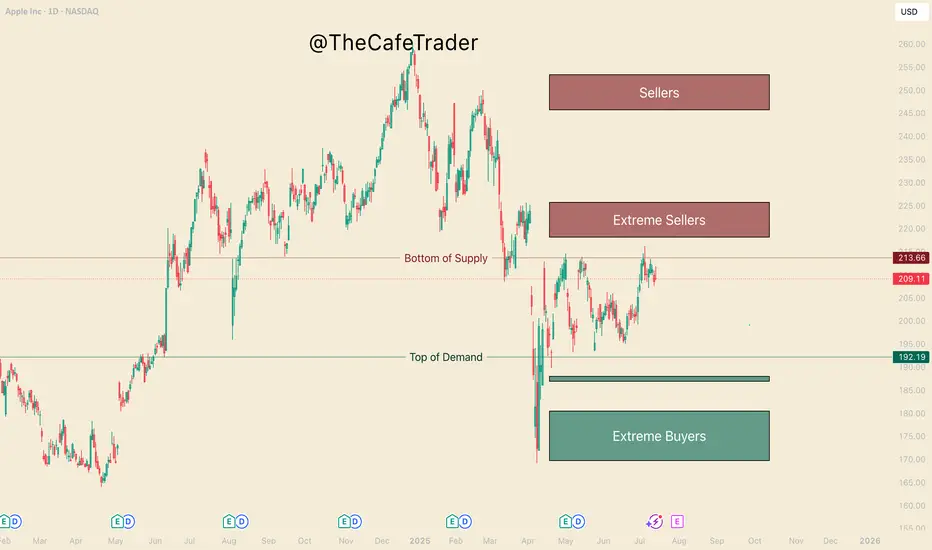
APPL, Get Yourself a Good PriceHello This week we are breaking down the MAG7 starting with Apple.
This analysis is an aid to help you:
1 Find good price to add to your long term.
2 Hedge your current position.
3 Make a swing trade (we will touch on options pricing as well).
Currently Apple is 1 of 5 of the MAG 7 that had not gained a new high since Trump and the tariff scares. Many analysts have given their predictions on where Apples fair value lies and these vary. What they will not tell you is where the institutional buyers and sellers are. Not to worry, this is where we come in
Big Buyers and Big Sellers
On the chart in front of you, take a look at the 3 different buy and sell zones (otherwise known as supply and demand zones). We find these areas in using a system similar to "imbalances" if you are familiar with the footprint chart, or orderflow. If you had no idea what any of that means, not to worry, I've done the work for you.
-The lines represent the fringe of real liquidity . Using this we will be able to help you find how and when you can find a good price for your long term.
- Buyers/Sellers: strong motivated liquidity.
- Extreme Buyers/sellers Extreme demand, this is an area you could consider a steal.
1 How do you find good pricing?
Simply put - Buy with the buyers and sell with the sellers.
If you are wanting to add to your long term here are the prices. Do you want to get in ASAP? or are you willing to wait for what could be a great deal. This is important as the end of the year can greatly depend on not just picking a good stock, but finding a great price.
Buying
Fair - 192
Good - 188-187
GREAT - 180-169
Now if you are in, and maybe you want to hedge the downside (you can do this by shorting the stock, or buying put options (even more in depth you can do spreads).
For now we will just focus on Buying Put options and taking profit for swing traders.
The Burgundy line "bottom of supply" previously rejected this area twice before (May 1st, and May 14th). July 7th marks the 3rd rejection. It's important to note that the last test pushes a new high, this shows a bit of weakness from the sellers.
This weakness suggests we may see the 218-225 Sellers get tested before it comes down. The question is, How strong will the buyers be coming into this zone.
If they are aggressing this area with new REAL buyers, Then we may see this run through all these sellers and continue to run until the 245 area. If we do not find real buyers here, then likely we will reject to the pricing marked previously.
If you are holding APPLE, you can look to hedge with puts at the end of the 220-223. Since you are looking at about 5-7% downside from apple if the sellers are strong here, look to only spend 2-3% of your apple worth on puts. look for maybe 2-3 weeks out if possible.
Secondly if APPL does make a bull run to 245 you can mark this area again to hedge short term puts. look for 8-10%+ downside puts 3-4 weeks out (roughly 3-5% of your apple size)
Hedging can be very useful in wanted to keep your long term and navigate some of the ebbs and flows of the market. Notice that the risk of your puts, 2-3% & 3-5%, is half of the expected reaction from these areas. if you get a big rejection, expect these options to pay well.
NOTE: If you do not understand the implied volatility (IV's) change the price of options, it is recommended that you stay away from options until you have sufficient experience. It's also important to know how to find a good strike price, and how to know if you are getting a good price. I will be breaking down options pricing in a different time.
That's all for Apple, Stay tuned for the rest of the MAG 7!
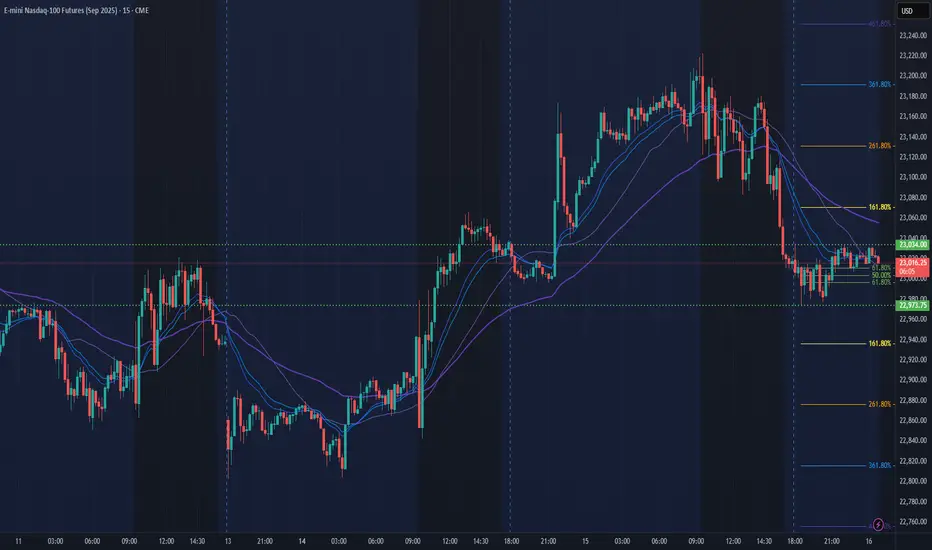
NQ Power Range Report with FIB Ext - 7/16/2025 SessionCME_MINI:NQU2025
- PR High: 23034.25
- PR Low: 22973.75
- NZ Spread: 135.5
Key scheduled economic events:
08:30 | PPI
10:30 | Crude Oil Inventories
AMP margins raised overnight for expected PPI volatility
Session Open Stats (As of 12:25 AM 7/16)
- Session Open ATR: 277.22
- Volume: 27K
- Open Int: 277K
- Trend Grade: Neutral
- From BA ATH: -0.8% (Rounded)
Key Levels (Rounded - Think of these as ranges)
- Long: 23239
- Mid: 21525
- Short: 20383
Keep in mind this is not speculation or a prediction. Only a report of the Power Range with Fib extensions for target hunting. Do your DD! You determine your risk tolerance. You are fully capable of making your own decisions.
BA: Back Adjusted
BuZ/BeZ: Bull Zone / Bear Zone
NZ: Neutral Zone
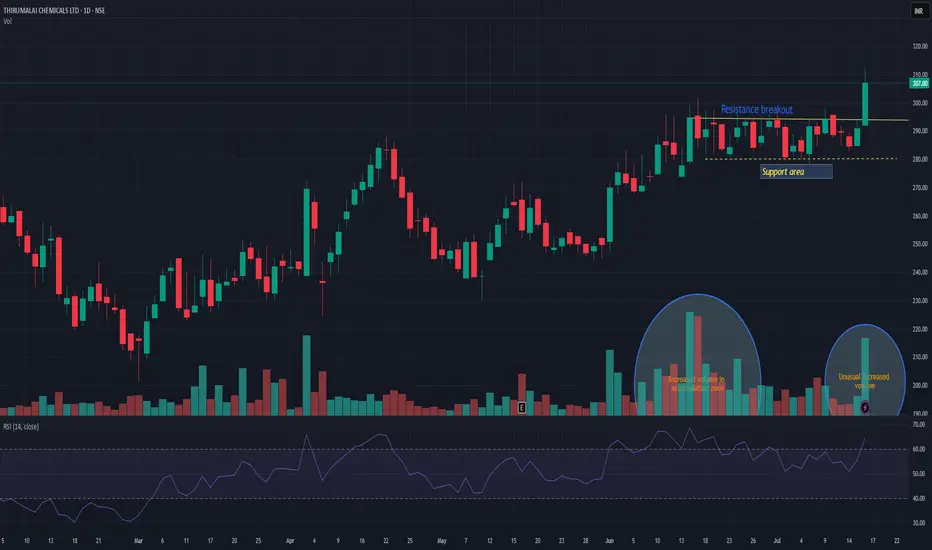
TIRUMALCHMTIRUMALCHM has given resistance breakout with decent volume. Another good thing is unusual volume increased in accumulation zone. Support can be seen near 280 levels. There is high probability that this time it may push the stock in to trend change and may take momentum to the next level. Keep it on radar.
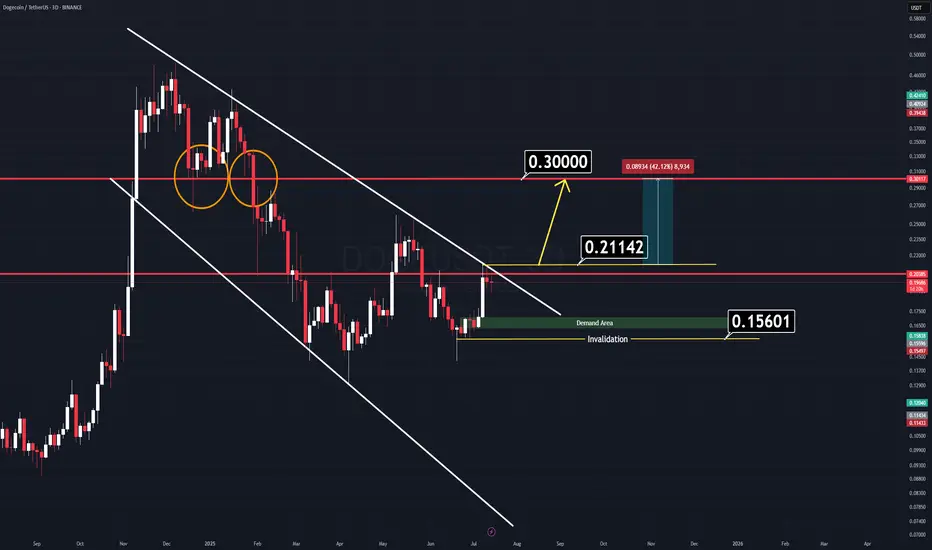
DOGE Analysis (3D)There’s a very simple and clear chart setup on Dogecoin (DOGE) right now.
We have two major horizontal key levels and a channel that is about to break down. If the price manages to close above the yellow-marked line ($0.21142), we can expect a strong rally to follow.
There’s no need for complicated indicators cluttering the screen — all relevant levels are clearly marked on the chart.
Two Logical Entry Approaches:
1️⃣ Breakout Entry: Enter on a confirmed breakout. (Waiting for a daily candle close on a memecoin might slightly reduce your profit range, but it’s the safer approach.)
2️⃣ Demand Zone Entry: Wait for the price to retrace to the green demand zone — though this scenario seems less likely for now.
A combined approach can work best: enter on breakout, use the horizontal levels as support, and set a tight stop-loss to manage risk.
Good Luck.
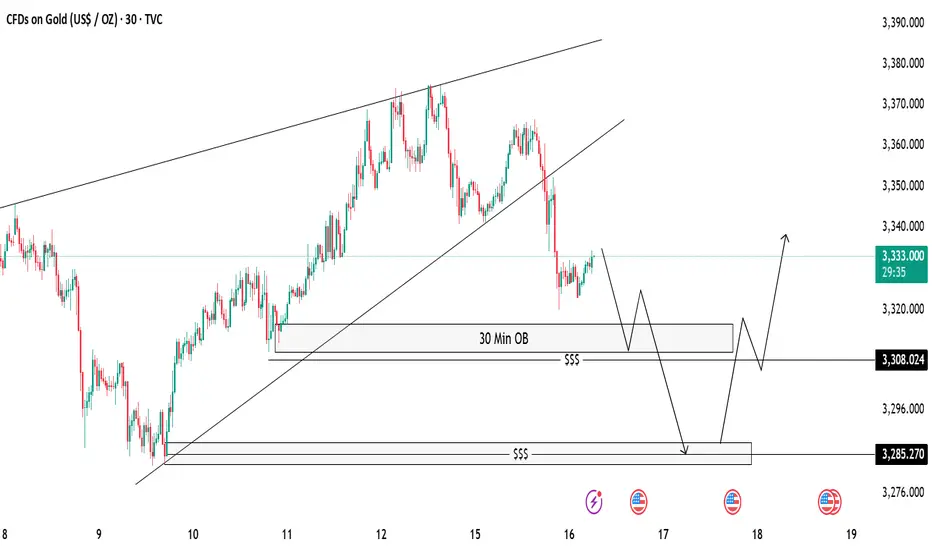
Gold 30-Min OB Analysis – Bounce or Drop..?Gold is showing a break of structure after a big sell-off 🔻. We have marked a 30-Minute Order Block (OB) 📍 which can act as a possible reaction zone.
📌 Two Scenarios We Are Watching:
✅ Scenario 1 (Bullish):
If price taps into the 30M OB and shows bullish rejection 🟢, we can look for buy opportunities, targeting the previous highs near 3335-3340 🎯.
❌ Scenario 2 (Bearish):
If price fails to hold the OB, we will watch for a liquidity sweep (marked with $$$) and expect price to move lower towards the next demand zone near 3285 📉.
⚠️ Key Notes:
Always wait for confirmation before entry.
Patience is the key 🧘♂️ — let the market come to us.
HOOD - Get Great PricingNASDAQ:HOOD and I have had a mixed relationship over the years. I have had my biggest win on the HOOD brokerage (5,000% options trade, $1200 into 60k) and at the same time I was present for the Derogatory removal of the GME button (of which I had sold before they took that button).
After many years and brokerages, I find myself returning to HOOD but this time much more experience... To my surprise, I love the platform, and I still recommend it for new traders for the ease and UI. Honestly, unless you are dealing with BIG Volume or Hot-Keying out of Low float Penny stocks, It will suit you just fine.
Now Let's Talk HOOD.
In this MASSIVE range we are looking at High $67, and a Low of $35. Thats a 47% drop!
Although we have recovered a bit, Many are eager to find a way to get in the range. Here I have put together 2 scenarios to help you play your position with confidence.
Better Price = Better psychology
Whether we are shopping at grocery store, or if we are buying a car. Getting a good deal feels better. But how do you feel when you know you overpaid?
TLDR: The best deals are the lowest purple zone "Extreme Demand" if you are Long, "Reinforced Supply" (at the top) if you are looking to get short or take profit.
Under the HOOD
Currently Robinghood is running into a little bit of a supply zone labelled "Weak Supply"
This is a new player, and we don't yet know how just how big this player is. So far they have absorbed some of that buying pressure coming in, but I would not be surprised if they we overtaken or even gapped above come Monday. This brings us to our first Scenario
Scenario 1: Blue line
With the break above "weak supply", there is headroom all the way until 51.74. This is where we will see some supply initially and maybe a small rejection.
Why would it not reject back down to a demand area like 41? Great question.
If this overtakes that "Weak Supply" zone, this will make a strong case that there is momentum behind the wheels here. I think there will be a new player reinforcing this buying if this happens all the way to the Finale at $58.01. From here I would consider taking some profits, maybe partials, or looking for some Puts.
Scenario 2: Red line
Getting Rejected by "Weak supply" would be evidence that this move was fluff. Those two demand zones may try to hold a bit, but with the lack of buying interest in the
$45 area, this won't make those buyers feel confident.
This is different story when comparing to the "Extreme Demand" zone (lowest purple zone). Buyers here have PROVEN that this is something they are very interested and they are not done accumulating yet. So from this location buyers feel confident that they are getting a good price*( see fn. )
From here this should drive demand up again, crushing shorts, and sending another nice squeeze to test that supply at 51.71
WHEW! if you made it this far, I appreciate your time!
Upvote/Follow if you enjoyed this idea, there are many more to come!
Happy trading!
* (This is a good price, because buyers are showing that it is. Although, if it did come down here, this would be the 4th test of this area. I still think there will be strong demand here, but this isn't the best tests. 2nd and 3rd were stronger.)

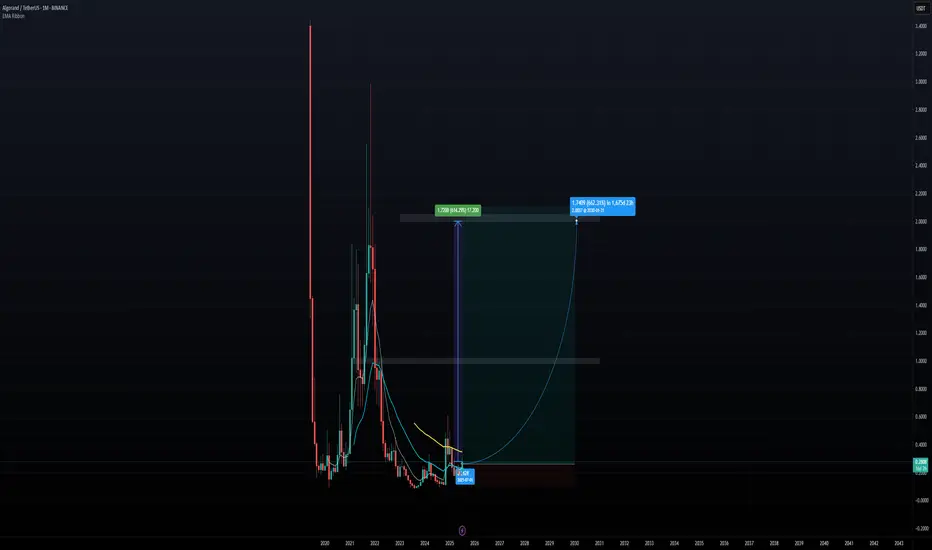
ALGORAND - LONG TERM BUY OPPORTUNITY, BEST ENTRY PRICE, 600%+ALGORAND (ALGO) is one of the layer 1 blockchain platform's that is compatible with ISO 20022. ISO 20022 is a global standard for financial messaging that aims to standardize electronic data exchange between financial institutions. Some speculate whether this is applicable or not long term, however the narrative still exists, so along with other ISO 20022 cryptos such as XRP, this can mean a nice place to park some capital in crypto. Conservatively, Algorand can touch $1.00 long term and then potentially $2.00 especially if any announcements, collaborations or other catalyst arise. Algorand is working towards quantum resistance, and that's also a selling point for the blockchain. Gary Gensler once praised Algorand and take that with what you must, but that doesn't hurt when former SEC Chairman shills a crypto project.
GBPJPY is in the Down Trend From Resistance LevelHello Traders
In This Chart GBPJPY HOURLY Forex Forecast By FOREX PLANET
today GBPJPY analysis 👆
🟢This Chart includes_ (GBPJPY market update)
🟢What is The Next Opportunity on GBPJPY Market
🟢how to Enter to the Valid Entry With Assurance Profit
This CHART is For Trader's that Want to Improve Their Technical Analysis Skills and Their Trading By Understanding How To Analyze The Market Using Multiple Timeframes and Understanding The Bigger Picture on the Charts

EURUSD is Bearish After Breaking Regression ChannelHello Traders
In This Chart EURUSD HOURLY Forex Forecast By FOREX PLANET
today EURUSD analysis 👆
🟢This Chart includes_ (EURUSD market update)
🟢What is The Next Opportunity on EURUSD Market
🟢how to Enter to the Valid Entry With Assurance Profit
This CHART is For Trader's that Want to Improve Their Technical Analysis Skills and Their Trading By Understanding How To Analyze The Market Using Multiple Timeframes and Understanding The Bigger Picture on the Charts

PVSRA Bitcoin AnalysisMay 08 2025 a bullish candle's parallel volume bar broke the threshold in the below pane; indicating price instability, or unfilled orders if you will. June 22 price returns to that full candle body and dips $500 below it, to feel the opposing force and realize orders have been filled and we are in equilibrium. This set up is usually set up and finished in 1-2 weeks (volume absorption) so this 1.5 month setup was an outlier and a grind that paid off BIG patience and knowing your plan of attack is everything in this game, you have to have a plan for every single variable and NEVER stray.
Present day, a 30 minute candle has broken our volume threshold, and weve moved aggressively away from that magnetic force inevitably pulling price back towards it EVENTUALLY as it did june 22nd. Due to the commonality and the recentness of the move that just happened of 5/8-6/22, we can suspect price pattern will repeat and price will be bid up, from 115-120k, where we will then reverse to 103. The bar pattern from the 5'8 6'22 move was copied, pasted, and retrofitted to current time.
Regardless of the exact pattern of the move we expect price eventually to resolve those orders at the 103 mark and our moves are based in that zone. This seems like a range out as we capitulate these 6 figures whilst remaining in a bull market.

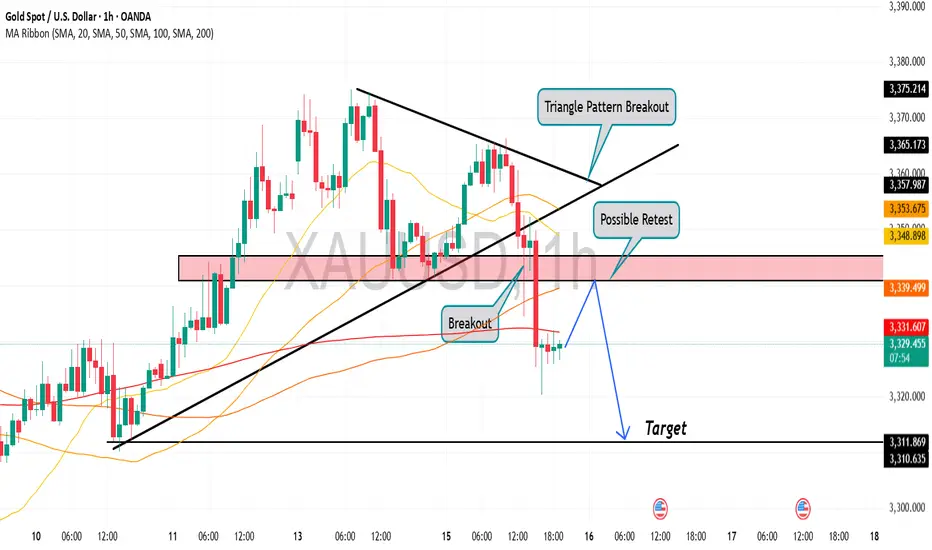
Gold is in the Bearish Direction after Breaking Triangle PatternHello Traders
In This Chart GOLD HOURLY Forex Forecast By FOREX PLANET
today Gold analysis 👆
🟢This Chart includes_ (GOLD market update)
🟢What is The Next Opportunity on GOLD Market
🟢how to Enter to the Valid Entry With Assurance Profit
This CHART is For Trader's that Want to Improve Their Technical Analysis Skills and Their Trading By Understanding How To Analyze The Market Using Multiple Timeframes and Understanding The Bigger Picture on the Charts
FX: XAUUSD set for a bullish legIn XAUUSD, I’m seeing a promising bullish setup that could offer a strong opportunity for upside continuation. The chart shows a breakout from a descending triangle pattern, followed by a clean retest of the breakout zone. What really catches my attention is the confluence of support, where the price is currently reacting to both the former descending trendline and a longer-term ascending trendline. This area, around the 3,320–3,330 level, is now acting as a critical decision point.
I believe this retest could serve as a launchpad for a bullish continuation toward the next key resistance at 3,450. That level has acted as a strong ceiling in the past, and it’s a logical target if the market maintains upward momentum. The higher lows forming since May suggest growing buying pressure, reinforcing the bullish bias.
Of course, this setup isn’t without risk. If price breaks below this confluence zone, we may see a return to the previous range or a deeper correction. But for now, I’m leaning bullish, especially if we get a strong bullish candle or increased volume confirming the bounce.
I’ll be watching closely and updating if conditions shift, but for now, XAUUSD looks poised for another leg up.

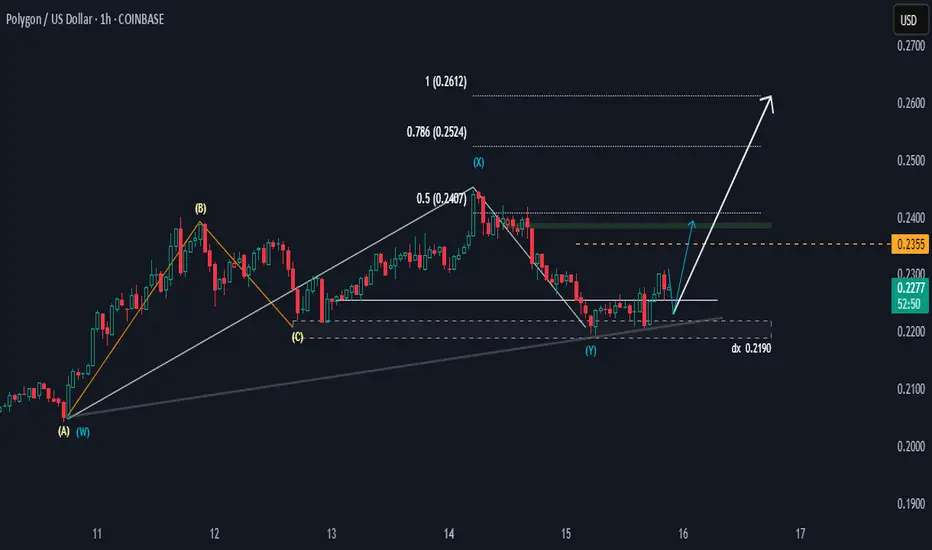
MATICUSD Bullish OutlookHi
MATICUSD is likely to pulse down and push up to 0.2355 for a bias of 0.2355.
We could also see a price rally up to 0.2524 and 0.2612, provided the 0.2190 holds; if not, then the setup will be invalid.
Happy trading,
K.
$NQ Supply and Demand Zones 7/15/25This for sharing my S/D zones for SEED_ALEXDRAYM_SHORTINTEREST2:NQ specifically.
EURUSD Potentially BearishHi there,
EURUSD appears bearish at H1 and needs to break the dashed green trend line for a price target of 1.16511 for a bias of 1.16373.
Happy Trading
Not trading advice.

XAUUSD Looking to test the LowsHi there,
XAUUSD H1 looks bearish below a diagonal resistance and needs to break the yellow line for a bearish continuation toward 3304.61 for a bias of 3273.41.
It is possible for the price to spike up to the 3334.77 or 3360 inflection points.
Nonetheless, the daily momentum indicates that it will sustain the present momentum.
Happy Trading,
K.

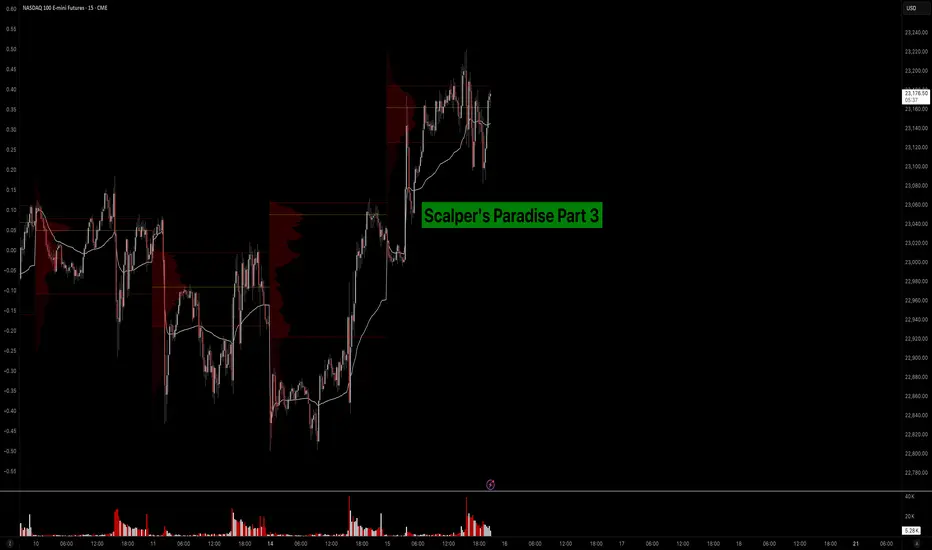
Scalper’s Paradise Part 3 – The Power of Order Flow and DOMWelcome back to Scalper’s Paradise! In this third part of the series, I want to take you into one of the most powerful tools in professional trading: Order Flow and the Depth of Market (DOM).
I chose this topic because during my time as an institutional trader, this was our entire world. We didn’t use indicators. We didn’t guess. We traded exclusively based on what we could see happening live in the DOM and Time & Sales. Every decision was made tick by tick, based on real market activity.
That experience shaped the way I view markets forever—and today, I want to share that perspective with you.
What Is Order Flow, Really?
To me, Order Flow is the most honest information the market can give you. It doesn’t predict, it reveals. It shows who is actually making moves right now. When I was sitting at my institutional desk, I didn’t look at moving averages or oscillators. I looked at who was being aggressive: were market buyers lifting offers, or were sellers smashing the bid?
Watching the tape (Time & Sales) and the footprint chart was like watching a fight unfold in real time. No filters, no guesses. Just raw interaction between buyers and sellers. That’s where real decisions are made.
The DOM: My Daily Reality as a Trader
The DOM (Depth of Market) was the first thing I looked at every morning, and the last thing I closed at night. It shows all visible limit orders resting at each price level. But there’s a catch: not everything you see is real.
In the institution, we were trained to spot real interest versus manipulation. Stacked bids might look strong, but if they disappear the moment price drops tells you that there was never a true intent. Iceberg orders were more interesting, when price gets hit again and again and doesn’t move, that usually meant someone was absorbing quietly.
Reading the DOM is like reading an X-ray of the market’s intentions. And yes, there’s a lot of noise, a lot of deception. But once you learn to read through it, it’s the most powerful tool you’ll ever have.
How We Used Order Flow on the Institutional Side
At the institution, we never chased price. That was rule number one. We let the market come to us (meaning: we used Limit Orders as often as possible) and we used Order Flow to guide every decision.
One of the most important concepts was absorption . If we needed to build a large long position, we didn’t just slam the ask. We would let sellers come in and hit our bids again and again and again. If price didn’t break lower, that told us we were in control.
On the flip side, when we needed to move the market , we switched gears. We used market orders aggressively to push through key levels, forcing reactions, triggering stops, and creating follow-through.
And yes, there were times when we intentionally created traps . We’d push price into obvious zones, make it look like a breakout, then fade it, because we knew how the market reacts afterwards. Order Flow was the only way to read those games in real time.
How You Can Use This as a Retail Trader
I know what you might be thinking: “I’m just a retail trader, how can I possibly use tools like Order Flow or DOM the way institutions do?”
The good news is: you don’t have to compete with institutions, you just need to read their intentions.
Here’s how I would approach it today:
1) Open a footprint chart and look for imbalances, areas where one side is clearly more aggressive. Watch for absorption or sudden volume spikes.
2) Watch the Time & Sales feed. Is there a flurry of trades hitting the ask, but price isn’t moving? That’s someone selling into strength.
3) Use the DOM around key areas like VWAP, previous day high/low, or liquidity clusters. Are orders getting pulled? Is size appearing suddenly? These are all signals.
You don’t need to be early. Let the big player act first, then confirm what you’re seeing across Order Flow and DOM. When everything aligns, that’s your edge.
Bringing It All Together
In Part 1, I shared how we used VWAP and Volume Profile as benchmarks to evaluate execution quality. In Part 2, I showed you how I identify institutional activity using raw volume and 10-second charts. And now, in Part 3, you’ve seen the real-time decision-making tools: Order Flow and DOM.
These aren’t indicators. They’re not theories. They’re the actual battlefield where institutions operate and where I learned to trade.
My goal with this series has always been simple: to give you access to the same mindset I used at the institutional level, but through a lens that makes sense for your reality as a retail trader.
Don’t try to outsmart the market. Observe it. Align with the big players. Let their behavior guide your decisions.
That’s how I learned to trade professionally—and it’s exactly how you can start thinking and acting like a pro, even without the size.
Part 1:
Part 2:
EURUSD OUTLOOK 15 - 18 JULYCore CPI m/m came in light which gave a mixed signal at first but CPI y/y was higher than expected which eventually moved EU lower.
The last two analysis that I posted were more longer term focused so this time I will be giving a more short term outlook.
Currently the dollar is stronger based on the recent news that has been coming out and because of that I am still looking to short this pair keeping in mind that it is only the internal structure that is bearish and the swing structure is still bullish

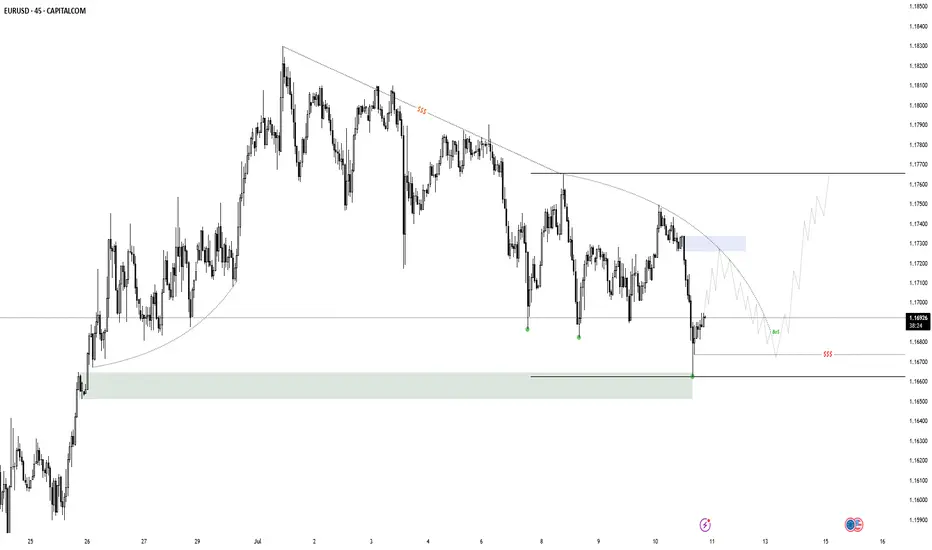
EURUSD AccumulationI am looking for some accumulation here. The model can already be complete, but i would only take it if it extends into a model 2 from extreme liquidity to create more liquidity for a reversal. The supply above, followed by the strong sell off lowers the quality of this model. A supply mitigation with a slow pullback into the POI would change that.
Gold Double Bottom Rejection - Bullish Confirmation PatternThere is currently a double bottom rejection pattern at play and price is reacting to an H4 TF demand zone. Confirmations to go long will be in this demand zone or the next one. But my money is on the current one.
Best thing to do is wait for an M15 supply to break to validate taking longs from the current demand. But the bulls are showing strength.
