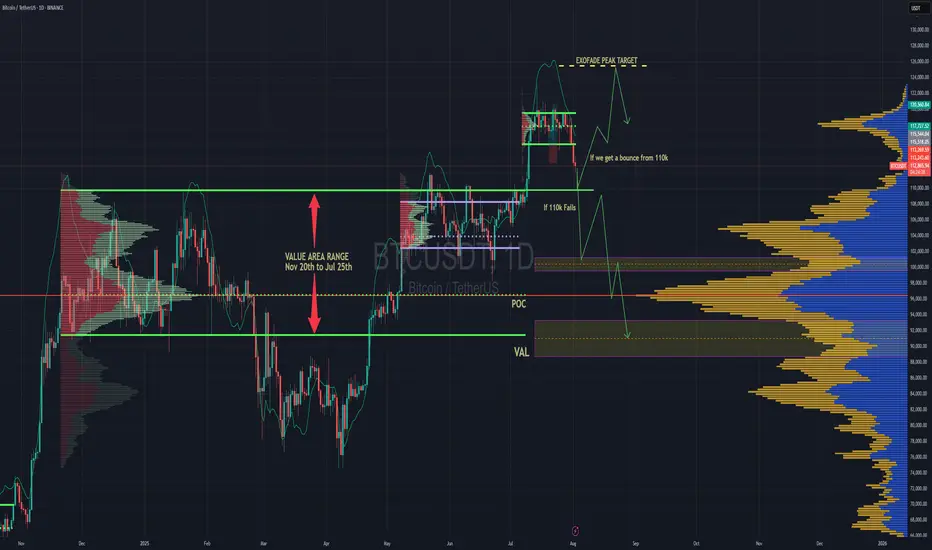
BTC Forecast For August & September. The Only Roadmap You Need !This is one is so obvious, its a no brainer , and would likely be very easy to trade as long as you follow this road map i have provided.
The Value Area High at 110k price range is most important upcoming battle line between bull vs bear. If bulls fail to get a strong bounce from 110k and we close at least 2 daily candles below it. Then it would mean bears have full control and the implication of that is that since we would at that point be closing back inside an established Value Area range, formed between Nov 20th to Jul 25th, then it would mean the probability of price selling all the way down to re-test the VAL (value area low) at $91.6k would instantly become very very high.
After re-testing $91.6k we'll watch and see what happens.
It'll either hold after grabbing some liquidity below and stay in the Value Area Range until further notice Or we lose it and the sell off continues. Bear market will be in full swing if that happens and you can bet a ton of weak hands will start to exit due to max pain & cascading long liquidations. Fear index will be back in the red at that point as capitulation starts to set in. Alot of new alts and meme coins will be completely obliterated.
Bullish Continuation Scenario
If bulls get a strong bounce from 110k and don't close back inside the Value Area Range below, then we could continue up to a make a new ATH for a classic trend pullback continuation trade. Once we get back above 115.4k, the dream of a new ATH will become much more realistic. There is an UFA(Unfinished Auction) at 120.8k which is only visible to traders using the market profile or footprint chart. This make poor high and needs to be taking out at some point.
For the Price target to the upside, we would be using the peak formation line of the ExoFade indicator.
Supplyandemandzones
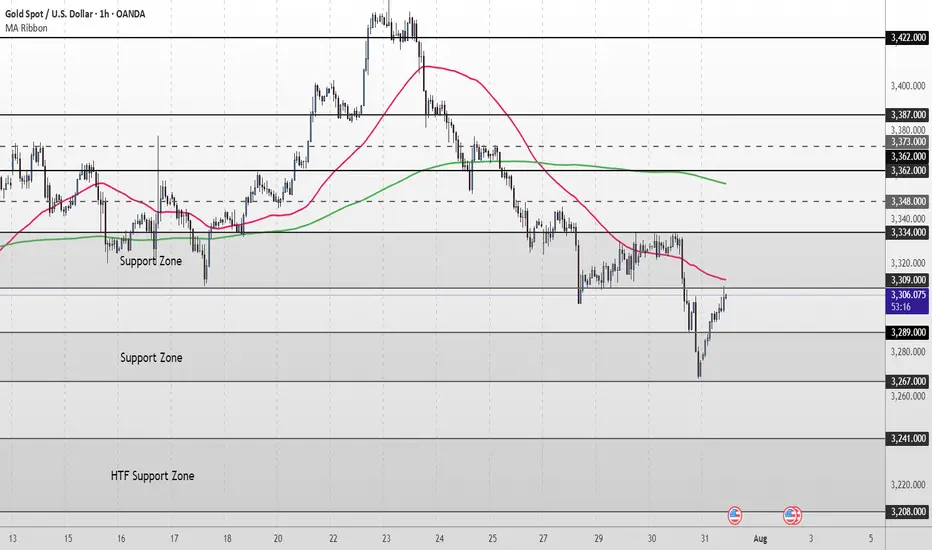
XAU/USD Intraday Plan | Support & Resistance to WatchGold staged a minor recovery overnight after bouncing from the 3,267 Support Zone, and is now trading around 3,305. Price remains below both the 50MA and 200MA, which continue to slope downward—confirming short-term bearish structure.
This current move is still corrective unless bulls manage to reclaim the 3,309–3,334 resistance zone. A clean break and hold above 3,334 would be the first sign of strength, opening up potential retests of 3,348 and 3,362.
Until then, any rallies into the 3,309–3,334 zone should be viewed with caution. If the bounce loses steam, watch for a retest of 3,289 - 3,267. A break below that would expose the 3,241 and 3,208 levels, with the HTF Support Zone (3,241–3,208) acting as a broader downside cushion.
📌 Key Levels to Watch
Resistance:
‣ 3,309
‣ 3,334
‣ 3,348
‣ 3,362
Support:
‣ 3,289
‣ 3,267
‣ 3,241
‣ 3,208
🔍 Fundamental Focus – Thursday, July 31
Big day for data.
🟥 Core PCE, Employment Cost Index, and Unemployment Claims — all critical for Fed outlook and could move gold sharply.
⚠️ Volatility expected around 2:30pm. Stay nimble and manage risk carefully.
BTC Balanced Volume Profile BTC is now trading in a textbook D-Shape Volume Profile. In english - Buyers & Sellers are happy to transact here and will stay inside the value area & consolidating sideways until further notice.
Consolidation at POC is a signature of this profile, and one of the easiest and least stressful trade setups because now, your mission, should you chose to accept. Is to fade the Highs (VAH) and Lows (VAL) and avoid the middle unless you love donating money to the market.
I'll have buy limit orders waiting right below the VAL where we have the single prints. It doesn't get any easier than this.
Doesn't mean price cant rip through, but this is always the best entry with less risk, especially when the single prints have not been tested yet..
BINANCE:BTCUSD CME:MBT1!

EURUSD - M15 Supply Zone RetestThe current price action shows that the market is expected to first fill the Fair Value Gap (FVG) area, which acts as a price inefficiency zone demanding liquidity clearance. After the FVG is filled, the price is anticipated to retest the Higher Time Frame (HTF) Supply Zone, which serves as a strong resistance area.
Following the retest of the supply zone, the prevailing downtrend is likely to resume, pushing the price downwards towards the HTF Demand Zone. This demand zone is identified as a key support level where buying interest is expected to emerge, potentially halting the decline temporarily or initiating a reversal.
This trading plan emphasizes waiting patiently for the FVG fill as a prerequisite step before looking for a supply zone retest confirmation to enter short positions targeting the demand zone below, aligning with the overall bearish trend continuation.

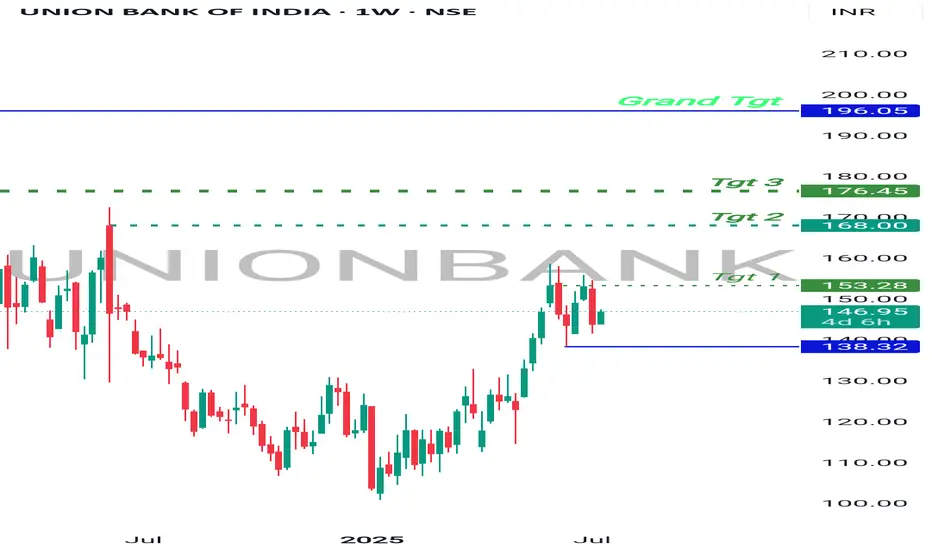
Bullish Bet , UnionBankBanknifty at support.
UnionBank on recent high making sideways moves, which means consolidation.
Once Banknifty Bounce back, UnionBank will break the resistance on weekly and monthly Basis and will start moving higher.
It has higher targets on a short and long term investment.
Good to hold for short term.
OIL fell sharply, opportunity for upside target of 70$OIL fell sharply and has now been in a contraction for a while, I am taking it into account for a potential breakout, as it shows tightening price action, which reflects market indecision.
Price action has now coiled into a symmetrical triangle, this is often a classic continuation or reversal pattern, and it’s building pressure for a potential breakout. So, if we do get a clean breakout above this pattern, with strong bullish candles, volume, or bullish divergence, that’s your confirmation cue.
This is totally achievable. It aligns beautifully with the 0.25 to 0.5 Fibonacci retracement zone from the recent swing high to low. It’s not just a psychological round number, it’s technically supported.
If the lower boundary of the triangle is broken with momentum, you’ve got to step back. No trade is better than a bad one. Watch how price interacts with the zone. If it loses it, you could be looking at a deeper leg down, potentially revisiting deeper support levels from prior bullish structure.

Gold Short To Medium Term OutlookGold bounced from the lower Support Zone after briefly breaching $3,270. Price is now attempting a recovery, currently trading near $3,290, but remains below both the 50 EMA and 200 EMA — confirming bearish pressure is still intact.
For bulls to gain momentum, we need to see a clean break and hold above $3,298–$3,327which would open the path toward $3,352 and possibly higher resistance levels like $3,364 and $3,383.
Until then, this move may simply be a short-term pullback within a broader downtrend. If price fails to reclaim $3,327, watch for a drop back toward $3,270, with a deeper correction targeting the $3,241–$3,211 zone.
📌 Key Levels to Watch:
Resistance:
$3,298 • $3,327 • $3,352 • $3,364 • $3,383
Support:
$3,270 • $3,241 • $3,211 • $3,179
🧠 Fundamental Focus:
This week is packed with high-impact events — including Non-Farm Payrolls on Thursday. These could trigger sharp moves in gold, so stay cautious and manage risk wisely.

XRPUSDT 4H | Untested Demand Zone RevisitIn this 4-hour chart analysis of XRPUSDT, I’m focusing on a clear and well-defined untested demand zone between 2.05–2.13 USDT . Unlike the first demand zone (already tested and played out), this second zone has not been retested since its formation, making it a fresh area of interest for a potential long setup.
Why this matters :
Untested demand zones often act as powerful magnets for price when revisited, as they represent areas where large buy orders might be waiting to be filled. Because this zone has not been revisited yet, there’s a higher probability for a bullish reaction when price returns to it.
Key Technical Factors :
✅ The 2.05–2.13 demand zone was formed following a significant bullish impulse that created a clear break of structure to the upside.
✅ Price is currently consolidating above this demand zone and also above a potential bearish CHoCH at 2.0784 . This suggests that the bullish structure is still valid unless price breaks below 2.0784.
✅ My bullish target is 2.65 USDT , where previous highs were formed and potential liquidity exists.
✅ My stop loss is set just below the demand zone, around 2.05 , to protect against a deeper retracement or a shift in market structure.
My Thought Process :
I expect that if price returns to the demand zone, there will be a strong chance for buyers to step in and push the market higher. However, I’m aware that if price breaks below 2.0784 , it would signal a bearish CHoCH and invalidate the long scenario. Therefore, patience is key — I’ll wait for price to either test the zone and react strongly or stay above 2.0784 to keep the bullish bias intact.
Clear Trade Setup :
📌 Entry Zone : 2.05–2.13
🛑 Stop Loss : Below 2.05
🎯 Take Profit : 2.65
🧩 Invalidation : Break below 2.0784
💬 Let me know if you have a similar zone marked out or if you see a different setup! Let’s share ideas and refine our strategies together.

ETH Weekend/next week levelsETH plan for the weekend (24-05-2025 to 25-05-2025) and following week with focus on FOMC minutes on 28th May.
Current zone marked offers long/short SL's if anyone wants to trade within current zone on LTF.

Moo Deng Meme Coin Cryptocurrency Expecting a Sell-off Expecting a strong sell-off on Moo Deng Meme Coin Cryptocurrency after the strong monthly supply has been reached. There is a lot of profit for margin on the way down.

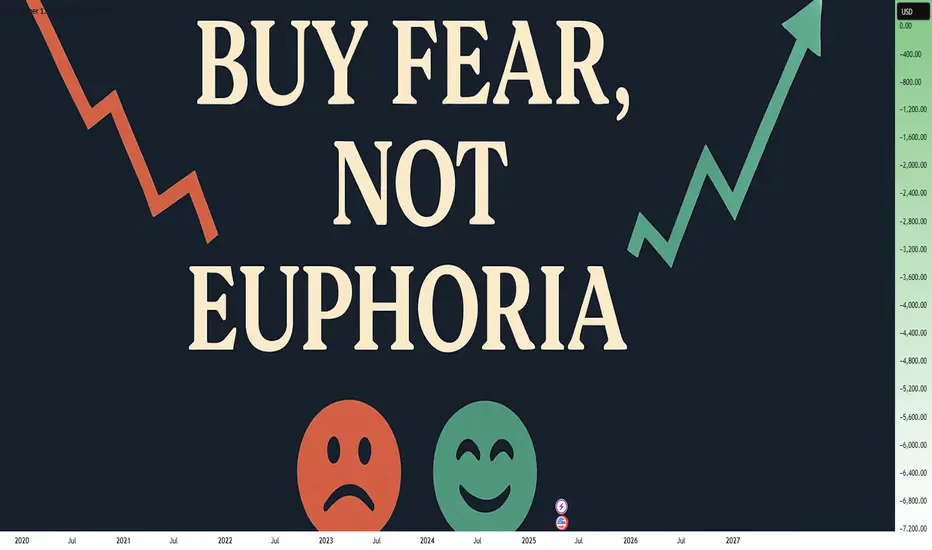
Buy Fear, Not Euphoria: The Trader's EdgeWhen you look back at the greatest trading opportunities in history, they all seem to share a common element: fear. Yet, when you're in the moment, it feels almost impossible to pull the trigger. Why? Because fear paralyzes, while euphoria seduces. If you want to truly evolve as a trader, you need to master this fundamental shift: buy fear, not euphoria.
Let's break it down together.
________________________________________
What Fear and Euphoria Really Mean in Markets
In simple terms, fear shows up when prices are falling sharply, when bad news dominates the headlines, and when people around you are saying "it's all over."
Euphoria, on the other hand, is everywhere when prices are skyrocketing, when everyone on social media is celebrating, and when it feels like "this can only go higher."
In those moments:
• Fear tells you to run away.
• Euphoria tells you to throw caution to the wind.
Both emotions are signals. But they are inverted signals. When fear is extreme, value appears. When euphoria is extreme, danger hides.
________________________________________
Why Buying Fear Works
Markets are pricing machines. They constantly adjust prices based on emotions, news, and expectations. When fear hits, selling pressure often goes beyond what is rational. People dump assets for emotional reasons, not fundamental ones.
Here’s why buying fear works:
• Overreaction: Bad news usually causes exaggerated moves.
• Liquidity Vacuums: Everyone sells, no one buys, creating sharp discounts.
• Reversion to Mean: Extreme moves tend to revert once emotions stabilize.
Buying into fear is not about being reckless. It’s about recognizing that the best deals are available when others are too scared to see them.
________________________________________
Why Chasing Euphoria Fails
At the peak of euphoria, risks are often invisible to the crowd. Valuations are stretched. Expectations are unrealistic. Everyone "knows" it's going higher — which ironically means there's no one left to buy.
Chasing euphoria often leads to:
• Buying high, selling low.
• Getting trapped at tops.
• Emotional regret and revenge trading.
You’re not just buying an asset — you're buying into a mass illusion.
________________________________________
How to Train Yourself to Buy Fear
It's not enough to "know" this. In the heat of the moment, you will still feel the fear. Here's how you build the right habit:
1. Pre-plan your entries: Before panic strikes, have a plan. Know where you want to buy.
2. Focus on strong assets: Not everything that falls is worth buying. Choose assets with strong fundamentals or clear technical setups.
3. Scale in: Don’t try to catch the bottom perfectly. Build positions gradually as fear peaks.
4. Use alerts, not emotions: Set price alerts. When they trigger, act mechanically.
5. Remember past patterns: Study previous fear-driven crashes. See how they recovered over time.
Trading is a game of memory. The more you internalize past patterns, the easier it is to act when everyone else panics.
________________________________________
A Recent Example: April 2025 Tariff Panic
Very recently, at the start of April, Trump’s new tariff announcements sent shockwaves through the market. Panic took over. Headlines screamed. Social media was flooded with fear.
But if you looked beyond the noise, charts like SP500 and US30 told a different story: the drops took price right into strong support zones.
At the time, I even posted this : support zones were being tested under emotional pressure.
If you had price alerts set and reacted mechanically, not emotionally , you could have bought into that fear — and potentially benefited from the rebound that followed just days later.
This is the essence of buying fear.
________________________________________
Final Thoughts
In trading, you are paid for doing the hard things. Buying when it feels terrible. Selling when it feels amazing.
Remember:
Fear offers you discounts. Euphoria offers you traps.
The next time the market feels like it's crashing, ask yourself:
• Is this fear real, or exaggerated?
• Is this an opportunity hiding under an emotional fog?
If you can answer that with clarity, you're already ahead of 90% of traders.
Stay rational. Stay prepared. And above all: buy fear, not euphoria.
Disclosure: I am part of Trade Nation's Influencer program and receive a monthly fee for using their TradingView charts in my analyses and educational articles.
EURNZD strong daily demand level at 1.89. Long biasSupply and demand imbalances are the driving forces behind price movements in the Forex market. By identifying these key zones or imbalances, traders can anticipate high-probability reversal or continuation setups. Today, we’ll analyze the EURNZD cross pair, which has recently formed a strong demand imbalance at $1.89—the most significant impulse in months.
The Power of Supply & Demand Imbalances
Supply and demand trading revolves around identifying areas where price has made a strong, impulsive move (demand or supply zone) and then waiting for a retracement into that zone for a potential reversal or continuation.
Key Characteristics of a Strong Imbalance:
✅ Extended Range Candles (ERC): Strong, wide-bodied candles indicate institutional buying/selling.
✅ Strong Imbalance: A clear shift in market structure after a strong rally or drop.
✅ Fresh Zone: The imbalance has not been tested yet or has only been tested once.

XAUUSD ScenariosHi, market kept rallying up. Right now 2325 is a temporary level acting as a resistance. Below it market could drop to 3207 and 3197 levels.
In order to go long you need to wait for the market to reach to demand levels specified in the chart and act accordingly.
Make sure to add your intuition and knowledge into this and don't take everything blindly.
Be honorable

XAUUSD BUY OR SELLHello guys,
in Today's analysis , market is rallying up, the blue line is the resistance in which many would think of selling . And too many stops have been gathered there. So one scenario would be hunting the stops above blue line and hitting the resistance around 2413 and see sellers coming in.
3100 is the last resistance which now acts as a support. below that 3089 would be demand level.
stay gold

GBP/USD Market Analysis: Potential Short Setup at ResistanceThe GBP/USD pair is trading near the **1.3000** psychological level, showing signs of consolidation after a strong bullish move. The chart suggests a potential reversal as price approaches a key resistance zone, with an apparent liquidity grab at the recent high.
The highlighted area around **1.2946 - 1.2921** represents a significant **H4 demand zone**, where price could retrace before continuing its next move. A break below this zone would indicate a deeper correction, with potential downside targets towards **1.2870** (OA level).
**Key Considerations:**
- A sustained break above **1.3000** could invalidate the bearish setup, leading to further upside momentum.
- A rejection at this level, combined with bearish price action, could confirm a short opportunity with a target towards the demand zone and lower support areas.
**Conclusion:** Traders should monitor price action around the resistance level and confirmation of a bearish reversal before committing to short positions. If bullish momentum persists, a breakout could open the door for further gains.

GBPCAD Price ActionHello Traders,
As you can see, I've marked the Demand Zone, based on the 2-hour timeframe. Additionally, I've highlighted Liquidity Levels, clearly distinguishing between those already swept and the valid ones remaining.
On the 15M timeframe, you'll notice I've marked the Breakout Block, also identified as the Supply Zone. If the price breaks this Supply Zone, you should set a pending order. There are two effective ways to enter this market: either through an FVG (Fair Value Gap) or a Breaker Block entry.
Your trade can be held for up to one day, with the stop-loss positioned at the recent swing low. Remember, it's crucial to manage your risk responsibly and avoid greed. This structure repeats itself consistently.
Wishing you the best and happy trading!
Thank you.

NVDA $90 PRISONAs last time we were stuck within the $90 range I can see a previous order block that was created and retested making it invalid. I am considering regardless this area of $91/94 as a good demand area. Not only the sentiment of the fanatics is that it is a discounted price at $90. But speculations are already running online that once they reach this area, they need to load up to head to $130.
This is a good sentiment to capitalize both on the movement down and the bounce.
The good traders do not become "fans" of a company. We just capitalize on fanatic sentiments to get their money as any good record label would with their artist.
Ladies and gentlemen, NVDA is our artist for this week concert.
Let us capitalize on the fans and hope they request an encore.

SUI Weekly Analysis Sui is bullish so long as the green box holds.
Looking for a BOS/CHoCH on the 4HR. Until then we’re holding tight as further downside should be expected.
Stay safe out there my friends!

USD/JPY – Precision Short Trade Breakdown🔥 Executed a precise short trade on USD/JPY this morning, aligning with institutional order flow and Prime Market Terminal insights. Here’s the full breakdown of how this setup played out!
🔍 Trade Setup & Analysis:
📌 Entry: 149.300 – Price rejected a key supply zone & Fibonacci retracement level.
📌 Stop Loss: 149.558 – Above key liquidity & invalidation area.
📌 Take Profit: 148.504 (first TP), 148.213 (final target).
📌 Risk-Reward Ratio: 1:3
📊 Prime Market Terminal Insights That Confirmed This Trade:
🔻 Institutional Positioning & Market Flow:
✔ Smart Money Report:
Large institutions were heavily net short USD/JPY, with leveraged funds reducing their long exposure.
Dealer intermediaries (banks and liquidity providers) also added more short positions, indicating further downside momentum.
✔ COT (Commitment of Traders) Data:
Open interest showed a significant drop in long positions, suggesting weakness in USD/JPY.
Hedge funds and asset managers increasing short exposure aligned with my bearish bias.
✔ DMX Open Interest:
66% of institutional traders were short on USD/JPY, confirming my sell-side setup.
Short positioning had increased by 34% in the last session, reinforcing my downside expectation.
🔻 Volatility & Liquidity Insights:
✔ Average True Range (ATR) Analysis:
ATR showed a high probability of an extended move, suggesting the potential for price to hit my targets.
Recent daily ranges indicated USD/JPY had room to move another 100+ pips to the downside.
✔ Session Range & Market Structure:
Liquidity grab above 149.300 supply zone, followed by strong rejection and sell-off.
Previous session lows were swept, indicating smart money targeting deeper liquidity.
Institutional orders clustered around 148.200, suggesting a likely downside target.
🔻 High-Impact News That Influenced USD/JPY:
📢 Japanese Unemployment Rate (Actual: 2.5% | Forecast: 2.5%) → No surprise, minimal impact.
📉 Business Capex (MOF YY) (-0.2% vs. 8.1% previous) → Indicated economic slowdown, weakening JPY demand.
📰 U.S. Economic Data Later Today:
Redbook YY (USD) expected at 6.2% – could impact USD sentiment.
Fed’s Williams speech on monetary policy could affect USD volatility, reinforcing our bias.
🎯 Trade Execution & Outcome:
✅ TP HIT! Price dropped as expected, hitting both targets with precision.
🚀 Perfect confluence of:
✅ Smart money selling pressure
✅ Liquidity sweep & supply zone rejection
✅ High-probability move from ATR analysis
📸 Prime Market Terminal Screenshots Included:
📊 DMX Open Interest → Confirmed institutions were net short.
📊 COT Data → Showed decline in long positions.
📊 ATR & Volatility Charts → Supported extended downside movement.
📊 Session Ranges & Market Structure → Confirmed liquidity grab & supply zone rejection.
🔑 Key Takeaways from This Trade:
✔ Trade with institutional momentum – Always check positioning before entering!
✔ Multiple confirmations = High probability setups – Don’t rely on a single indicator.
✔ Liquidity is key – Smart money moves price to hunt liquidity, trade accordingly.
✔ Fundamentals matter – Weak JPY capex data helped push price lower.
💬 What’s your view on USD/JPY? Will we see further downside? Drop your thoughts below!
📊 Follow for more trade setups, market analysis & strategy breakdowns!

XRP Weekly-Monthly Analysis / Retracement Levels for BuyWeekly - Monthly trend: Bearish
Chart Pattern: Head & Shoulders (H&S) - Continuation Pattern
Retracement Fib Price Levels:
0.00% (3.4000)
23.60% (2.6879)
38.20% (2.2474)
50.00% (1.8914)
61.80% (1.5353)
78.60% (1.0284)
100.00% (0.3827)
Good prices for buy:
61.80% (1.5353) – Golden Zone / Golden Pocket
78.60% (1.0284) – Entry Zone
Between 78.60% (1.0284) and 100.00% (0.3827) is the Risk Zone, which we have the Neckline of the ‘’ Quadruple Bottom Pattern ‘’ at the price range ‘’ 0.6291 – 0.7850 ‘’

LEMONTREE HOTELS 240 MINS TIME FRAMEThe Structure looks good to us, waiting for this instrument to correct and then give us these opportunities as shown on this instrument (Price Chart).
Note: Its my view only and its for educational purpose only. Only who has got knowledge about this strategy, will understand what to be done on this setup. its purely based on my technical analysis only (strategies). we don't focus on the short term moves, we look for only for Bullish or Bearish Impulsive moves on the setups after a good price action is formed as per the strategy. we never get into corrective moves. because it will test our patience and also it will be a bullish or a bearish trap. and try trade the big moves.
We do not get into bullish or bearish traps. We anticipate and get into only big bullish or bearish moves (Impulsive Moves). Just ride the Bullish or Bearish Impulsive Move. Learn & Know the Complete Market Cycle.
Buy Low and Sell High Concept. Buy at Cheaper Price and Sell at Expensive Price.
Please keep your comments useful & respectful.
Keep it simple, keep it Unique.
Thanks for your support
Tradelikemee Academy
Saanjayy KG

SPX500: Possible bounce from key support toward 5,980?FOREXCOM:SPX500 has reached a significant support zone, highlighted by previous price reactions and strong buying interest. This area has acted as a key demand zone, increasing the likelihood of a bullish bounce if buyers step in.
The current market structure suggests that if the price confirms support within this zone, we could see a bullish reversal. A successful rebound could push the price toward 5,980 . However, if the price breaks below this zone, the bullish outlook may be invalidated, opening the possibility for further downside.
Just my take on support and resistance zones—not financial advice. Always confirm your setups and trade with solid risk management.
Best of luck!

CADJPY - Potential buying opportunity in sightOANDA:CADJPY is trading near a clear support level that triggered bullish reversals in the past. The recent bearish move into this area creates a potential opportunity for buyers to regain control.
If bullish confirmation appears, such as increased buying volume or candlestick reversal patterns, I expect the price to move toward 105.550. On the other hand though, a break below this support would weaken the bullish scenario and suggest further downside.
Just my take on support and resistance zones—not financial advice.
Best of luck in the markets.
