GBPJPY Looking Sell From Supply | Smart Money ConceptHey traders, here is the analysis for the GBPJPY. If you guys like my analysis please hit like👍 and follow. Thanks.
Supplydemandanalytics

FTM rejected at strong resistanceThis time FTM is trying one more time to break $0.35 resistance, a really strong resistance.
Before that, FTM rejected at a strong support around $0.30.
To see a bullish continuation, I would like a valid breakout of $0.44
For longs, try to catch the retest of $0.35 as support.

GBPJPY Sell then Buy from Demand | Smart Money ConceptHey traders, here is the analysis for the GBPJPY. If you guys like my analysis please hit like👍 and follow. Thanks.

BTC/USD prediction analysisDear all,
I reckon you to entry at my sign to long and take profit at my sign "Potential Target"
Happy trading you all!
Good luck!
Make your own analysis is sounds better!
Thanks!
PS: Please DYOR before entry the market

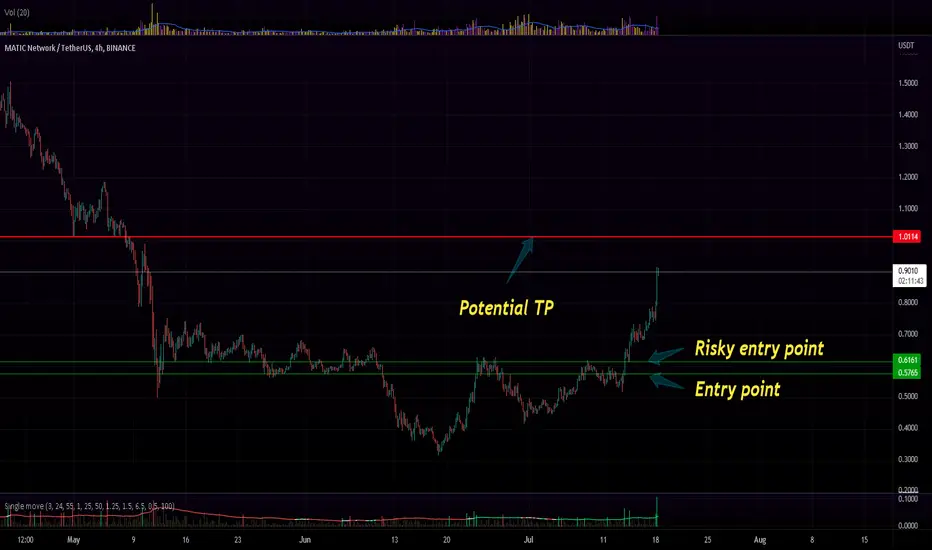
Matic USDT LONGWe see a really great strong candles at the levels which is a sign of powerful buyers!
So if there are strong buyers they could keep the fort and after a rejection to the level we might face another big move.
Take confirmations in 15m chart and keep in mind the BTC movements. If BTC started a strong Bearish move cancel this trade.
AUDUSD - BUYHello traders, if the AUD price gets into the orange zone I will be looking for a buying opportunity! If you agree, like or follow or comment. As soon as we get to the green zone I will prepare to short but we have to be very careful as the bullish move was very aggressive before the end of the week.
I personally prefer setting up multiple TPs , here's an explanation:
1) 1:1 allows you to take a 50% position and thus secure a balance against loss in case the market turns
2) 2-5 :1 means profit (25% trade volume ), after reaching this TP I move SL to BE
3) 5-10 :1 means bonus money with rest of trade volume 25%
In this way, I ensure that my equity curve grows consistently without significant dips.
Money is lying on the ground, just bend down for it! Be patient and wait for the price to reach a strong zone and open a position!

Wyckoff Logic Supply and Demand BTC TF-H4 technical analysis
Today on 16.07.2022, the price at which bitcoin is traded is 20605 USD. Approximately 4 weeks the price action is in a period of consolidation that is between the quotas;
* 21606 USD upper limit (supply zone)
&
* 17599 USD lower limit (demand zone)
We also have an elliott wave sequence with three impulsive waves and 2 completed berish corrective waves.
The initial cause was the redistribution consolidation area between the quotas with;
* 45843 USD upper limit (supply zone)
&
* USD 33100 lower limit (demand zone)
Conclusion
The general sentiment is predominantly depreciating.
But the consolidation area between the quotas
* 21606 USD upper limit (supply zone)
&
* 17599 USD lower limit (demand zone), plays a crucial role that can bring about a change in the direction of depreciation.
From the point of view of logical wyckoff analysis, on TF-H1 we are in a consolidation sequence after a depreciation trend with the formation of the cause that passed from phase A with the change of character from the down trend in a consolidation structure and transition to phase B of the campaign.
It remains to be seen whether this campaign is one of accumulation that will have an implication of appreciation or redistribution that will have an implication of depreciation of the Bitcoin asset.

Trading exactly at Supply/Demand Equilibrium PointWill be very interesting to see how we trade here in the next 25-30 minutes. Using Supply/Demand trendlines as shown in chart, I am seeing Supply = Demand at ~ 7:25AM 7/12/2022 (EST) @ the price level 3826.71.
This is right where we are now. A further analysis using Calculus gives me a bullish conditional expectation from here.
If Price gets back above 3683 this morning (after the point in time where demand becomes greater than supply (so after ~7:25AM), then it will activate markup of this accumulation phase. The 3683 I have obtained from 2 separate methods, the one relevant to the Supply/Demand in chart is as follows:
Find the AUC of Supply/Demand (a hyperbolic expression) by integrating over the time interval from beginning of supply trendline to point of equilibrium (= 30.97 trading days), then add to X_e to obtain the markup level. When this is broken before time of equilibrium it can result in a short squeeze if price gets far enough away, but we ran into resistance this week so had to backup/retest for support and will now re-attempt. Green dashed line is illustrative path if squeeze unfolds (still can), green path is expected path if there is no squeeze.
Black path illustrative of what could happen if it gets trapped back in between the S, D trendlines
Red path is breakdown.
These are not precise, just wanted to illustrate the most likely scenarios that can unfold from here and alert that we are at a critical point in price and time... right now.
StochRSI and MFI both point toward breakout, other math not included points toward bullish from here. A bullish catalyst would do the trick, but might just occur on its own based on Gann Time Cycle (not included).
Bet.

GBPJPY Buy AnalysisHey traders, here is the analysis for the GBPJPY. If you guys like my analysis please hit like👍 and follow. Thanks.

btcusdtHello to all ,
In my opinion, this move is likely to happen
If it is useful for you, please like it

BTC/USDT Perpetual contractDear Traders and Investors,
I made a simple analysis for BTC/USDT perpetual contract
I saw a downtrend in a short term
I reckon you guys to open short at my sign "entry"
and take profit at my sign "Potential Target 1 and 2"
Happy trading y'all
Good luck!
Best,
PS: Please DYOR before entry the market

audchf long------------Failedaudchf long------------Failed
supply and demand
elliotwave
wychoff
orderblock
all are involve.
If you are using $1000 .just use $1 for per trade.Use your target 100 pip or more
if you are using $2000.Just use $2 for per trade.use you target 100 pip or more
if you are using $5000 .Just use $5 for per trade.

Absorption of supply - EID PARRY 1D We can clearly see the selling legs , which seems strong enough to get absorbed. Yesterday we got a good rally of around 8.5% (market closed). And today we can see a tiny selling candle , which shows some signs of buyers at supply and absorption of selling. If we see more good buying candles or tiny selling candles. We can say the buyers are taking charge for the further ATH rally and it defines the absorption of supply

Eurgbp short tern + entry pointEURGBP SHORT TERM +ENTRY POINT
supplyanddemand
elliotwave
ABCD PATTERN
wychoff
All are involve


EGLDUSDT wants the supply zoneThe price is testing the 0.5 Fibonacci level as new support after a rejection from the supply zone on 58$.
As you can see on the chart, the liquidity is on the 4h resistance
How to approach?
The price could get new liquidity from the resistance and create a new bearish impulse until the previous demand zone around 44$ where the market has the daily support. According to Plancton's strategy , we can set a nice order
–––––
Keep in mind.
🟣 Purple structure -> Monthly structure.
🔴 Red structure -> Weekly structure.
🔵 Blue structure -> Daily structure.
🟡 Yellow structure -> 4h structure.
–––––
Follow the Shrimp 🦐

EURCHF LONGhello traders....
here we are waiting for the price to retrace to demand, which is at 1.03955 and waiting for the price reaction as a reference for entry
Thanks :))


Bitcoin Accumulation Zone1- Sharp Downward movement toward 27k zone.
2- Reversal from the zone.
3- First target 37k.

Just Tested The Steping stone Demand In general H4
Price is in the Retracement Phase / Correction Period to the H4 demand level
before going higher or lower if supply is still in power, but evidence of CHoCH / Sign of Strength can be seen from the candle pattern forming a new Higher High and Ultra High Demand volume.
Price projection has objectively violated the last HH price at 1869.72 (May 24th)
and OVERSOLD Condition 1824.54 (June 1st)
we'll see Monday
how Prices React to market sentiment
We monitor consolidation and confirmation
for for price Rise higher to zone 1880 - 1899
Or down to 1830 -1810 zone
Have a great Trade A head
----Bahasa Indonesia----
Secara General H4
Harga dalam Phase Retracement / Masa Koreksi ke level demand H4
sebelum naik lebih tinggi atau lebih rendah jika supply masih berkuasa, namun bukti CHoCH / Sign of Strenght terlihat dari candle pattern membentuk new Higher High dan Demand volume yang ultra High.
Price projection secara objective telah melanggar harga HH terkahir di 1869.72 (24 Mei)
dan OVERSOLD Condition 1824.54 (1juni)
kita lihat senin,
bagaimana Harga Bereaksi terhadap sentimen pasar
Kita Pantau konsolidasi dan konfirmasi
untuk untuk harga Naik lebih tinggi ke zona 1880 - 1899
Atau turun ke 1830 -1810
Salam TraderBarokah

btcusdtperpHi my friends
I guess given the price position in the chart, the price could be close to (the uptrend line
4 hour)
