Supplydemandanalytics
TRXUSDT is testing the supply zone
The price is testing the 0.786 Fibonacci level, it's a key level for the market.
On the weekly timeframe, the price lost the support on 0.083$
On the daily timeframe, the price had a breakout from the daily resistance of 0.072 $ and retested as new support.
On the 4h timeframe, the price needs to create a breakout from the supply zone above the 0.085 and retest as new support.
How to approach it?
IF the price is going to have a breakout and retest the previous resistance as new support, According to Plancton's strategy , we can set a nice order
–––––
Keep in mind.
🟣 Purple structure -> Monthly structure.
🔴 Red structure -> Weekly structure.
🔵 Blue structure -> Daily structure.
🟡 Yellow structure -> 4h structure.
–––––
Follow the Shrimp 🦐

JICPT| Tesla bullish setup on the zone($544-$580)Hello everyone. Tesla dropped by almost 50% from the peak. On the weekly chart, it's still in the uptrend.
The nearest demand zone is $544 to $580. I think it'll be served as solid zone and it'll be rebound once hit.
What do you think? Give me a like if you're with me.

CADCHFHello traders... :)
After the price breaks the support level at 0.76888 and forms a new lower low, we will only wait for the price to retrace and touch the supply area ( 0.76547-0.76888 ), and wait for confirmation using price action... thanks :))

NZDCHF SELL to BUY MoveNZDCHF SELL to BUY Move.
The previous high was taken out forming an impulse move, waiting for a retracement to the lower curve of the Demand to buy.
#myview
#supplyanddemand


IOTA/USD H1 TECHNICAL ANALYSIS Pls refer to the self explanatory chart.
***This is for sharing and entertainment purposes only. I am not a financial advisor***

NZDJPYwait for price touch the supply area in the 82.353 after that we wait for the confirmation...
thanks.. :))


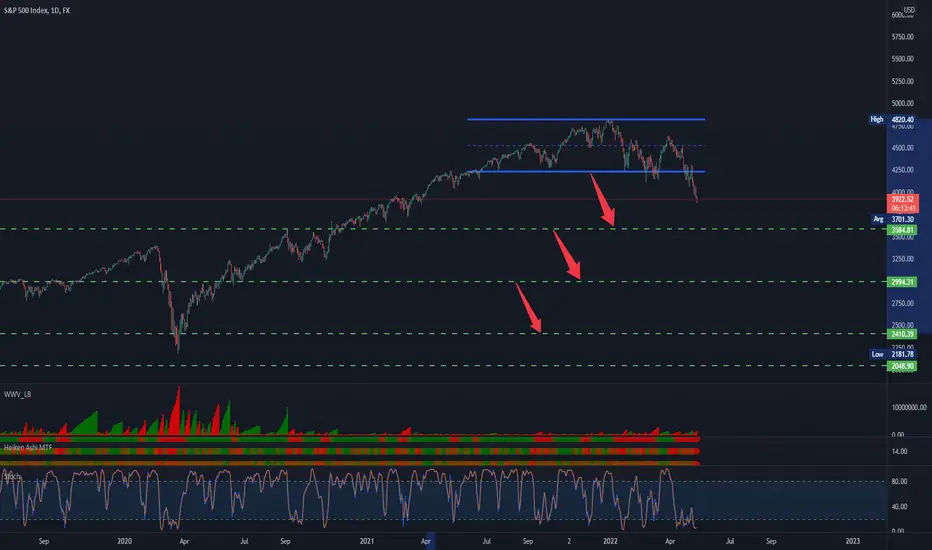
Wyckoff Logic Supply and Demand
SP500
Increases the probability of a fall of approx -50% , bear market
Wyckoff Logic Supply and Demand EURUSD
Technical analysis
Cause, re-distribution, equilibrium sequence between demand and supply between quotas, supply zone 1. 05916 & 1. 04703 demand zone .
Supply is greater than Demand!
Implications, bearish!
Pattern Drop base Drop!
The effect generated by approx
170 pips.
SL 1.05346
Entry, sell! 1.4040
TP 1.02350
⭕ = circle
⏹ = square
🔺️ = triangle
Unit = ⭕ market
Polarity = 🔺️demand & 🔻supply
Equilibrium = ⏹ range ("the ratio between supply and demand is =")
PRINCIPLE OF DEMAND AND SUPPLY
The law of supply and demand
- here the analysts study the relationship between supply and demand , having as a reference point the price and
volume over a period of time as shown on the chart.
KEY DEFINITION
The law of supply and demand is of the utmost importance. If the application to
buy an instrument (currency pairs, stocks, commodities , metals, bonds, cryptocurrencies)
is higher than the available supply, the only way the demand can be met is
for the price to rise to a level that attracts enough supply to match demand.
When this point is reached, the price does not advance. If the offer to sell is
higher than the demand to buy, the only way the supply will be absorbed is as
the price drops to a point that attracts enough demand to absorb all
the amount. When that happens, the price doesn't go down.

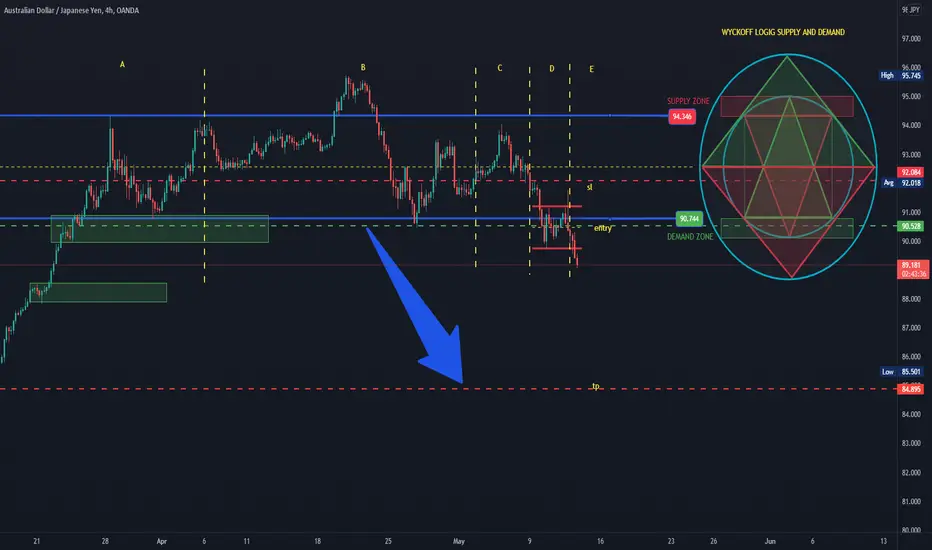
WYCKOFF LOGIC SUPPLY AND DEMANDAUDJPY
Technical analysis
Cause, distribution, equilibrium sequence between demand and supply between quotas, supply zone 94.346 & 90.744 demand zone .
Supply is greater than Demand!
Implications, bearish!
Pattern Rally base Drop!
The effect generated by approx
500 pips.
SL 92.084
90.528 Entry, sell!
TP 84.895
⭕ = circle
⏹ = square
🔺️ = triangle
Unit = ⭕ market
Polarity = 🔺️demand & 🔻supply
Equilibrium = ⏹ range ("the ratio between supply and demand is =")
PRINCIPLE OF DEMAND AND SUPPLY
The law of supply and demand
- here the analysts study the relationship between supply and demand , having as a reference point the price and
volume over a period of time as shown on the chart.
KEY DEFINITION
The law of supply and demand is of the utmost importance. If the application to
buy an instrument (currency pairs, stocks, commodities , metals, bonds, cryptocurrencies)
is higher than the available supply, the only way the demand can be met is
for the price to rise to a level that attracts enough supply to match demand.
When this point is reached, the price does not advance. If the offer to sell is
higher than the demand to buy, the only way the supply will be absorbed is as
the price drops to a point that attracts enough demand to absorb all
the amount. When that happens, the price doesn't go down.
Wyckoff Logic Supply and Demand GBPUSD
Technical analysis
Cause, RE-distribution, equilibrium sequence between demand and supply between quotas, supply zone 1.23805 & 1.2275 demand zone.
Supply is greater than Demand!
Implications, bearish!
Pattern Rally base Drop!
The effect generated by approx
300 pips.
SL 1. 24628
1.23349 Entry, sell!
TP 1.2000
⭕ = circle
⏹ = square
🔺️ = triangle
Unit = ⭕ market
Polarity = 🔺️demand & 🔻supply
Equilibrium = ⏹ range ("the ratio between supply and demand is =")
PRINCIPLE OF DEMAND AND SUPPLY
The law of supply and demand
- here the analysts study the relationship between supply and demand , having as a reference point the price and
volume over a period of time as shown on the chart.
KEY DEFINITION
The law of supply and demand is of the utmost importance. If the application to
buy an instrument (currency pairs, stocks, commodities , metals, bonds, cryptocurrencies)
is higher than the available supply, the only way the demand can be met is
for the price to rise to a level that attracts enough supply to match demand.
When this point is reached, the price does not advance. If the offer to sell is
higher than the demand to buy, the only way the supply will be absorbed is as
the price drops to a point that attracts enough demand to absorb all
the amount. When that happens, the price doesn't go down.

Wyckoff Logic Supply and Demand USDCAD
Technical analysis
Cause, accumulation, equilibrium sequence between demand and supply between quotas, 100.295 supply zone & 91.755 demand zone .
Demand greater than supply!
Pattern Rally base Rally!
Implications, bullish!
The effect generated by approx 270 pips!
SL 1.27920
Entry 1.29477, buy!
TP 1.32235
⭕ = circle
⏹ = square
🔺️ = triangle
Unit = ⭕ market
Polarity = 🔺️demand & 🔻supply
Equilibrium = ⏹ range ("the ratio between supply and demand is =")
PRINCIPLE OF DEMAND AND SUPPLY
The law of supply and demand
- here the analysts study the relationship between supply and demand , having as a reference point the price and
volume over a period of time as shown on the chart.
KEY DEFINITION
The law of supply and demand is of the utmost importance. If the application to
buy an instrument (currency pairs, stocks, commodities , metals, bonds, cryptocurrencies)
is higher than the available supply, the only way the demand can be met is
for the price to rise to a level that attracts enough supply to match demand.
When this point is reached, the price does not advance. If the offer to sell is
higher than the demand to buy, the only way the supply will be absorbed is as
the price drops to a point that attracts enough demand to absorb all
the amount. When that happens, the price doesn't go down.

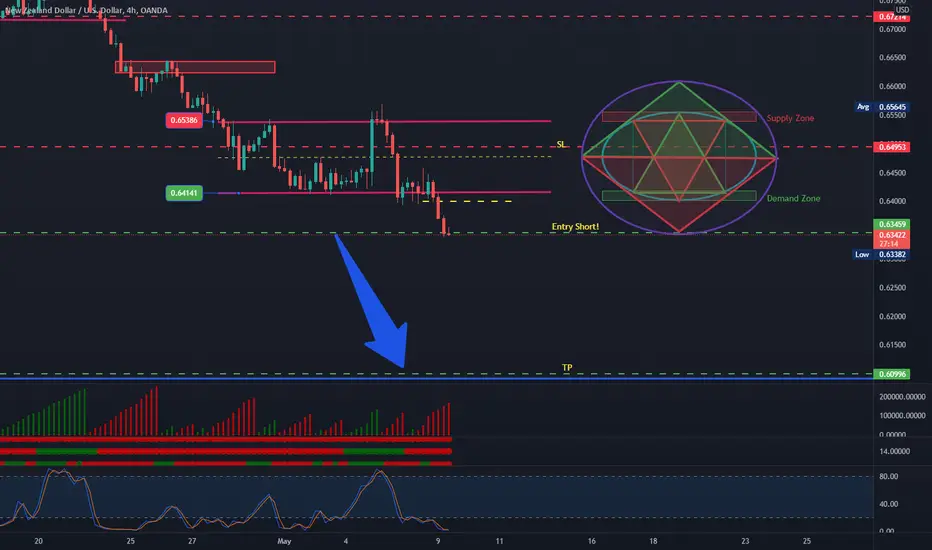
Wyckoff Logic Supply and Demand NZDUSD
Technical analysis
Cause, distribution, equilibrium sequence between demand and supply between quotas , supply zone 0.65386 & 0.64141 demand zone .
Supply greater than Demand!
Implications, bearish!
Pattern Drop base Drop!
Effect generated by approx
246 pips.
SL 0.64953
Entry 0.63459, sell!
TP 0.60996
⭕ = circle
⏹ = square
🔺️ = triangle
Unit = ⭕ market
Polarity = 🔺️demand & 🔻supply
Equilibrium = ⏹ range ("the ratio between supply and demand is =")
PRINCIPLE OF DEMAND AND SUPPLY
The law of supply and demand
- here the analysts study the relationship between supply and demand , having as a reference point the price and
volume over a period of time as shown on the chart.
KEY DEFINITION
The law of supply and demand is of the utmost importance. If the application to
buy an instrument (currency pairs, stocks, commodities , metals, bonds, cryptocurrencies)
is higher than the available supply, the only way the demand can be met is
for the price to rise to a level that attracts enough supply to match demand.
When this point is reached, the price does not advance. If the offer to sell is
higher than the demand to buy, the only way the supply will be absorbed is as
the price drops to a point that attracts enough demand to absorb all
the amount. When that happens, the price doesn't go down.

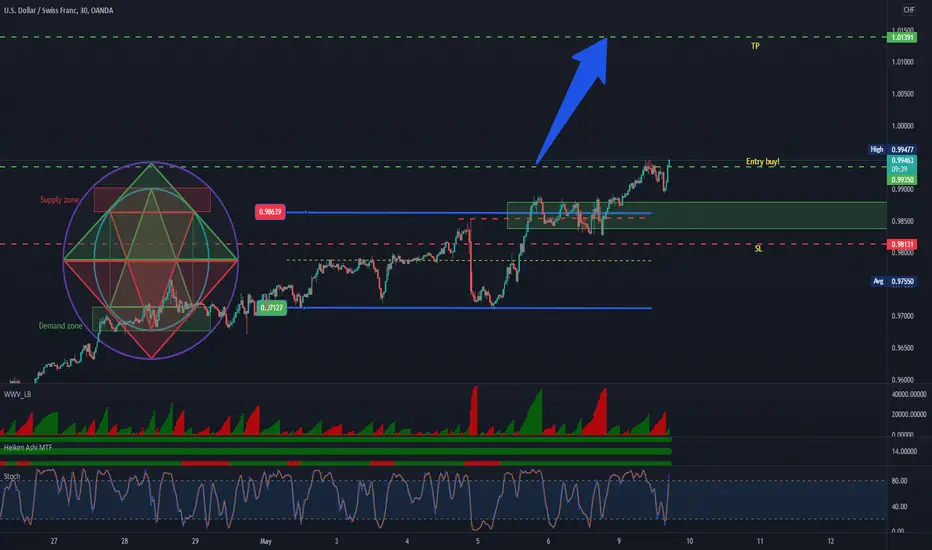
Wyckoff Logic Supply and DemandUSDCHF
Technical analysis
Cause, accumulation, equilibrium sequence between demand and supply between quotas, 0.98639 supply zone & 0. 97127 demand zone .
Demand greater than supply!
Pattern Drop base Rally!
Implications, bullish!
The effect generated by approx 200 pips!
SL 0.98131
Entry 0.99408, buy!
TP 1.01391
⭕ = circle
⏹ = square
🔺️ = triangle
Unit = ⭕ market
Polarity = 🔺️demand & 🔻supply
Equilibrium = ⏹ range ("the ratio between supply and demand is =")
PRINCIPLE OF DEMAND AND SUPPLY
The law of supply and demand
- here the analysts study the relationship between supply and demand , having as a reference point the price and
volume over a period of time as shown on the chart.
KEY DEFINITION
The law of supply and demand is of the utmost importance. If the application to
buy an instrument (currency pairs, stocks, commodities , metals, bonds, cryptocurrencies)
is higher than the available supply, the only way the demand can be met is
for the price to rise to a level that attracts enough supply to match demand.
When this point is reached, the price does not advance. If the offer to sell is
higher than the demand to buy, the only way the supply will be absorbed is as
the price drops to a point that attracts enough demand to absorb all
the amount. When that happens, the price doesn't go down.
SANDUSDT DOWNTREND CONTINUATION OR REVERSAL ?
Hello Traders,
Before we start to discuss, I'll be so glad if you share your opinion on this post's comment section and hit the like button if you enjoyed it!
- Checking our 1D time chart frame we can see that SAND is in bearish mode that began in November 2021, price action has responded to a descending trendline and tumbled 75.4% from the All-Time High of $8.44. The traders are
actively selling at this upper trendline, restricting any significant bull run.
-On the other hand, the buyers had defended the $2.6 support since last quarter, preventing any excessive loss. Thus, the price action got sandwiched between the descending trendline and stiff support, yet buyers failed to hold this
important support level and the price went down to psychological support 2$ , moreover on April 30th the sellers managed a daily candle closing below the $2 support, suggesting another leg down. However, this breakdown was not
that significant, and the price jumped above $2 soon after. The $2 support is an important support level ( demand zone ) as well acting as an psychological support .
- I suggest 2 scenarios :
- Bullish scenario : Buyers will try to push the price again to S/R $2.6 , breaking this level will give us a sign that buyers trying to take control and will push the price higher in order to break the descending trendline which it will be our
trigger for bullish reversal uptrend
- Bearish Scenario : In attempt for a pullback , buyers are facing a stiff S/R $2.6 and 20 EMA acting as dynamic resistance to this price which will cause the price to dip again to level support $2 then price would accumulate for a certain
time or even price can continue its downward move to level support $1.11 .
Until now SAND is still trading in bearish mode until a new confirmation from buyers , will be watching 1D candle close above this level support $2 to take an idea where the next move would take in
Good Luck Traders!

US30 POTENTIAL SHORTSPrice has a potential for the downside upon the retest of the sell zone.Wait for lower timeframe confirmation to confirm the move.

US30 POTENTIAL SHORTSPrice has a potential for the downside upon the retest of the previously formed bearish orderblock.Wait for your own confirmations to confirm the move.

NEOUSDT bottom found? ready to reverse?The price is testing the lower trendline of the ascending channel and the monthly support on 20.76$
on the lower timeframe, the price is creating a bear flag on it and the market got a rejection from the supply zone.
How to approach?
The price confirmed the 0.886 Fibonacci level as valid support on the daily static support on 19.7$. So if the price is going to have a breakout from the supply zone and ascending 4h channel, According to Plancton's strategy , we can set a nice order
–––––
Keep in mind.
🟣 Purple structure -> Monthly structure.
🔴 Red structure -> Weekly structure.
🔵 Blue structure -> Daily structure.
🟡 Yellow structure -> 4h structure.
–––––
Follow the Shrimp 🦐

JICPT| Bullish setup of S&P on daily(4327-4400)Hello everyone. The recent sharp uprising of the US 10Y yield weighed on the stock market indices, including S&P.
However, it started to attract my attention as price approached to 4400 where Fib as well as flip level sit.
This is a simple bullish setup with high probability. I set alert around 4400 and will check the arrival on smaller timeframes to the entry.
What do you think? Give me a like if you're with me.

