POSSIBLE BEARISH CONTINUATION ON GOLDBased on price action, Gold presents a very bearish sentiment from the daily point of view.
The indicated supply region may be the area of interest for the build up of the sells if indeed Gold is bound for the monthly lows.
Confirmation is needed for an entry.
Supply Zone

US100 Index – Potential Bearish Reversal in Key Resistance Zone🧠 US100 Index – Potential Bearish Reversal in Key Resistance Zone
Timeframe: 30-Minute | Chart Published: July 24, 2025
---
🔍 Overview
The US100 (NASDAQ) has been trading in a well-structured ascending channel, forming higher highs and higher lows. However, recent price action suggests that the index is testing a critical supply zone near 23,400, with signs of weakening bullish momentum. This may signal a potential corrective phase or bearish reversal.
---
📈 Technical Analysis Breakdown
🔵 Trend Structure:
Price is respecting a clear ascending trendline (blue), connecting multiple higher lows.
Multiple bullish flag/channel formations have been completed within the uptrend, showing healthy momentum until the current point.
🟥 Resistance Zone:
Strong supply zone marked between 23,250 – 23,450.
Price action shows stalling candles and rejection wicks within this zone, indicating buyer exhaustion.
⚠ Bearish Patterns:
The red path projection suggests a head and shoulders-like structure forming at the top of the channel.
This, along with divergence in wave strength and shrinking momentum, supports a potential reversal.
🔵 Key Support:
First support lies around 23,000 — aligning with the ascending trendline and previous consolidation.
If broken, next demand zone is around 22,835 – 22,900, where historical consolidation took place.
---
🔁 Projected Scenario (as per visual path)
1. Price may attempt one last push into the 23,400–23,450 zone (possible false breakout).
2. Rejection from this level could trigger a fall toward the ascending trendline support.
3. A confirmed break of the trendline can lead to a larger correction toward the 22,800 zone.
---
🧠 Unique Insight
This chart combines multi-timeframe structure recognition with a real-time reversal formation inside a long-standing bullish trend. The analysis doesn’t just rely on textbook patterns—it recognizes real-time price behavior shifts, which makes it valuable for proactive traders.
---
📌 Conclusion
While the trend remains bullish overall, caution is warranted as the US100 approaches a historically significant resistance zone. The setup offers a compelling risk-reward short opportunity for aggressive traders, especially if the price confirms a break below trendline support.
---
🔧 Next Steps for Viewers
> “Watch for a clean rejection candle or lower high at resistance before entering short. If trendline breaks cleanly, 22,835 could be the next target zone.”

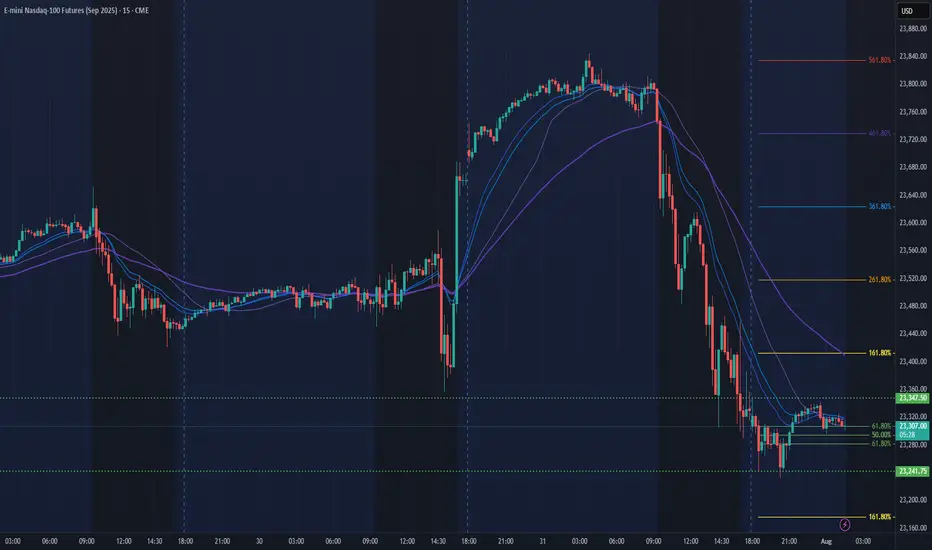
NQ Power Range Report with FIB Ext - 8/1/2025 SessionCME_MINI:NQU2025
- PR High: 23347.50
- PR Low: 23241.75
- NZ Spread: 236.0
Key scheduled economic events:
08:30 | Average Hourly Earnings
- Nonfarm Payrolls
- Unemployment Rate
09:45 | S&P Global Manufacturing PMI
10:00 | ISM Manufacturing PMI
- ISM Manufacturing Prices
Engulfing daily bar from ATH into new week lows
Session Open Stats (As of 12:45 AM 8/1)
- Session Open ATR: 262.82
- Volume: 45K
- Open Int: 280K
- Trend Grade: Long
- From BA ATH: -2.2% (Rounded)
Key Levels (Rounded - Think of these as ranges)
- Long: 23811
- Mid: 22096
- Short: 20383
Keep in mind this is not speculation or a prediction. Only a report of the Power Range with Fib extensions for target hunting. Do your DD! You determine your risk tolerance. You are fully capable of making your own decisions.
BA: Back Adjusted
BuZ/BeZ: Bull Zone / Bear Zone
NZ: Neutral Zone
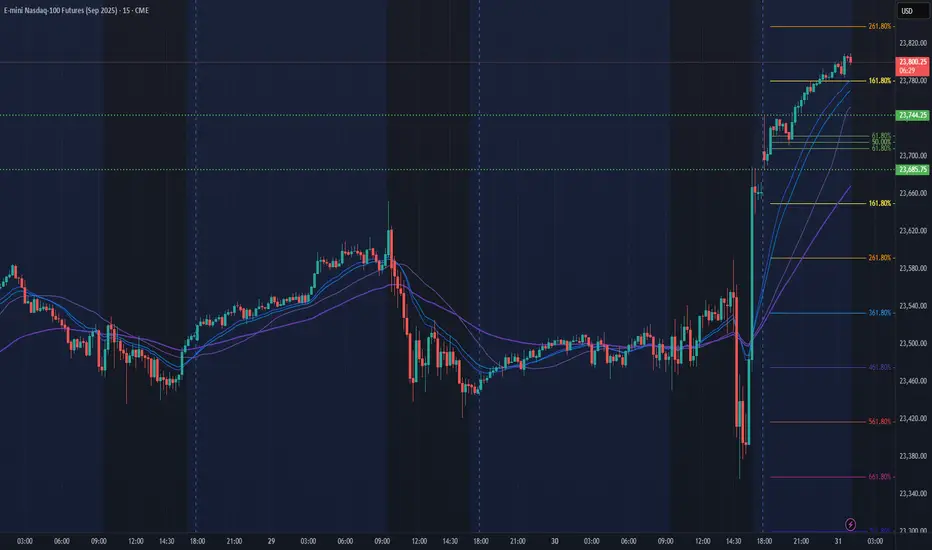
NQ Power Range Report with FIB Ext - 7/31/2025 SessionCME_MINI:NQU2025
- PR High: 23744.25
- PR Low: 23686.00
- NZ Spread: 130.5
Key scheduled economic events:
08:30 | Initial Jobless Claims
- Core PCE Price Index (MoM|YoY)
09:45 | Chicago PMI
New ATHs through Asian hours
Session Open Stats (As of 12:25 AM 7/31)
- Session Open ATR: 244.46
- Volume: 32K
- Open Int: 283K
- Trend Grade: Long
- From BA ATH: -0.6% (Rounded)
Key Levels (Rounded - Think of these as ranges)
- Long: 23811
- Mid: 22096
- Short: 20383
Keep in mind this is not speculation or a prediction. Only a report of the Power Range with Fib extensions for target hunting. Do your DD! You determine your risk tolerance. You are fully capable of making your own decisions.
BA: Back Adjusted
BuZ/BeZ: Bull Zone / Bear Zone
NZ: Neutral Zone
Massive Base Formation on Charts – Potential Multibagger LoadingThere are two Chart of HIMATSINGKA SEIDE.
Himatsingka Seide is forming a symmetrical broadening wedge pattern on the weekly timeframe, with a strong support zone near ₹100.
On the daily timeframe, Himatsingka Seide is forming an ascending broadening wedge pattern, with a crucial support level near ₹135.
If this level is Sustain then we may see higher prices in Himatsingka Seide.
Thank You !!

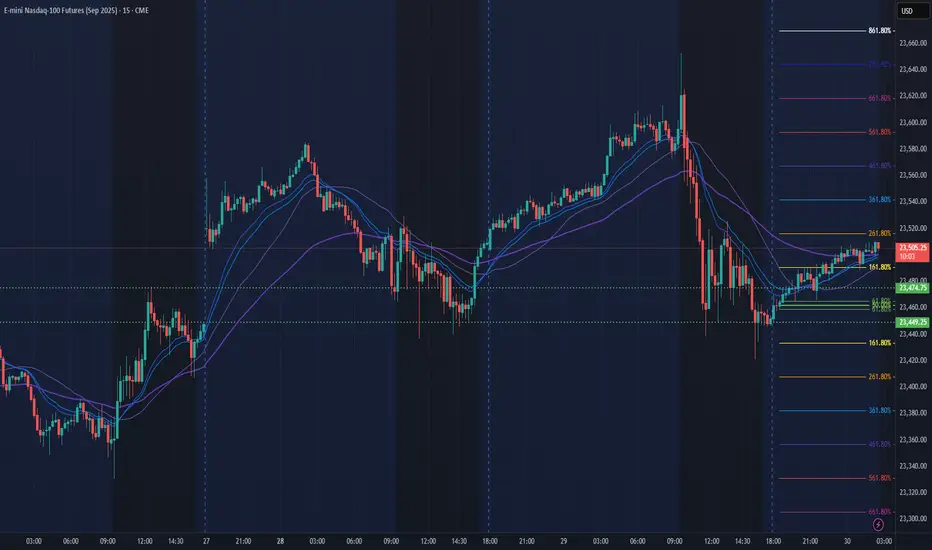
NQ Power Range Report with FIB Ext - 7/30/2025 SessionCME_MINI:NQU2025
- PR High: 23474.75
- PR Low: 23449.25
- NZ Spread: 57.0
Key scheduled economic events:
08:15 | ADP Nonfarm Employment Change
08:30 | GDP
10:30 | Crude Oil Inventories
14:00 | FOMC Statement
- Fed Interest Rate Decision
14:30 | FOMC Press Conference
AMP temp margins increase anticipating vol spike for economic events
Session Open Stats (As of 12:25 AM 7/30)
- Session Open ATR: 232.98
- Volume: 16K
- Open Int: 281K
- Trend Grade: Long
- From BA ATH: -0.6% (Rounded)
Key Levels (Rounded - Think of these as ranges)
- Long: 23811
- Mid: 22096
- Short: 20383
Keep in mind this is not speculation or a prediction. Only a report of the Power Range with Fib extensions for target hunting. Do your DD! You determine your risk tolerance. You are fully capable of making your own decisions.
BA: Back Adjusted
BuZ/BeZ: Bull Zone / Bear Zone
NZ: Neutral Zone
DOGE Looking Strong as Support HoldsDOGE Looking Strong as Support Holds
🔹 1. Support Zone Validated
The chart shows Dogecoin retested the lower boxed region around $0.221–$0.223, and bounced sharply from that zone. Given the heavy spike in volume during the retest, this suggests aggressive buying and accumulation—a hallmark of bullish conviction.
CryptoRank
The Tradable
🔹 2. Fibonacci 0.618 Support Bounce
On the 4‑hour timeframe, DOGE held firm above the critical Fibonacci 61.8% retracement level, and delivered a strong rebound—indicating technical significance and buyer interest at this level.
Blockchain News
🔹 3. Double-Bottom + Trendline Breakout
Analysts have identified a classic double-bottom formation, with price clearing the neckline (~$0.230–$0.231) and then retesting it successfully. Holding this retest confirms a breakout, suggesting more upside ahead.
Crypto Basic
🔹 4. Whale Activity & Accumulation
On-chain data shows $250 million in Dogecoin accumulation by whales, especially around the support zone—creating a structural demand base and reinforcing the bullish setup.
CoinCentral
🎯 Price Targets & Key Levels
Scenario Levels Rationale
Bullish continuation $0.239–$0.241 union resistance First resistance zone—price must reclaim to continue bullish momentum
$0.260–$0.280 Reclaiming $0.241 could open room toward mid‑channel resistance or prior highs
$0.300+ Potential target if momentum sustains and broader breakout occurs
Bearish invalidation $0.223 support Invalid break below suggests fading momentum—risk of correction to $0.215–$0.218
$0.215–$0.218 Secondary support zone if expansion of sell side continues
⚙️ Trade Setup for a Bullish Bias
Entry Focus: Consider entering long near $0.223 if price retests and holds, with a tight stop just below support.
Stop-Loss Zone: Slightly beneath $0.221 to account for volatility.
Targets: Scale out around $0.241, with larger targets at $0.260–$0.280, and possibly $0.30+ on sustained strength.
Confirmation: Watch for rising volume, break and close above resistance zones, and bullish indicator alignment.
⚡ Market Sentiment & Broader Themes
Momentum Shift: A bearish retrace reversed quickly amid accumulation, suggesting strong buyer commitment.
CryptoRank
The Tradable
AInvest
Double Bottom Status: Analyst commentary supports a reversal setup, with targets toward $0.310–$0.46 if the neckline holds.
Crypto Basic
AInvest
CryptoRank
Macro View: DOGE remains within a bullish channel; some forecasts project

EUR/USD 30-MIN ANALYSISThis EURUSD setup showcases a clean bullish continuation scenario following a confirmed Break of Structure (BOS) and a sharp rally driven by momentum and liquidity imbalance.
After sweeping a key low (XXX), price impulsively broke structure to the upside, confirming a potential shift in market intent. A retracement is now expected to mitigate the Buy-Side Imbalance (BISI) zone.
BOS & SSS (Short-Term Structural Shift): Confirmed bullish intent.
Imbalance (BISI): Price left behind an unfilled imbalance zone a likely magnet for a pullback.
Re-Entry Zone: (BISI) provides a high probability area for long re-entry.
Upside Targets:
Target 1: 1.15483 – intermediate structural level.
Target 2: 1.16158 – premium supply / liquidity target.
#EURUSD 30M Technical Analysis Expected Move.

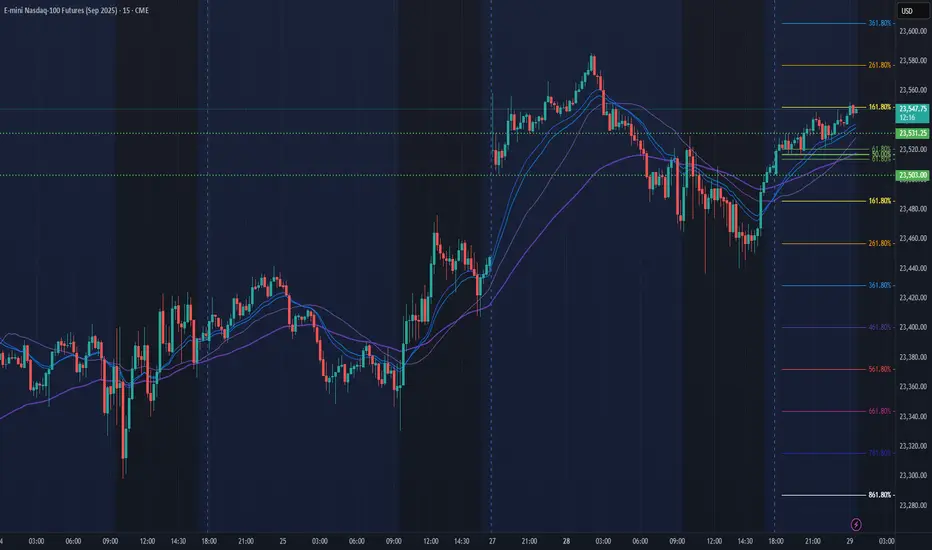
NQ Power Range Report with FIB Ext - 7/29/2025 SessionCME_MINI:NQU2025
- PR High: 23531.00
- PR Low: 23503.00
- NZ Spread: 62.5
Key scheduled economic events:
10:00 | CB Consumer Confidence
- JOLTs Job Openings
Session Open Stats (As of 12:25 AM 7/29)
- Session Open ATR: 233.38
- Volume: 17K
- Open Int: 280K
- Trend Grade: Long
- From BA ATH: -0.2% (Rounded)
Key Levels (Rounded - Think of these as ranges)
- Long: 23811
- Mid: 22096
- Short: 20383
Keep in mind this is not speculation or a prediction. Only a report of the Power Range with Fib extensions for target hunting. Do your DD! You determine your risk tolerance. You are fully capable of making your own decisions.
BA: Back Adjusted
BuZ/BeZ: Bull Zone / Bear Zone
NZ: Neutral Zone
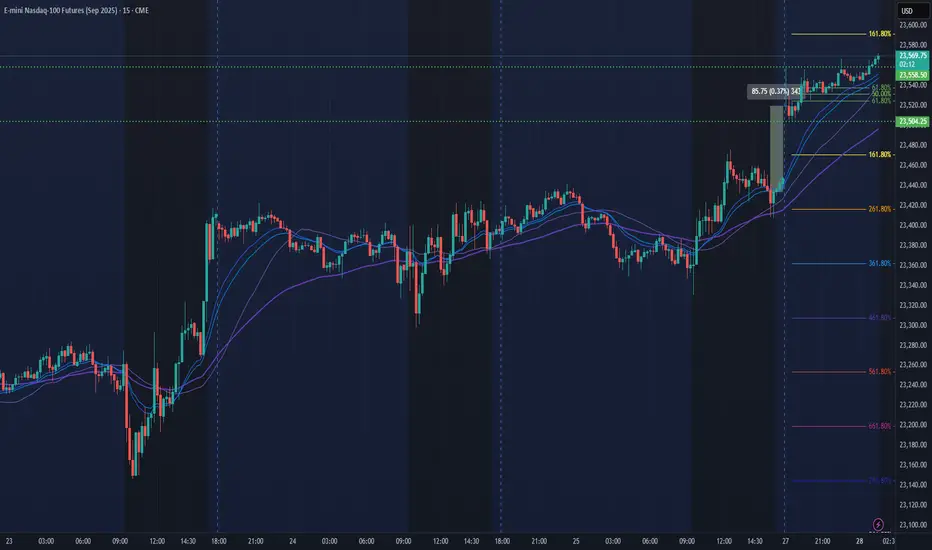
NQ Power Range Report with FIB Ext - 7/28/2025 SessionCME_MINI:NQU2025
- PR High: 23558.25
- PR Low: 23504.00
- NZ Spread: 121.25
No key scheduled economic events
Weekend gap up of 0.37% into new ATH
Session Open Stats (As of 12:25 AM 7/28)
- Session Open ATR: 245.44
- Volume: 23K
- Open Int: 276K
- Trend Grade: Long
- From BA ATH: -0.0% (Rounded)
Key Levels (Rounded - Think of these as ranges)
- Long: 23811
- Mid: 22096
- Short: 20383
Keep in mind this is not speculation or a prediction. Only a report of the Power Range with Fib extensions for target hunting. Do your DD! You determine your risk tolerance. You are fully capable of making your own decisions.
BA: Back Adjusted
BuZ/BeZ: Bull Zone / Bear Zone
NZ: Neutral Zone
EURNZD ShortAfter a recent Market Structure Shift (MSS) signaling a bearish direction, I'm looking to short at 1.95692. The supply zone aligns perfectly with the 61.8% retracement level, and there's a potential liquidity/inducement level forming, adding confluence to the trade.

NAS100 Supply and Demand Case StudyIt was a classic bullish week. If you have any questions lmk in the comments.

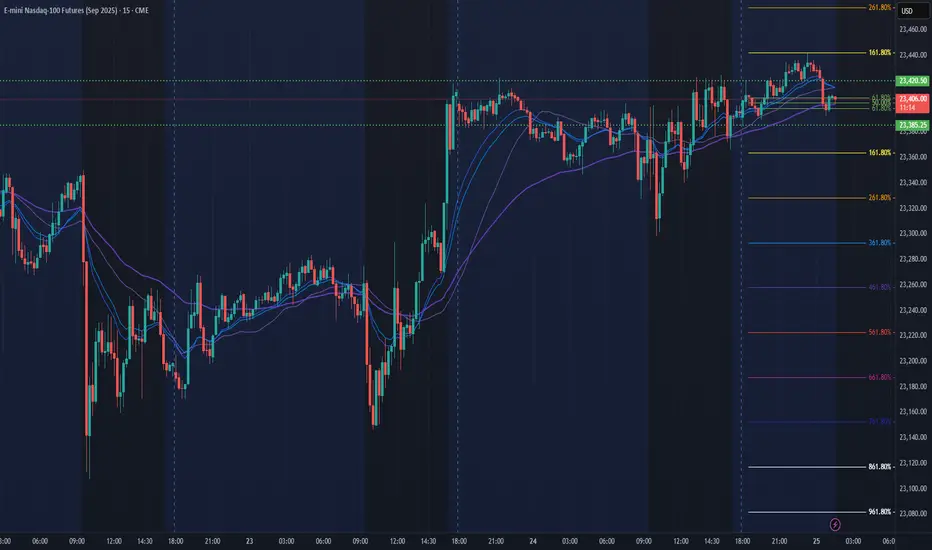
NQ Power Range Report with FIB Ext - 7/25/2025 SessionCME_MINI:NQU2025
- PR High: 23420.50
- PR Low: 23385.00
- NZ Spread: 79.5
Key scheduled economic events:
08:30 | Durable Goods Orders
Session open ATH break and retrace
Session Open Stats (As of 12:45 AM 7/25)
- Session Open ATR: 248.86
- Volume: 20K
- Open Int: 274K
- Trend Grade: Long
- From BA ATH: -0.0% (Rounded)
Key Levels (Rounded - Think of these as ranges)
- Long: 23811
- Mid: 22096
- Short: 20383
Keep in mind this is not speculation or a prediction. Only a report of the Power Range with Fib extensions for target hunting. Do your DD! You determine your risk tolerance. You are fully capable of making your own decisions.
BA: Back Adjusted
BuZ/BeZ: Bull Zone / Bear Zone
NZ: Neutral Zone
$HFTUSDT Trade Setup 6H.TSX:HFT Trade Setup (6H)
• Entry: CMP
• Stop Loss: $0.0709
• Targets:
T1: $0.0929
T2: $0.1251
Bullish breakout with clean retest.
The setup looks strong if support holds.
DYOR, NFA

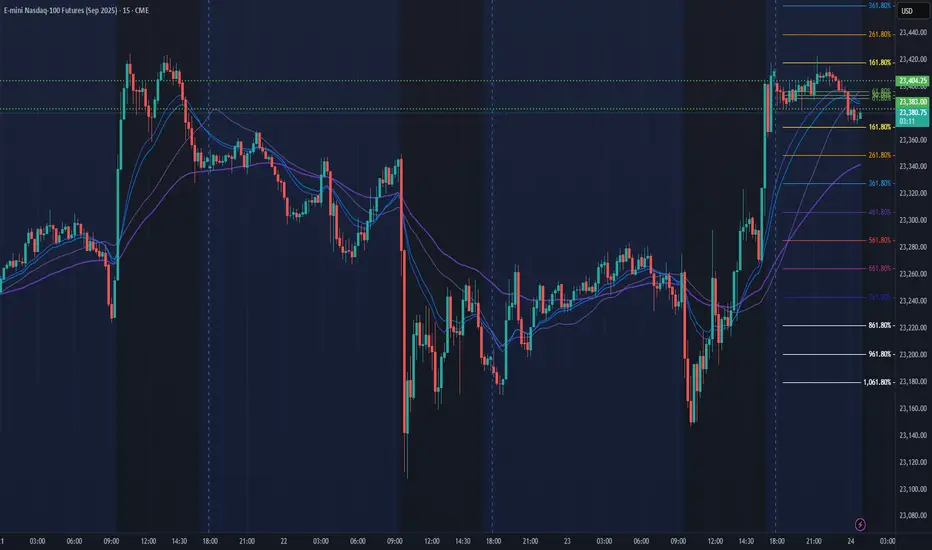
NQ Power Range Report with FIB Ext - 7/24/2025 SessionCME_MINI:NQU2025
- PR High: 23404.25
- PR Low: 23383.00
- NZ Spread: 47.75
Key scheduled economic events:
08:30 | Initial Jobless Claims
09:45 | S&P Global Manufacturing PMI
- S&P Global Services PMI
10:00 | New Home Sales
Front run ATH, advertising breakout potential
Session Open Stats (As of 12:15 AM 7/24)
- Session Open ATR: 258.10
- Volume: 18K
- Open Int: 271K
- Trend Grade: Neutral
- From BA ATH: -0.1% (Rounded)
Key Levels (Rounded - Think of these as ranges)
- Long: 23811
- Mid: 22096
- Short: 20383
Keep in mind this is not speculation or a prediction. Only a report of the Power Range with Fib extensions for target hunting. Do your DD! You determine your risk tolerance. You are fully capable of making your own decisions.
BA: Back Adjusted
BuZ/BeZ: Bull Zone / Bear Zone
NZ: Neutral Zone
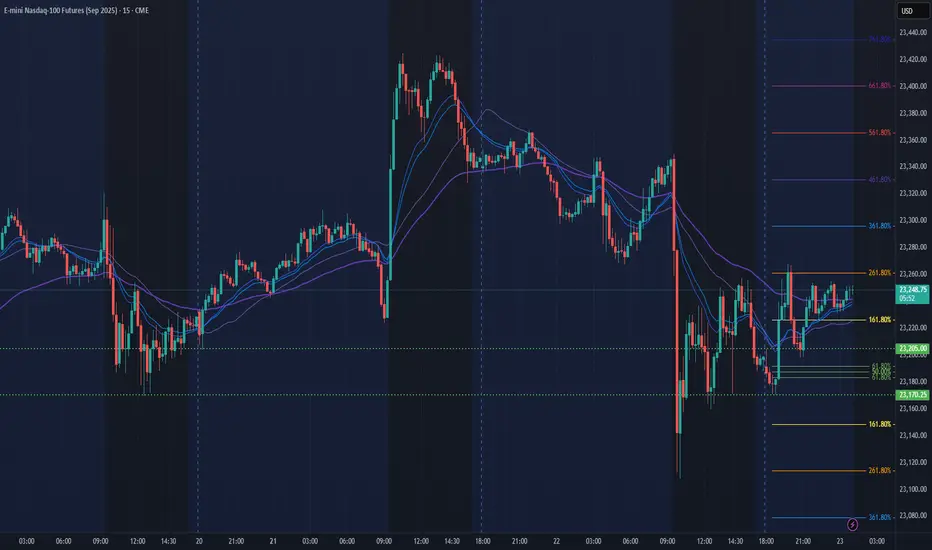
NQ Power Range Report with FIB Ext - 7/23/2025 SessionCME_MINI:NQU2025
- PR High: 23205.00
- PR Low: 23170.25
- NZ Spread: 77.75
Key scheduled economic events:
10:00 | Existing Home Sales
10:30 | Crude Oil Inventories
Session Open Stats (As of 12:25 AM 7/23)
- Session Open ATR: 261.82
- Volume: 34K
- Open Int: 270K
- Trend Grade: Neutral
- From BA ATH: -0.7% (Rounded)
Key Levels (Rounded - Think of these as ranges)
- Long: 23811
- Mid: 22096
- Short: 20383
Keep in mind this is not speculation or a prediction. Only a report of the Power Range with Fib extensions for target hunting. Do your DD! You determine your risk tolerance. You are fully capable of making your own decisions.
BA: Back Adjusted
BuZ/BeZ: Bull Zone / Bear Zone
NZ: Neutral Zone
Gold Market Update – Key Zones for the Next MoveHey gold lovers! As the NY session wraps up, the chart is a painting of tension: gold boxed tight between major structure — and the real action is only about to start.
Bias:
At this stage, gold remains in a short-term bullish structure as long as price holds above the 3421–3428 decision area. A break and hold below this zone would shift the bias to neutral or bearish for the next sessions.
🎨 What’s drawn on the chart?
🟥 3472–3478 Supply Zone:
The ceiling, still untouched — this is where every failed breakout has left a “scar” on the chart. If we finally reach this zone, watch for wicks, rejections, or that rare, clean breakout candle. Sellers and patient bulls are both watching for “the drawing” to be complete.
🟩 3383–3390 Demand Zone:
The real floor. On your chart, it’s the base built by strong bounces and those long wicks buyers left behind. If price falls here, it’s not just a line: it’s a zone where new rallies are born and the market might “paint” a major reversal.
🟦 The Middle is Just Noise
Price is coiling, painting confusion in the center — but the edge zones are where structure and opportunity live.
Don’t be the trader who gets erased in the chop. Let price draw the story at supply or demand before making your move.
💡 Plan for Tonight
Wait for price to reach 🟥 supply or 🟩 demand.
Watch the “drawing” — will you see a wick, a rejection, or a true breakout?
Only trade once the story is clear at the edges.
Drop your best chart art or scenario below!
like🚀🚀🚀and 🔔 Follow for real structure updates & daily market stories — let’s turn trading into a masterpiece, together.
GoldFxMinds

COINBASE I Strong Bearish Outlook (Take Action Now)Welcome back! Let me know your thoughts in the comments!
** COINBASE Analysis - Listen to video!
We recommend that you keep this stock on your watchlist and enter when the entry criteria of your strategy is met.
Please support this idea with a LIKE and COMMENT if you find it useful and Click "Follow" on our profile if you'd like these trade ideas delivered straight to your email in the future.
Thanks for your continued support!

NQ Power Range Report with FIB Ext - 7/22/2025 SessionCME_MINI:NQU2025
- PR High: 23353.00
- PR Low: 23336.00
- NZ Spread: 38.0
Key scheduled economic events:
08:30 | Fed Chair Powell Speaks
Session Open Stats (As of 1:45 AM 7/22)
- Session Open ATR: 260.85
- Volume: 19K
- Open Int: 277K
- Trend Grade: Neutral
- From BA ATH: -0.1% (Rounded)
Key Levels (Rounded - Think of these as ranges)
- Long: 23811
- Mid: 22096
- Short: 20383
Keep in mind this is not speculation or a prediction. Only a report of the Power Range with Fib extensions for target hunting. Do your DD! You determine your risk tolerance. You are fully capable of making your own decisions.
BA: Back Adjusted
BuZ/BeZ: Bull Zone / Bear Zone
NZ: Neutral Zone
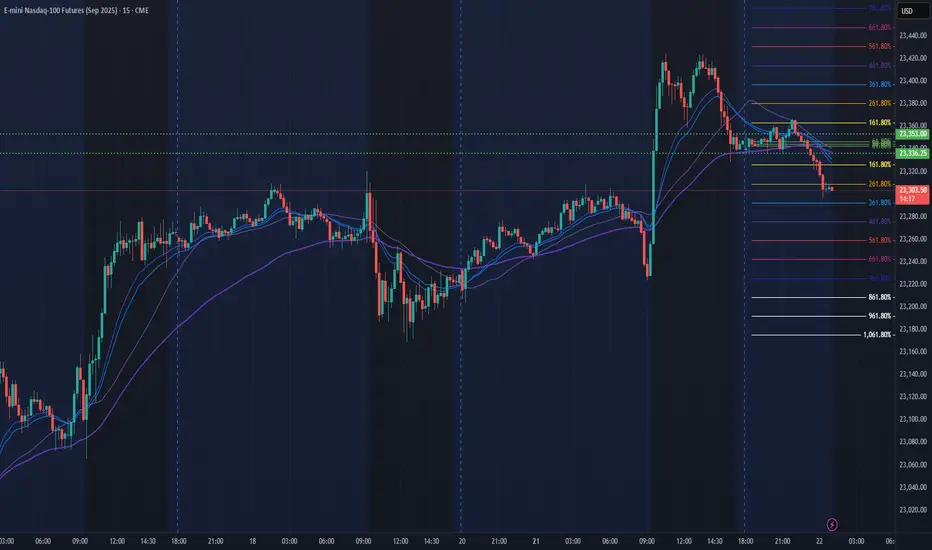
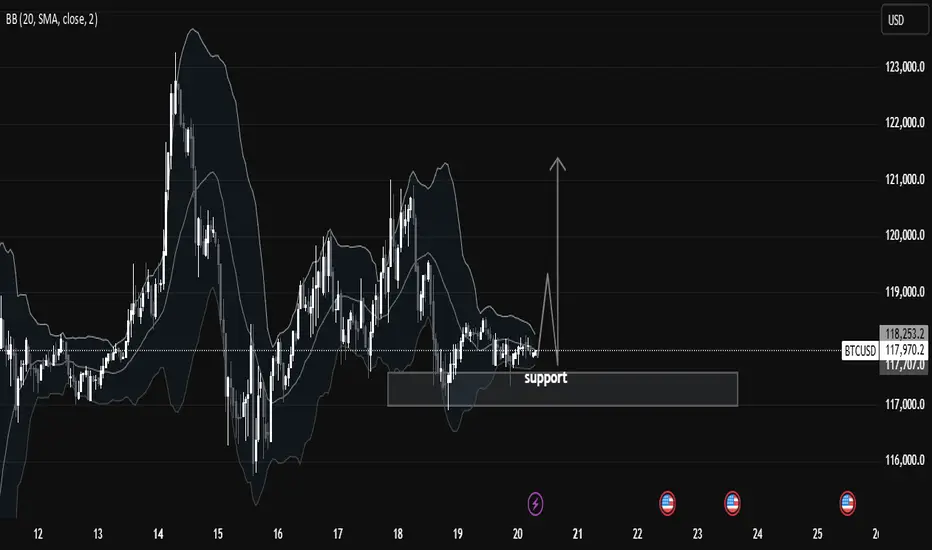
Chart Analysis: BTCUSD Consolidating at Key Support LevelIn this 1-hour BTCUSD chart, we observe that price is currently respecting a key support zone between $117,500 and $118,000, which has held strongly over the past few sessions. This region has acted as a strong demand zone, with visible buying pressure every time the price dips into it. The chart clearly shows multiple rejections from this zone, indicating that smart money participants are accumulating here.
We also see the Bollinger Bands (20 SMA) tightening around the price. This narrowing of the bands signifies low volatility and a potential expansion move. Such squeezes are often followed by impulsive breakouts or breakdowns, and traders should be alert for a decisive candle close above or below the range to confirm direction.
🧠 Market Structure & Technical Insights:
Support Holding: Price is consolidating above a major support level at $117,500–$118,000, which has been tested multiple times but not broken.
Accumulation Phase: The sideways structure after a previous impulsive move suggests that price is possibly in a re-accumulation phase before another leg up.
Liquidity Above Range: There's a visible liquidity pool above recent highs (~$118,600–$119,000), which could be targeted if bulls take control.
Volatility Squeeze: Bollinger Bands are compressing, showing signs of accumulation. Such patterns typically lead to a breakout move, especially if paired with volume.
Candle Behavior: Long wicks from below the support show aggressive buying interest, rejecting lower prices. This is a bullish signal.
🎯 Potential Scenarios:
1. Bullish Breakout:
If BTCUSD breaks and closes above the mini resistance near $118,600–$119,000, we may see a quick move toward $120,500 and $122,000.
A breakout backed by volume and momentum would confirm strength and trend continuation.
2. Bearish Breakdown:
A break below $117,500 with a strong bearish candle and increased volume would invalidate the bullish bias and may open the downside toward $116,000 and possibly $114,500.
This would indicate failure to hold support, transitioning into a distribution phase.
3. Range-Bound:
Until we get a clear break in either direction, price may continue to range between $117,500 and $118,600. Best approach is to remain patient and wait for breakout confirmation.
📚 Educational Note:
This is a textbook setup for many smart money traders—a compression near a strong support level with low volatility. Such patterns reflect market indecision, but also the potential energy build-up for a significant move. Traders should focus on risk management and confirmation instead of predicting direction blindly.
✅ Key Levels to Watch:
Support: $117,500
Resistance: $118,600 – $119,000
Breakout Target: $120,500 – $122,000
Breakdown Target: $116,000 – $114,500
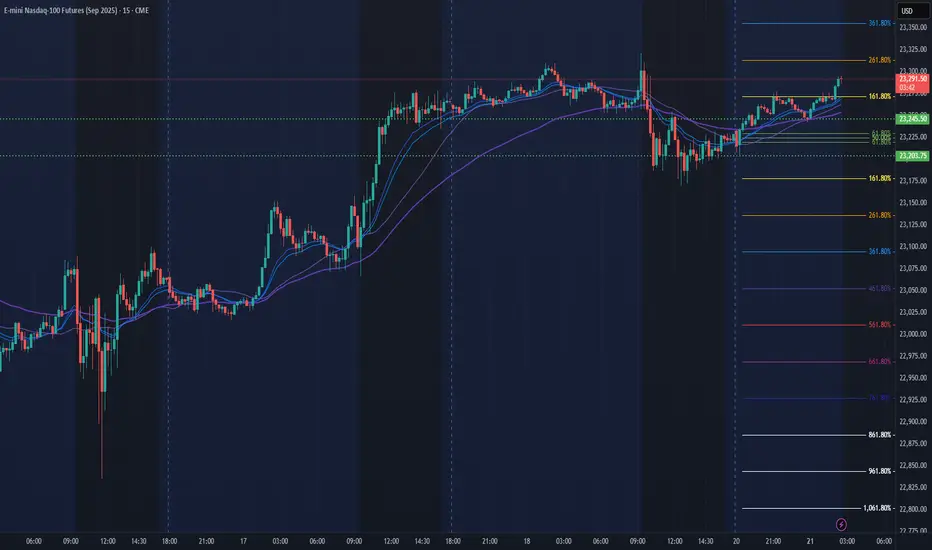
NQ Power Range Report with FIB Ext - 7/21/2025 SessionCME_MINI:NQU2025
- PR High: 23203.75
- PR Low: 23245.50
- NZ Spread: 93.25
No key scheduled economic events
In range to continue pushing ATH
Session Open Stats (As of 1:45 AM 7/21)
- Session Open ATR: 266.36
- Volume: 21K
- Open Int: 274K
- Trend Grade: Neutral
- From BA ATH: -0.1% (Rounded)
Key Levels (Rounded - Think of these as ranges)
- Long: 23811
- Mid: 22096
- Short: 20383
Keep in mind this is not speculation or a prediction. Only a report of the Power Range with Fib extensions for target hunting. Do your DD! You determine your risk tolerance. You are fully capable of making your own decisions.
BA: Back Adjusted
BuZ/BeZ: Bull Zone / Bear Zone
NZ: Neutral Zone
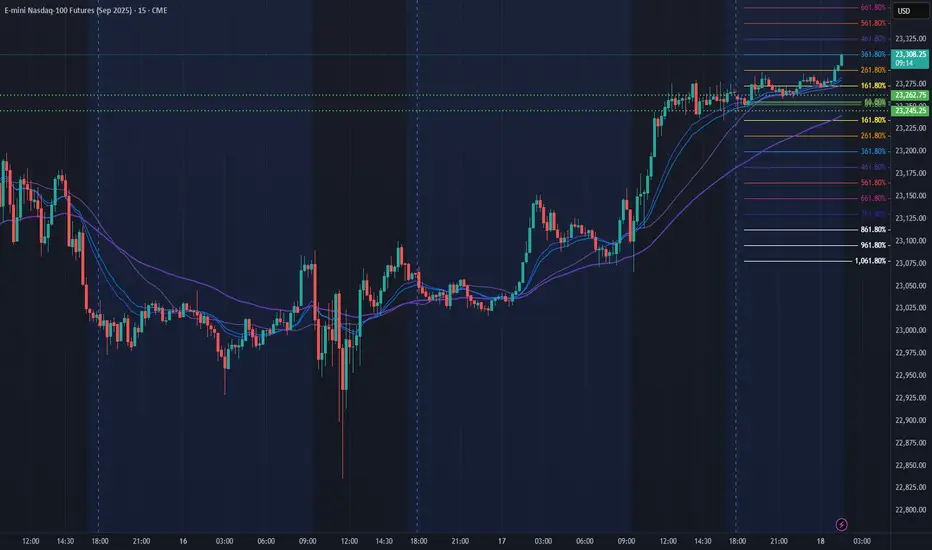
NQ Power Range Report with FIB Ext - 7/18/2025 SessionCME_MINI:NQU2025
- PR High: 23262.75
- PR Low: 23245.25
- NZ Spread: 39.0
No key scheduled economic events
Pushing ATH through overnight hours
Session Open Stats (As of 1:15 AM 7/18)
- Session Open ATR: 272.56
- Volume: 18K
- Open Int: 286K
- Trend Grade: Neutral
- From BA ATH: -0.0% (Rounded)
Key Levels (Rounded - Think of these as ranges)
- Long: 23811
- Mid: 22096
- Short: 20383
Keep in mind this is not speculation or a prediction. Only a report of the Power Range with Fib extensions for target hunting. Do your DD! You determine your risk tolerance. You are fully capable of making your own decisions.
BA: Back Adjusted
BuZ/BeZ: Bull Zone / Bear Zone
NZ: Neutral Zone
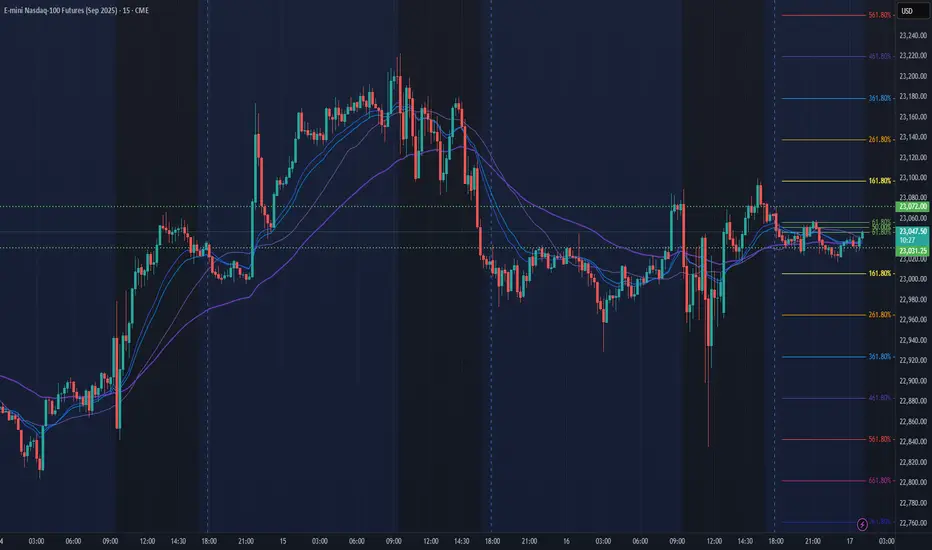
NQ Power Range Report with FIB Ext - 7/17/2025 SessionCME_MINI:NQU2025
- PR High: 23072.00
- PR Low: 23031.25
- NZ Spread: 91.25
Key scheduled economic events:
08:30 | Initial Jobless Claims
- Retail Sales (Core|MoM)
- Philadelphia Fed Manufacturing Index
Session Open Stats (As of 12:35 AM 7/17)
- Session Open ATR: 274.88
- Volume: 18K
- Open Int: 268K
- Trend Grade: Neutral
- From BA ATH: -0.8% (Rounded)
Key Levels (Rounded - Think of these as ranges)
- Long: 23239
- Mid: 21525
- Short: 20383
Keep in mind this is not speculation or a prediction. Only a report of the Power Range with Fib extensions for target hunting. Do your DD! You determine your risk tolerance. You are fully capable of making your own decisions.
BA: Back Adjusted
BuZ/BeZ: Bull Zone / Bear Zone
NZ: Neutral Zone