$COIN Proverbial Stock Chart, Must See!NASDAQ:COIN We extrapolate the COIN facts that we can foresee price growth in the over-splendid crypto arena, but today might not be one of the memorable. In-fact, it will be so boring for you today, that I created this funny, proverbial, metaphorical stock chart to depict, denote, and serve a connotation to your experience. We hope you enjoy this art.
Trend analysis, price movement. simple!
Supply Zone

Breakout or breakdown? I'm SHORT here is whyHi fellow traders,
In this idea I have drawn daily supply and demand zones, although the zones of interest exist out of large ranges I think the combination of approaching both a long- and short-term supply zone and a forming rising wedge we are looking at a rejection from the 1h supply zone level.
I will wait on the lower timeframe to confirm the rejection, ideally have a bounce of the bottom of the rising wedge acting as resistance.
What do you think? Are we going to breakdown or breakout?
Happy trading ^^

Gold Trade : Bullish Momentum AheadXAUUSD has been making bullish trend through 2041 making higher highs and higher lows and is holding towards the liquidity zone 2506 2505.Price action and market structure also shows bullish trend and also a double bottom pattern is evident around the 2380 2385 level indicating a strong support area. there is also a news which would support us in bullish momentum
Our technical analysis and market indicators suggest a positive trend for gold in the next trading session. Investor can expect a potentially lucrative opportunity to capitalize on the bullish momentum.

EURUSD 19/8/24Starting off our week as always with EUR/USD, we have a very simple markup for you this week. We liquidated our four-hour high, which was created after the break of the previous structural high. This has now established a clear liquidity trajectory to the upside. We have an area of demand that sits around the 50% level of the last created range. This will be the first area where we will begin anticipating bullish price action. We’re currently waiting for the four-hour candle to close so we can form our new four-hour high.
The main principle here is that we expect price action to continue moving bullishly, but we are aware of the potential for higher time frame weekly price action to start leading the market with a bearish push. However, for now, we're only seeing upside momentum, so we will follow that. Please note that we have liquidity points marked within our swing structure. If we begin to fail at areas of demand, these could become potential targets. Price action is pretty clean right now, so let's just follow it and continue to track what price is showing us within our entry time frame.
Have an amazing week, and I hope you all trade safe.

US30Currently US30 is in bearish territory, which is strong supply zone and trendline resistance.
Will the sellers attack this area ?

$EURUSD | Sell Trade H4 | Execution | Technical Confluences:
- Stochastics just reversed off Overbought conditions in H4
- Price bounced off 123% Fibo Extension levels which coincides with a Supply Zone from before and also the top of a small Parallel Channel
- Looking at it move towards at least the lower end of the Parallel Channel
Fundamental Confluences:
- With so much of rate cut hype priced into the markets, it seems that market will start to consolidate and start profit taking.
- There are a few speakers who came out to say they don't seem to be in a rush to cut like what the market expect.
-----
Taking my 1st position for this FX:EURUSD sellb trade.
Targeted trade entry and stops can be seen in the highlighted zone. Blue for Profit Target and Orange for Stop Loss Target.
Risk/Reward ratio of 2.1.
DYOR.
-----

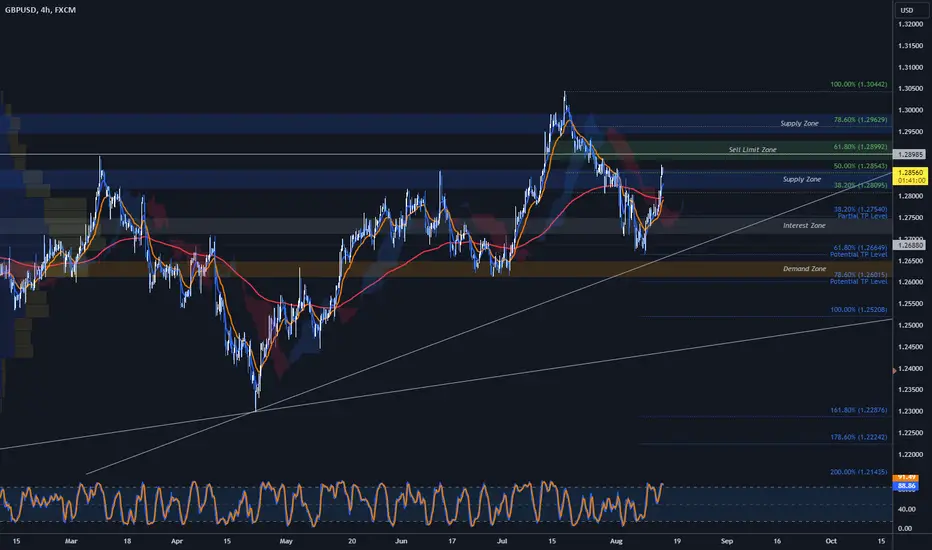
$GBPUSD | Sell Trade H4 | Execute & Sell Limits |Technical Confluences:
- Price action is between a 50 - 61% Fibo retracement range
- Horizontal trendline coincides with the 61% Fibo retracement levels
- Price is also at a Supply Zone range
- Stochastics on the H4 is in Overbought conditions
Fundamental Confluences:
- Market is reeling with the optimism of incoming FED cuts but FED seems to feel differently based on the few FED speaker's speeches
- The riots in the UK will definitely have some economic drag on the GDP
________________________________
Will be executing my 1st sell entry into FX:GBPUSD and set Sell Limit orders as show in the charts.
Targeting to TP approximately half the position at the 38% Fibo Extension levels (in blue) and move my SL levels to B/E.
Full TP are the 61%/78% Fibo Extension levels.
Remember, DYOR.
________________________________
Boosts 🚀, Follows ✌️, Shares 🙌 & Comments ✍️ are much appreciated!
If you have any ideas or charts, do share them in the 'Comments' section below and we can discuss our perspectives to improve or strengthen our strategies.
If you want something analyzed, do drop me a DM. :D
________________________________
Disclaimer: The above suggestion is an personal opinion in general and does not constitute as investment advice. Any decisions taken based on the above suggestion is purely your own risks. DYOR.
DIONEUSDTsee and watch :)
It is in a very good support range and has had a very good reaction... It seems that it will move towards the price ceiling from this range...

GBPAUD | Short D1 | Market Exec |Technical Confluences for Trade:
- Stochastics are close to Overbought Conditions on D1 and Overbought in both H1 and H4 time-frames
- Price action is close to a Supply Zone
- Price action is close to multiple Resistance Trendlines
Suggested Trade:
Entry @ Area of Interest 1.9270 - 1.9380
SL @ 1.9503
TP 1 @ 1.9017 (Close Half-Position & move SL to Entry level once TP1 is achieved)
TP 2 @ 1.8745
Risk-to-Reward @ Approx. 2.87 (Depending on Entry Level)
________________________________
Boosts 🚀, Follows ✌️, Shares 🙌 & Comments ✍️ are much appreciated!
If you have any ideas or charts, do share them in the 'Comments' section below and we can discuss our perspectives to improve or strengthen our strategies.
If you want something analyzed, do drop me a DM. :D
________________________________
Disclaimer: The above suggestion is an personal opinion in general and does not constitute as investment advice. Any decisions taken based on the above suggestion is purely your own risks.
Any websites / brokers / applications suggested here are also provided as informational purpose only.

8.3.2024 Oil Weekend Pre Market AnalysisIt's the weekend. I like to go out to my larger charts and clean off the entire chart and start analyzing the instrument for next weeks trading.
We know that price is going to move up or down from where it currently is located, so we just need to make up a game plan to trade it..
Looking out at the 4 hour, 1 hour, and 15 minute charts for our trend and target analysis. Then dialing it down to the 3 minute or 15 minute to look for an entry!

8.3.2024 Platinum Weekend Pre Market AnalysisIt's the weekend. I like to go out to my larger charts and clean off the entire chart and start analyzing the instrument for next weeks trading.
We know that price is going to move up or down from where it currently is located, so we just need to make up a game plan to trade it..
Looking out at the 4 hour, 1 hour, and 15 minute charts for our trend and target analysis. Then dialing it down to the 3 minute or 15 minute to look for an entry!

Gold Breakout Imminent? Uncover the Explosive Potential of GOLD!Current Trend
Bull Flag Formation: The chart indicates a bull flag pattern, a bullish continuation pattern that usually occurs after a strong uptrend (flagpole). The consolidation within the flag is typically a pause before the next upward move.
Trendlines: The yellow trendlines outlining the flag suggest that the price is currently testing the upper boundary of this consolidation range.
Fibonacci Retracement Levels
78.60%: This level is around 2431.637 (coincides with a 4HR LQZ), acting as a strong resistance zone.
61.80%: Around 2410.880, which the current price has just crossed, potentially indicating bullish momentum.
50.00%: Around 2393.940, served as a support level during the consolidation.
38.20%: Around 2372.760, another support level during the consolidation.
Liquidity Zones (LQZ)
4HR LQZ at 2431.637: A significant resistance zone that aligns with the 78.60% Fibonacci retracement level. This is a critical area to watch for potential price reaction.
4HR LQZ at 2349.449: A key support zone which held during the recent consolidation phase.
Price Action
Current Price: At 2410.880, the price is approaching the critical resistance at the 4HR LQZ (2431.637).
Breakout Potential: If the price can break and hold above the 2431.637 level, it may confirm the continuation of the bullish trend, targeting higher liquidity zones.
Support Levels: The price needs to stay above the 61.80% Fibonacci retracement level (2410.880) to maintain bullish momentum. A drop below could lead to further consolidation or a bearish reversal.
Daily Bull Flag
Upper Trendline: The price nearing the upper trendline of the daily bull flag indicates potential breakout if breached.
Lower Trendline: Support if the price pulls back.
Trading Strategy
Long Entry:
Upon a confirmed breakout above the 4HR LQZ at 2431.637, with a potential target of the next daily liquidity zone at 2475.281.
Use the 50.00% retracement level (2393.940) as a support for placing stop-loss to protect against downside risk.
Short Entry:
If the price fails to break above the 4HR LQZ and shows bearish reversal signs, a short trade could be considered with a target back to the lower 4HR LQZ at 2349.449.
Use the current price level (2410.880) as a resistance for stop-loss placement.
Risk Management:
Utilize appropriate position sizing and risk management to account for volatility and potential price fluctuations.
Summary
Bullish Outlook: If the price breaks above the 2431.637 level, indicating a continuation of the bull flag pattern, with targets at 2475.281 and beyond.
Bearish Outlook: If the price fails to break above 2431.637 and shows a reversal, potential downside targets include 2393.940 and 2349.449.
Monitoring the price action around these critical levels will be crucial in determining the next significant move for XAUUSD.

What is Support and Resistance in Trading. Key Levels Basics
In the today's article, we will discuss the absolute basics of technical analysis: support and resistance levels.
I will explain to you why support and resistance are important , how to identify them properly, and we will discuss what is the difference between support and resistance level and support or resistance zone.
Let's start with a definition of a support .
A support is a historically significant price level that lies below the current prices of an asset.
While a resistance is a historically significant price level that is above the current prices.
From a key resistance, a bearish movement will be anticipated in futures, while from a key support, a bullish reaction will be expected.
Take a look at EURAUD pair, we can see a perfect example of a key resistance level.
2 times in a row, the market dropped from that in the past, confirming its significance.
By a historical significance , I mean that the price reacted strongly to such price level in the past and a strong bullish, bearish movement initiated from that.
Above is the example of a key horizontal support on EURCHF. The underlined key level was respected by the market multiple times in the past.
From time to time, the market breaks key levels.
After a breakout , a support turns into resistance
and a resistance turns into support.
Above is the example of a breakout of a key support on GBPNZD, after its violation it turned into resistance from where a bearish movement followed.
Always remember, that in order to confirm a breakout of a key support, we strictly need a candle close below that.
By the way, the structure here is also the zone, but we will discuss it later on.
Above is the example of a breakout of a key resistance, that turned into support after a violation.
Very often, newbie traders ask me, how many times the price should react to a key level to make it valid.
I do believe that 1 time is more than enough, however, make sure that the reaction to that is strong .
Above are key support and resistance on GBPCAD. Even though both structures were respected just one time in the past, the reaction to them was strong enough to confirm that the underlined levels are the key levels.
However, historical significance of a key support or resistance is not enough to make it valid.
What matters is the most recent reaction of the price to that.
Key supports and resistance lose their significance with time, and your job as a technical analyst, is to stay flexible and adapt to changing market conditions, regularly updating your analysis.
Above is a key resistance level on AUDJPY from where the market dropped heavily 2 times in a row.
However, with time, the underlined resistance lost its significance.
Such a structure is not a key level anymore.
Remember a simple rule: if a key structure is not respected by the sellers, and by the buyers after its breakout.
Or vice versa: if a key structure is not respected by the buyers, and then by the sellers after its breakout.
Such a structure is not a key level , and you should not rely on that in the future.
In our example, the resistance was broken - it was neglected by the sellers. After the breakout, it should have turned into support, but the buyers also neglected that and the structure lost its strength.
Now, a couple of words about time frames,
you can identify key support and resistances on any time frame, but
the rule is that higher is the time frame, more significant are the supports and resistances there.
In my analysis, I primarily rely on support and resistance on a daily time frame.
Always remember that the financial markets are not perfect and the prices will quite rarely respect the exact support or resistance levels.
Quite often, the markets may fluctuate around key levels so it is highly recommendable to rely not on single key levels but on zones.
I recommend taking into consideration not only the exact level from where a strong reaction followed, but also a candle close level of such a candle.
The support zone above is based on a wick and a candle close of a candle.
Also, quite often there will be the situations when multiple key levels will lie close to each other.
In such a case, it is better to unite all this structures in one single zone.
Above we see multiple key resistances.
We will unite all these resistances into one single zone. The upper boundary of a resistance zone will be the highest wick and its lower boundary will be the highest candle close.
Above we have 2 key supports lying close to each other.
We will unite these supports into one single zone.
The lower boundary of a support zone will be the lowest wick and the upper boundary will be the lowest candle close.
Here is how a complete structure analysis should look.
Following the rules that we discussed, you should identify at least 2 closest key resistances and 2 closest key supports.
These structures will be applied as the entries for various trading strategies.
❤️Please, support my work with like, thank you!❤️

BANKNIFTYI Observed these Levels based on price action and Demand & Supply which is My Own Concept Called "PENDAM CONCEPTS" ... Please Don't Take any trades based on this chart/Post...because this chart is for educational purpose only not for Buy or Sell Recommendation.. Thank Q

XAUUSD - 1H a modest rise before more fallOANDA:XAUUSD I anticipate a modest rise in gold prices from the current support levels, which should serve as a pullback before a further decline. The technical analysis indicates strong support at the bottom of the trading range and the current support level, suggesting a temporary upward movement.
In the political arena, recent news that President Joe Biden has dropped out of the presidential race has significant implications. Vice President Kamala Harris has been introduced as his successor, altering the dynamics of the upcoming election. This shift has also led to a decrease in former President Donald Trump’s chances of reclaiming the White House. These political developments add a layer of uncertainty that typically benefits gold, a traditional safe haven asset.

USDJPY Opportunities for Both Bears and BullsHere’s an exciting update on USDJPY, which has something for both short-sellers and those looking to buy. Let’s dive in!
Current Overview:
- 4-Hourly Chart:
- There’s a sell zone, but the overall movement of USDJPY is on a bullish ride. :chart_with_upwards_trend:
Shorting Opportunity:
- Key Level: 157.69
- What to Do: If you’re looking to short, watch for a Magic Candle Confirmation within the sell zone (red box). The ideal entry would be at 157.69.
Buying Opportunity:
- Key Pattern: Potential Head and Shoulders Formation
- Key Level: 157.69
- What to Do: Like me, if you’re waiting to buy, this is the level to watch. Wait for a Magic Candle Confirmation at 157.69 to enter a long position, betting on a Potential Head and Shoulders Formation.
Final Thoughts:
Whether you’re looking to short or buy, the key is patience and waiting for confirmation. Trading is all about making informed decisions and managing risk effectively.
What’s your plan for USDJPY? Are you in the short camp or the long camp? Share your thoughts and strategies below!
Happy trading, everyone!

GOLD SELL OPPORTUNITY 15 MINSell from supply where imbalance was not filled completely leaving liquidity. Targeting large demand zone at 2444. Break of structure to the downside has also occurred.

AUDCAD SHORT TRADEAUDCAD SHORT
Entry point :- 0.91711
Stop lose :- 0.92666
Risk :- 0.50%
Target 1 :- 0.9076
Target 2 :- 0.8980

Revealing My Top Gold Trading Secrets for Huge Profits!In this video, I reveal my top trading secrets for making huge profits in gold trading (XAU/USD). This educational content will cover key technical analysis techniques and strategies that I frequently use in my charts, as well as valuable insights into trading mindset and proper risk management. Let's unlock the potential of your trading skills together!
Technical Approach:
In this educational segment, we'll focus on the core technical analysis principles that I use to make informed trading decisions. Here's a detailed breakdown of my approach:
Identifying the Trend:
Uptrends and Downtrends: Learn how to recognize market trends using higher highs and higher lows for uptrends, and lower highs and lower lows for downtrends.
Trendlines: Use trendlines to connect the highs and lows of price movements, helping to identify the direction of the trend and potential reversal points.
Support and Resistance Levels:
Support Levels: Identify areas where the price tends to find support as it falls, acting as a floor preventing further decline.
Resistance Levels: Identify areas where the price tends to find resistance as it rises, acting as a ceiling preventing further ascent.
Historical Price Action: Use past price movements to pinpoint key support and resistance levels that the market respects.
Liquidity Zones (LQZ):
Definition: Liquidity zones are areas on the chart where there is a high concentration of trading activity, often leading to significant price movements.
Identification: Learn how to spot these zones using volume profiles, order flow analysis, and historical price action.
Trading Strategy: Use liquidity zones to identify potential entry and exit points, as they often precede major price moves.
Volume Analysis:
Volume Spikes: Understand how volume spikes can indicate strong buying or selling interest, confirming the validity of price movements.
Volume Trends: Analyze volume trends to gauge the strength of a price trend and anticipate potential reversals.
Entry and Stop Loss Strategies:
Breakouts and Pullbacks: Enter trades on confirmed breakouts above resistance or below support, or on pullbacks to key levels within a trend.
Trailing Stop Loss: Implement a trailing stop loss to lock in profits as the trade moves in your favor, adjusting the stop loss level as the price progresses.
Mini Lessons: Mindset:
Patience and Discipline:
Patience: Wait for the right trading setups that meet your criteria, avoiding impulsive decisions.
Discipline: Stick to your trading plan and rules, even when the market becomes volatile or unpredictable.
Emotional Control:
Stay Calm: Keep your emotions in check to avoid making irrational decisions based on fear or greed.
Mindfulness: Practice mindfulness techniques to remain focused and calm, especially during stressful trading situations.
Proper Risk Management:
Position Sizing:
Risk Per Trade: Limit the amount of capital you risk on any single trade, typically 1-2% of your trading account.
Position Size Calculation: Calculate your position size based on the distance to your stop loss and your risk tolerance.
Risk-Reward Ratio:
Target Ratio: Aim for a risk-reward ratio of at least 2:1, meaning your potential profit should be at least twice your potential loss.
Trade Evaluation: Evaluate each trade based on its risk-reward ratio before entering, ensuring it aligns with your trading strategy.
By incorporating these technical strategies and mindset principles, you can enhance your trading performance and increase your chances of success in the gold market. Stay tuned for more educational content and trading insights!

fundamental mattersurea price analysis is mosre fundamental than technical.
i think its about 3 year floor price and will rise because of (KHARIF) session.
there is no action in market for now. lets see what will happen in late may and first half of june

GBPCHF - Strong Supply!Hello TradingView Family / Fellow Traders. This is Richard, also known as theSignalyst.
📈 GBPCHF has been overall bullish, trading within the rising channel in red.
Currently, GBPCHF is hovering around the upper bound of the channel.
Moreover, it is retesting a supply zone marked in red.
🏹 Thus, the highlighted red circle is a strong area to look for sell setups as it is the intersection of the supply zone and upper red trendline acting as a non-horizontal resistance.
📚 As per my trading style:
As #GBPCHF approaches the red circle zone, I will be looking for bearish reversal setups (like a double top pattern, trendline break , and so on...)
📚 Always follow your trading plan regarding entry, risk management, and trade management.
Good luck!
All Strategies Are Good; If Managed Properly!
~Rich

EUR/GBP Loitering South of Resistance Ahead of Eurozone CPI DataAhead of today’s eurozone CPI inflation report (9 am GMT), the EUR/GBP cross is approaching an interesting resistance level of £0.8500.
What makes this level a worthwhile watch is that the base is complemented by several additional resistances.
These resistances include the potential ascending resistance line, drawn from the low of £0.8493, which, as you can see, is nestled just north of the noted horizontal resistance level. You will also note that we have a resistance area at £0.8533-£0.8500, as well as an AB=CD resistance at £0.8513 (depicted by a 100% projection ratio) that’s closely shadowed by a 38.2% Fibonacci retracement ratio and a 50.0% retracement ratio at £0.8521, respectively.
Supporting a reaction from the technical confluence between £0.8533 and £0.8500 is the trend. The overall bias has been to the downside since late 2023, with defined lower lows and lower highs being seen since April this year.

BANK NIFTY SUPPLY & DEMAND ZONENSE:BANKNIFTY
Supply & Demand Zones have been highlighted on daily timeframe for understanding trade setups.
Change of character in index has been observed after 41300, when it has not marked any LL.
After continuing its strong upward move; previous supply zones start around 43000, 43500 and ultimately around 44000 (latest high of 14-Dec-2022).
While price moving up, RSI will also play its part by creating divergence in overbought zone. This may lead to trap retail investors & smart money getting max profit out of it.
Since 14-Dec-2022, NSE:BANKNIFTY has not made any HH, rather moved in downward direction even after tried to consolidate & tried to break resistance of 42000 but could not sustain.
