NQ Power Range Report with FIB Ext - 6/24/2025 SessionCME_MINI:NQU2025
- PR High: 22217.00
- PR Low: 22065.75
- NZ Spread: 337.75
Key scheduled economic events:
10:00 | CB Consumer Confidence
- Fed Chair Powell Testifies
Session Open Stats (As of 12:35 AM 6/24)
- Session Open ATR: 384.68
- Volume: 45K
- Open Int: 240K
- Trend Grade: Neutral
- From BA ATH: -2.8% (Rounded)
Key Levels (Rounded - Think of these as ranges)
- Long: 22096
- Mid: 20383
- Short: 19246
Keep in mind this is not speculation or a prediction. Only a report of the Power Range with Fib extensions for target hunting. Do your DD! You determine your risk tolerance. You are fully capable of making your own decisions.
BA: Back Adjusted
BuZ/BeZ: Bull Zone / Bear Zone
NZ: Neutral Zone
Supply Zone

NQ Power Range Report with FIB Ext - 6/23/2025 SessionCME_MINI:NQU2025
- PR High: 21787.00
- PR Low: 21566.75
- NZ Spread: 491.75
Key scheduled economic events:
09:45 | S&P Global Manufacturing PMI
- S&P Global Services PMI
10:00 | Existing Home Sales
Open weekend gap down ~0.33%
Session Open Stats (As of 12:45 AM 6/23)
- Session Open ATR: 382.81
- Volume: 38K
- Open Int: 234K
- Trend Grade: Neutral
- From BA ATH: -4.8% (Rounded)
Key Levels (Rounded - Think of these as ranges)
- Long: 22096
- Mid: 20383
- Short: 19246
Keep in mind this is not speculation or a prediction. Only a report of the Power Range with Fib extensions for target hunting. Do your DD! You determine your risk tolerance. You are fully capable of making your own decisions.
BA: Back Adjusted
BuZ/BeZ: Bull Zone / Bear Zone
NZ: Neutral Zone

Argentina Money Supply Reduced Along With InflationWe once again see that MMT ("Modern" Monetary Theory) is 100% wrong. Milton Friedman wins again.
"Inflation is always and everywhere a monetary phenomenon."
Don't let modern economic hacks fool you.

EURUSD M15 Forecast - Check related IdeaAs explained in previous post we are expecting a pull back down to our order block (H4) then a bullish reversal to retest last weeks highs (1.16) region. If price breaks and closes above the M15 supply zone will have to re-evaluate and potentially take a long position from a retest into a FVG.

HYPE/USDT Technical Analysis (4H Chart)🔍 HYPE/USDT Technical Analysis (4H Chart)
High Time Frame (Daily): Bullish
Despite recent pullbacks, the overall trend remains bullish on the daily timeframe. However, current price action suggests a potential fakeout or legitimate breakdown, as we test key structural and volume-based supports.
Short-Term Time Frame (4H): Bearish
The 4-hour chart displays clear bearish pressure, confirmed by the Three Black Crows candlestick pattern. This signals sustained selling interest and supports the current downward move.
🧱 Key Zones
Supply Zone: $41.7 – $45.9
Strong resistance marked by prior selling pressure and overlapping FVGs.
Demand Zone: $24.4 – $26.3
Historical area of buying support, aligned with a low-volume node and an unfilled FVG.
📏 Fair Value Gaps (FVGs)
Above Price:
Four 4H FVGs act as upside inefficiencies, offering targets in a bullish recovery:
~$34.9
~$36.6
~$37.8
~$40.0 (psychological level & POC cluster)
Below Price:
One major 4H FVG remains unfilled, directly above the demand zone.
📐 Fibonacci Analysis
Price is testing the Golden Pocket (0.618–0.65) from the recent swing low to high.
A clean break below this area (with confirmation) targets the unfilled FVG around $30, and potentially the demand zone ($24.4–$26.3).
📉 Volume Profile Insight
Volume is clustered around $34–$37, indicating strong past market participation.
Very low volume between $29–$30, creating a volume void — if price loses support at the FVG and golden pocket, it could rapidly drop into the demand zone.
🔻 OBV Analysis (Volume Momentum)
OBV has broken below a larger rising wedge, confirming bearish divergence.
A falling wedge is now forming within OBV.
Break below this wedge: Confirms further price breakdown.
Reclaim of the larger wedge trendline: Suggests potential bullish reversal.
✅ Trade Scenarios
🔺 Bullish Scenario
Trigger: Bullish reversal pattern at the golden pocket (e.g., double bottom, falling wedge, inverse H&S) + OBV recovery.
Entry: Upon confirmation around $32.5.
Targets:
$34.9 (FVG)
$36.6 (FVG)
$37.8 (FVG)
$40.0 (psychological)
Stop: Below $30 or recent swing low (tight below FVG).
🔻 Bearish Scenario
Trigger : Confirmed breakdown of golden pocket & 4H FVG with OBV falling wedge breakdown.
Entry : Below $32.5 with confirmation (e.g., retest or strong momentum candle).
Targets:
$30.0 (psychological level)
$28.5 (FVG zone)
$26.3 → $24.4 (Demand zone)
Stop : Above golden pocket resistance (~$33.8–$34.2).
📝 Conclusion: The market is at a pivotal point. A confirmed break below $32.5 could accelerate selling due to the volume gap, while a strong bullish reaction from the golden pocket could drive a recovery toward $40. Always wait for confirmation before entering either scenario.

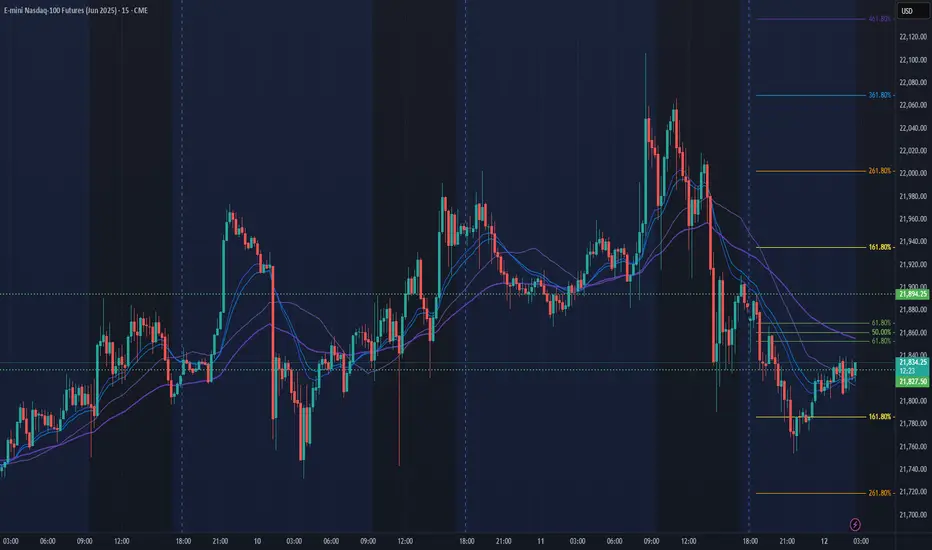
NQ Power Range Report with FIB Ext - 6/20/2025 SessionCME_MINI:NQU2025
- PR High: 21930.25
- PR Low: 21745.75
- NZ Spread: 412.0
Key scheduled economic events:
08:30 | Philadelphia Fed Manufacturing Index
Session Open Stats (As of 1:05 AM 6/20)
- Session Open ATR: 377.21
- Volume: 155K
- Open Int: 230K
- Trend Grade: Neutral
- From BA ATH: -4.2% (Rounded)
Key Levels (Rounded - Think of these as ranges)
- Long: 22096
- Mid: 20383
- Short: 19246
Keep in mind this is not speculation or a prediction. Only a report of the Power Range with Fib extensions for target hunting. Do your DD! You determine your risk tolerance. You are fully capable of making your own decisions.
BA: Back Adjusted
BuZ/BeZ: Bull Zone / Bear Zone
NZ: Neutral Zone

NQ Power Range Report with FIB Ext - 6/18/2025 SessionCME_MINI:NQU2025
- PR High: 21940.50
- PR Low: 21863.00
- NZ Spread: 173.50
Key scheduled economic events:
08:30 | Initial Jobless Claims
10:30 | Crude Oil Inventories
14:00 | FOMC Economic Projections
- FOMC Statement
- Fed Interest Rate Decision
14:30 | FOMC Press Conference
AMP margins increase to 25% for expected FOMC volatility spike
Session Open Stats (As of 12:45 AM 6/18)
- Session Open ATR: 375.35
- Volume: 31K
- Open Int: 213K
- Trend Grade: Neutral
- From BA ATH: -3.8% (Rounded)
Key Levels (Rounded - Think of these as ranges)
- Long: 22096
- Mid: 20383
- Short: 19246
Keep in mind this is not speculation or a prediction. Only a report of the Power Range with Fib extensions for target hunting. Do your DD! You determine your risk tolerance. You are fully capable of making your own decisions.
BA: Back Adjusted
BuZ/BeZ: Bull Zone / Bear Zone
NZ: Neutral Zone

EUR/USD – 30m | Smart Money long SetupPair: EUR/USD
🔹 Timeframe: 30-Minutes
🔹 Confluence Strategy: Elliott Wave + Smart Money Concepts (SMC)
🔹 Pattern: Ending Triangle (Wave e) + CHoCH + BOS
🔹 Published on: June 17, 2025
---
🧠 Analysis Summary:
1. Wave (e) of triangle nearly complete — signs of liquidity grab at the low.
2. CHoCH formed after internal structure break – a bullish signal.
3. Demand zone successfully mitigated, showing buyer reaction.
4. BOS confirms intent to shift bullish structure.
5. Clear imbalance/fair value gap filled before move.
---
🎯 Next Move Projection:
Entry Zone: 1.1562–1.1565 (Demand Area)
Target: 1.1596–1.1600 (Supply Zone Resistance)
Invalidation: Clean break below 1.1555 low (demand fails)
---
📌 Trade Bias:
✔️ Bullish — Expecting price to tap into supply zone and potentially reverse.
⚠️ Monitor lower timeframes (5m–15m) for rejection signs near 1.1600.

NQ Power Range Report with FIB Ext - 6/17/2025 SessionCME_MINI:NQU2025
- PR High: 22177.25
- PR Low: 22065.25
- NZ Spread: 250.25
Key scheduled economic events:
08:30 | Retail Sales (Core|MoM)
Contract rollover week
Session Open Stats (As of 12:45 AM 6/17)
- Session Open ATR: 385.81
- Volume: 47K
- Open Int: 178K
- Trend Grade: Neutral
- From BA ATH: -3.5% (Rounded)
Key Levels (Rounded - Think of these as ranges)
- Long: 22096
- Mid: 20383
- Short: 19246
Keep in mind this is not speculation or a prediction. Only a report of the Power Range with Fib extensions for target hunting. Do your DD! You determine your risk tolerance. You are fully capable of making your own decisions.
BA: Back Adjusted
BuZ/BeZ: Bull Zone / Bear Zone
NZ: Neutral Zone

Short Idea on DXYBased on :
- Investors surprised by the cpi new and seeking safety in bonds (ZB1!) making dollar go down
- break out of an important support level
- 2 supply zones

NQ Power Range Report with FIB Ext - 6/16/2025 SessionCME_MINI:NQU2025
- PR High: 21903.75
- PR Low: 21726.00
- NZ Spread: 396.75
No key scheduled economic events
Contract rollover week
Session Open Stats (As of 12:15 AM 6/16)
- Session Open ATR: 382.14
- Volume: 18K
- Open Int: 62K
- Trend Grade: Neutral
- From BA ATH: -4.1% (Rounded)
Key Levels (Rounded - Think of these as ranges)
- Long: 22096
- Mid: 20383
- Short: 19246
Keep in mind this is not speculation or a prediction. Only a report of the Power Range with Fib extensions for target hunting. Do your DD! You determine your risk tolerance. You are fully capable of making your own decisions.
BA: Back Adjusted
BuZ/BeZ: Bull Zone / Bear Zone
NZ: Neutral Zone

NQ Power Range Report with FIB Ext - 6/13/2025 SessionCME_MINI:NQM2025
- PR High: 21915.75
- PR Low: 21861.75
- NZ Spread: 120.5
No key scheduled economic events
Session Open Stats (As of 12:45 AM 6/13)
- Session Open ATR: 389.53
- Volume: 66K
- Open Int: 267K
- Trend Grade: Neutral
- From BA ATH: -4.9% (Rounded)
Key Levels (Rounded - Think of these as ranges)
- Long: 22096
- Mid: 20383
- Short: 19246
Keep in mind this is not speculation or a prediction. Only a report of the Power Range with Fib extensions for target hunting. Do your DD! You determine your risk tolerance. You are fully capable of making your own decisions.
BA: Back Adjusted
BuZ/BeZ: Bull Zone / Bear Zone
NZ: Neutral Zone

NQ Power Range Report with FIB Ext - 6/12/2025 SessionCME_MINI:NQM2025
- PR High: 21894.25
- PR Low: 21827.25
- NZ Spread: 150.0
Key scheduled economic events:
08:30 | Initial Jobless Claims
- PPI
13:00 | 30-Year Bond Auction
Session Open Stats (As of 12:25 AM 6/12)
- Session Open ATR: 376.45
- Volume: 24K
- Open Int: 268K
- Trend Grade: Neutral
- From BA ATH: -3.6% (Rounded)
Key Levels (Rounded - Think of these as ranges)
- Long: 22096
- Mid: 20383
- Short: 19246
Keep in mind this is not speculation or a prediction. Only a report of the Power Range with Fib extensions for target hunting. Do your DD! You determine your risk tolerance. You are fully capable of making your own decisions.
BA: Back Adjusted
BuZ/BeZ: Bull Zone / Bear Zone
NZ: Neutral Zone
NQ Power Range Report with FIB Ext - 6/11/2025 SessionCME_MINI:NQM2025
- PR High: 21983.75
- PR Low: 21937.00
- NZ Spread: 104.75
Key scheduled economic events:
08:30 | CPI (Core|YoY|MoM)
10:30 | Crude Oil Inventories
13:00 | 10-Year Note Auction
Session Open Stats (As of 12:25 AM 6/11)
- Session Open ATR: 380.78
- Volume: 24K
- Open Int: 272K
- Trend Grade: Neutral
- From BA ATH: -3.4% (Rounded)
Key Levels (Rounded - Think of these as ranges)
- Long: 22096
- Mid: 20383
- Short: 19246
Keep in mind this is not speculation or a prediction. Only a report of the Power Range with Fib extensions for target hunting. Do your DD! You determine your risk tolerance. You are fully capable of making your own decisions.
BA: Back Adjusted
BuZ/BeZ: Bull Zone / Bear Zone
NZ: Neutral Zone

NQ Power Range Report with FIB Ext - 6/10/2025 SessionCME_MINI:NQM2025
- PR High: 21847.75
- PR Low: 21823.25
- NZ Spread: 55.0
No key scheduled economic events
Session Open Stats (As of 12:25 AM 6/10)
- Session Open ATR: 393.42
- Volume: 27K
- Open Int: 269K
- Trend Grade: Neutral
- From BA ATH: -3.2% (Rounded)
Key Levels (Rounded - Think of these as ranges)
- Long: 22096
- Mid: 20383
- Short: 19246
Keep in mind this is not speculation or a prediction. Only a report of the Power Range with Fib extensions for target hunting. Do your DD! You determine your risk tolerance. You are fully capable of making your own decisions.
BA: Back Adjusted
BuZ/BeZ: Bull Zone / Bear Zone
NZ: Neutral Zone


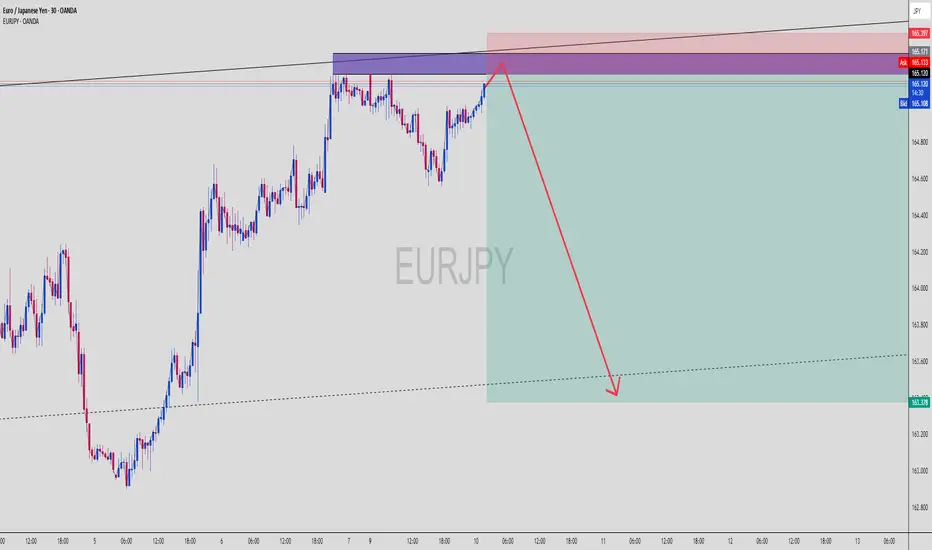
EURJPY Supply Tap! Bearish Reaction Coming?EURJPY (30-Min) | Supply Zone Hit + Bearish Reversal Setup
This EURJPY move is brewing into a classic SMC bearish play — engineered liquidity run, supply zone reaction, and a projected melt to imbalance below. Let’s dissect the ninja logic 🧠📉
🔍 Breakdown of the Setup:
🟥 Supply / Order Block Zone
Price enters a strong bearish OB zone between 165.100–165.397
Previous rejection wicks in this zone = smart money sell interest
Price now testing that area again — potential for liquidity sweep + reversal
🟪 Multi-Zone Confluence
Multiple overlapping zones stacked: OB, mitigation block, and liquidity sweep area
Perfect spot for Smart Money to unload positions before sending price lower
📏 Risk-Reward Optimization
Entry near 165.100–165.397 zone
Stop Loss placed slightly above the last rejection wick (above 165.397)
Take Profit projected around 163.378 based on measured impulse leg and imbalance fill
🧠 Liquidity Narrative
The rally into supply is likely a buy-side liquidity hunt
Smart Money often drives price into key zones before triggering reversals
Price may wick above 165.171 to fake bulls before a strong sell-off
🧠 Chart Ninja Entry Plan:
🔻 Entry Zone 165.100 – 165.397 (Supply OB)
🛡 SL Above 165.450 (above wick / last structure high)
🎯 TP Target 163.378 (imbalanced fill target)
⚖️ RRR Approx. 1:4+ depending on entry precision
🥷 Chart Ninja Note:
“The trap is always set where the crowd feels the safest —
and that’s exactly where the ninja strikes.” 🥷📉
This setup could be a clean ride down if price reacts as expected. Confirmation entry = bearish engulfing on M15 or M30.
🔁 Bonus Observation:
You can see lower timeframes building internal liquidity, meaning we might get a sharp, volatile drop once that top wick finishes sweeping.
📍Mark this zone and set an alert — entry can trigger fast!
🔥 What’s your confirmation style — engulfing candle or breaker structure?

EURUSD Interim Short Active, Looking for the LongInterim short active from our analysis posted last night, rejected off the lower end of the supply zone highlighted. Looking for the trade to trade down to a good Demand level to then take this trade up to the higher levels of the supply zone. Targeting the 1.1500 region. This will be all dependent on price action. If price moves to plan and 1.1500 is achieved we then can look for the original short position highlighted in last nights analysis.

NQ Power Range Report with FIB Ext - 6/9/2025 SessionCME_MINI:NQM2025
- PR High: 21820.75
- PR Low: 21730.25
- NZ Spread: 202.25
No key scheduled economic events
Session Open Stats (As of 12:15 AM 6/9)
- Session Open ATR: 406.53
- Volume: 25K
- Open Int: 272K
- Trend Grade: Neutral
- From BA ATH: -4.0% (Rounded)
Key Levels (Rounded - Think of these as ranges)
- Long: 22096
- Mid: 20383
- Short: 19246
Keep in mind this is not speculation or a prediction. Only a report of the Power Range with Fib extensions for target hunting. Do your DD! You determine your risk tolerance. You are fully capable of making your own decisions.
BA: Back Adjusted
BuZ/BeZ: Bull Zone / Bear Zone
NZ: Neutral Zone

EURUSD Potential Long then ShortEUR/USD looking to trade around a key supply zone between 1.1450–1.1500. We’re watching for signs of bearish rejection to build a short bias from this area. No trade unless price confirms.
Main Setup:
If price retests upper zone (~1.1450–1.1500) and shows clear bearish price action, I’ll be looking to enter short.
Ideal signs: rejection wicks, SFPs, bearish engulfing, lower timeframe structure shift.
Break & Retest Option:
If price breaks below 1.1390, a clean bearish retest could offer a continuation short setup.
Structure break confirmation is key here.
This is a forecast, and trades will be dependent on live PA.
If we don’t get confirmation, we don’t force it. Patience is key.
DXY Outlook:
The Dollar Index looks bearish overall but is currently in a small corrective bounce. A short-term DXY pullback would support a push into EUR/USD’s supply zone — lining up nicely with our plan. If DXY flips back to bullish, that strengthens our short setup.

GBPUSD - Very InterestingWith NFP creating massive volatility on Friday this pair is a bit messy.
We have however created an internal structure shift on the 15min timeframe to the downside lower the HTF order flow still being bullish
This could be a case of get what we can to the downside until we hit the HTF demand and look to get long.
As you can see I am already trying to forecast ahead of what could potentially happen with this pair as when it gets to certain levels and there are reactions it will come as no surprise.
If I can be of assistance to anybody please don't hesitate to message.

