AUDCHF - RESISTANCE BECOMES SUPPORT📈Hello Traders👋🏻
On The Daily Time Frame The AUDCHF Price Broke The Resistance Level (0.60648-0.60276)✔
Currently, The Resistance Level Becomes New Support Level📈
So, I Expect a Bullish Move📈
i'm waiting for a retest....
-----------
TARGET: 0.61855🎯
___________
if you agreed with this IDEA, please leave a LIKE, SUBSCRIBE or COMMENT!
Supply Zone

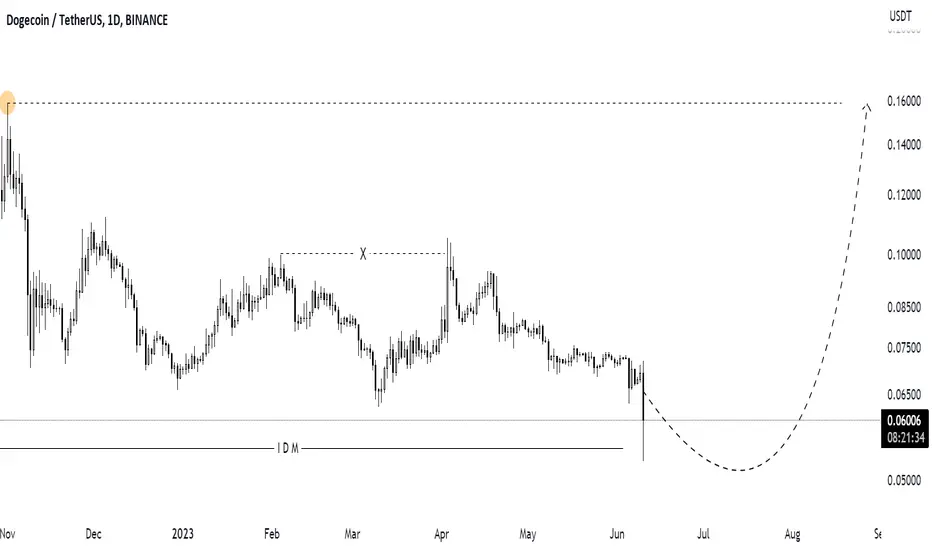
Buy opportunity on DOGEUSDTas you can see Doge grabed IDM liquidity and if this candle closes above the IDM , then we can buy until 0.157 on structure high.
This is not a financial advice and its just my analysis based TrueSMC
XAUUSD SHORT BEFORE FED RATESOn gold, we have a price that, after reaching the 1965 zone within a supply zone, reversed its course due to the significant volume present in the area. Now, the price has started to decline, and a target is expected around the 1946 zone, where there is a high concentration of orders and a demand zone at the 1943 level. Therefore, currently, we have a profitable short trade.
Share your perspective.
Wishing everyone successful trading, Nicola, CEO of Forex48 Trading Academy.

Long position 📉📈 high probability tradeHello to all trades.
In this chart we saw a good pressure from the bulls and I think the can have nice rally.
Please feel free to leave comment for me 🙏🙏🙏.
Cheers 🥂.

USDCHF - BEARISH MOVE📉Hey Traders👋🏻
The USDCHF Price Reached A Support Level (0.90568-0.90350) !
Currently, The Price Broke This Key Level (Support Level Becomes New Resistance Level)
Moreover, The Price Broke The Support Line 📈
So, I Expect a Bearish Move📉
i'm waiting for a retest...
-----------
TARGET: 0.89806🎯
___________
if you agreed with this IDEA, please leave a LIKE, SUBSCRIBE or COMMENT!

EURGBP I Headed to retest demand zone and will possibly break itWelcome back! Let me know your thoughts in the comments!
** EURGBP Analysis - Listen to video!
We recommend that you keep this pair on your watchlist and enter when the entry criteria of your strategy is met.
Please support this idea with a LIKE and COMMENT if you find it useful and Click "Follow" on our profile if you'd like these trade ideas delivered straight to your email in the future.
Thanks for your continued support!

clear 130.000 price areas for flight 'ninja' landingprice is in a bearish parallel channel and is failling to trade above 140.000 price areas.
i have short targets to daily demand of proximal price @ 137.300
put together by : @currencynerd , pako phutietsile
supply and demand!

EURUAD SHORT SIGNALOn EURAUD, the price has bounced three times on a downward trendline, effectively validating it, and it is now approaching the 1.5950 area where we have a demand zone.
Let me know your expectation.
Happy trading to all. Nicola, CEO of Forex48 Trading Academy.

EUR/USD Short - NY Open June 7thSetup to go short on EURUSD on NY Open, sweep of the asian range liquidity, retesting the HTF supply and rejecting with a bearish engulfing candle. Targeting the nice imbalance below for a 3.5 risk-reward ratio. FX retail sentiment is all long. Good luck traders!

EURUSD SHORT SETUP BEFORE FED NEWSOn EURUSD, a bearish trend can be observed, with the price retracing to the 50% Fibonacci level and then bouncing three times on a downtrend line, indicating clear short signals. Currently, the price is situated between a supply and a demand zone at the 1.0675 level, with volumes favoring sellers. Therefore, the objective is a short trade with a target of 1.055. It is worth noting that the short position will be confirmed by an initial break below the 1.0635 level.
What is your perspective?
Happy trading to everyone.
Nicola, CEO of forex48 trading academy.

BRENT OIL IS READY FOR A SHORT TRADEOil is showing a bearish trend with a price that has bounced three times on a downtrend line. Currently, it is in a demand zone, which is a small market support. The outlook shows a bearish triangle pattern, with the price potentially breaking downwards before bouncing back up prior to a short position with a target of 72.56.
What is your opinion?
Happy trading to everyone.
Nicola CEO
Forex48 Trading Academy

Grabbing the best possible trade on NQ1!Obviously, going short at every supply zone or going long at every demand zone doesn't work every time. If it did trading would be too easy and no one would lose. So, how do we trap the losers and become the winners? Wait for a liquidity sweep above, most often indicated by a bearish shooting start candlestick with a close back below the supply zone. Previous shorts will be stopped out and new longs will be trapped. That's the best possible time to enter short and ride the reversal back down here on CME_MINI:NQ1!

SPX500 SHORT SETUP H1 BEFORE FED RATESThe price is currently in a bearish moment at the level of 4270, with a potential bounce zone around 4284, which corresponds to the 50% Fibonacci retracement level and a high-volume trading area. The objective of the short trade is to target 4220, where we have the 61% Fibonacci retracement level with high volumes and a demand zone for support before potentially dropping further to touch 4187. A descent is expected in anticipation of the Fed's interest rate hike next week.
Let me know what you think.
Happy trading to everyone.

XAUUSD IS READY FOR US RATESOn gold, we have a bullish setup following today's negative news on the US manufacturing sector. The price could pull back to around 1940 before returning to the 1980 area.
Let me know your thoughts.
Happy trading to everyone.

Mara: Price will retrace to $8.89Breaking below $9.58 will initiate a change of structure ( choch ) at which point, puts may be permissible. My target price in this situation would be $8.90. If you view this stock on a larger time frame, we've been ranging for quite some time.
Now, on the off chance that we break and hold above that $10.39 supply, it may be a good idea to go long.
NFA.

AUDJPY BEARISH SETUP AFTER NEWSOn AUDJPY, I anticipate an upward movement towards the 92.80 area tomorrow morning after the interest rate decision in Australia, which would create a bearish setup to reclaim all the liquidity left in the market due to the news. Therefore, the trade objective is to enter a short position around 92.85 with a target set at 90.70.
Let me know your thoughts.
Happy trading to everyone.

$EURUSD PULLBACKFX:EURUSD is in a pullback after a 4H TC, entering a 4H demand zone with no reaction yet, waiting for big banks to lunch their trades maybe after the ISM .
Keep in mind that the daily is bearish .

EURUSD | Supply and Demand | 1 JUN 23EU had a H4 Swing CHoCH, Daily Swing Pullback may have finished, Longs can become higher probability during this weeks

GBPUSD LongsGU shows very promising signs of long opportunity before falling apart from the supply zone.

Extreme Demand for EUPrice is at the extreme discount of the range and we could see it start to go up. There was a sweep of liquidity which led to a BOS which is why I think this is a high probability zone. Going to wait for a choch on the daily then will look for entries on lower time frames targeting the daily high

GBPAUD I Approaching supply zone where it may fallWelcome back! Let me know your thoughts in the comments!
** GBPAUD Analysis - Listen to video!
We recommend that you keep this pair on your watchlist and enter when the entry criteria of your strategy is met.
Please support this idea with a LIKE and COMMENT if you find it useful and Click "Follow" on our profile if you'd like these trade ideas delivered straight to your email in the future.
Thanks for your continued support!

dollar index lift-off to nov 22 price areasdemand level of proximal price @ 101.500 is in control of price , targets levels at nov 22 price areas at supply level of proximal price @ 112.000
supply and demand in combination with price action!
put together by : pako phutietsile, @currencynerd

GBPAUD shortGBPAUD hits a weekly area of demand and then created a change of character to the downside, there is Valid evidence to show willingness of price to selloff , in my opinion a safe target is the equal lows at 1.8450
Entry at the open of the refined zone at 1.89350
Entry 1.89350
Sl 1.89750
Tp. 1.86450
Good hunting 🤗🤗❣️
