EURUSD - New Breakout !The EURUSD Price Reached A Key Level !
Currently, The Key Level is Broken (The Resistance Becomes Support)
So, I Expect a Bullish Move to 1.07300
...
if you agreed with this IDEA, please leave a LIKE, SUBSCRIBE or COMMENT!
Supply Zone

GBPUSD: Demand DestroyedAfter price pierced the demand and liquidated buyers, the only liquidate that remains is from the sellers.
I believe that liquidity is near the equal highs marked.
We will either flow to those highs from here or we will get one last sell lure before traveling to the upside.

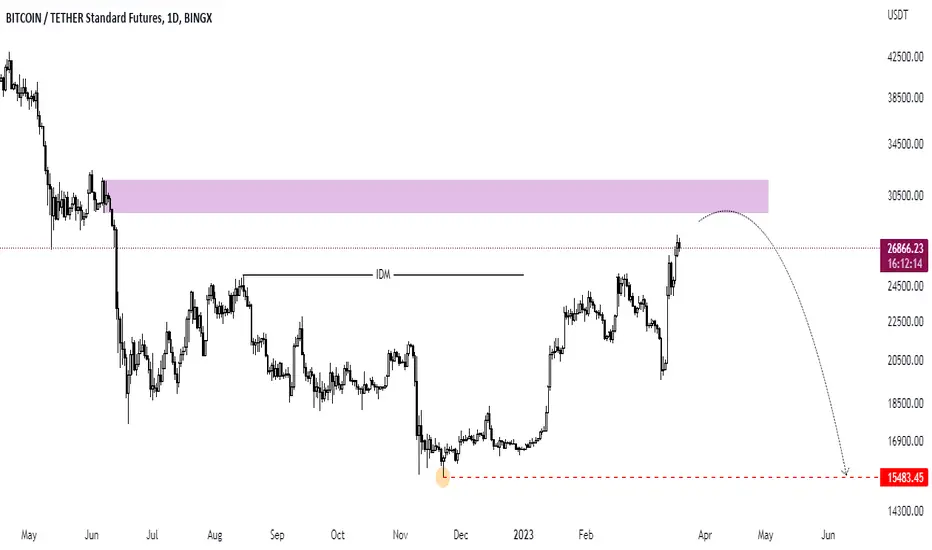
Bitcoin AnalysisThis is my oponion on BTC 1D chart.
going up to 29500 and then going down to 15500
What you think?
XAUUSD Bearish IdeaConfluences = Fib + Supply zone
Price is approaching a 4hr supply zone after breaking another zone.

bcousdprice in supply zone and i think this is good for be short
i think this is good opportunity because more than 3 risk to reward ratio
hope enjoy trading
dont forget like if you agree and comment below your opinion

Commodity Outlook: Cyclical pressures vs structural strengthsCommodities have been enjoying a strong revival in recent years, with broad commodities returning 27% in 2021 and 15% in 2022. A combination of fiscal and monetary support in the early phases of the COVID-19 pandemic helped to soften the damage to demand from one of the deepest economic shocks in modern times. As COVID-19 restrictions lifted, commodity demand bounced back strongly.
In 2022, the Ukrainian invasion presented a supply shock, restricting energy and agricultural product supplies and further supporting commodity prices. Whilst many developed world central banks tightened monetary policy in the first half of 2022, inflationary pressures became the most extreme since 1981.
Commodities proved again to be one of the best asset classes to hedge this extreme inflation. After arguably falling behind the curve, developed world central banks sought to get ahead and became the most hawkish since the early 1980s. Commodities emerged as a refuge in the storm.
Cyclical headwinds have emerged
Commodities, often seen as a late-cycle asset performer, struggled in late-2022. Energy prices, which had been propelling the asset class, declined by Q3 2022, joining metals, which had been weak since Q1 2022. Economic deceleration resulting from monetary tightening in developed nations weighed on the asset class. Composite lead indicators (CLIs)—designed to provide early signals of turning points in business cycles—turned decisively even before 2022 started. Commodity performance peaked later in 2022. CLIs are still declining, indicating the cyclical headwinds faced by commodities are still present.
China reopening to counter economic headwinds elsewhere
The global economic rebound experienced in 2021 and 2022, and the accompanying commodity rally, occurred largely without China’s contribution. Chinese policy makers pursuing a zero-COVID policy up until November 2022 hamstrung their economy, and growth was disappointing. Although Chinese exports remained relatively strong due to international demand for Chinese goods, constant supply disruptions restrained export volumes during the zero-COVID period.
Now that China has abandoned its zero-COVID policies, domestic economic activity is picking up strongly. In fact, the January and February prints of Purchasing Manager Indices (PMIs) in 2023 look encouraging. Both manufacturing and non-manufacturing PMIs rose clearly above 50 (the demarcation between growth and contraction). The February figure (released on 01/03/2023) showed manufacturing PMIs hitting levels not seen since 2012, underscoring that the domestically driven recovery is reaching industry as well as services (manufacturing is more commodity-intense than services, so that is arguably the most important of two indicators).
What about the commodity supercycle?
We believe commodities should see long-term structural support from an energy transition and an infrastructure spending rebound. Furthermore, these catalysts could drive another supercycle in commodities. Supercycles coincide with periods of industrialisation and urbanisation when the supply of commodities failed to keep up with the growth in demand. The last supercycle occurred after China joined the World Trade Organization in 2001, which turbocharged development as barriers to commerce were removed. After two strong years of commodity market performance (2021 and 2022), could we be on the cusp of another supercycle? We believe there are some strong structural underpinnings but, for now, business cycle dynamics (including a rising risk of recession) could dominate price behaviour in the short term.
Energy transition
In a scenario where net zero emissions are targeted by 2050 in order to limit temperature increases to 1.5 degrees Celsius above pre-industrial levels, we should see a significant rise in demand for metals. Metals are critical for the manufacture of batteries, electrification of power energy consumption, electrolysers, heat pumps, and other technologies needed for the energy transition. International Energy Agency data indicates that, in a net zero emissions scenario, supplies of critical materials are going to be woefully short of demand, both in terms of mining and material production.
Infrastructure rebound
In the US, three Acts with partially overlapping priorities - the Bipartisan Infrastructure Bill (2021), the CHIPS and Science Act (August 2022), and the Inflation Reduction Act of 2022 (IRA, August 2022) – have a combined budget of close to US$2 trillion in federal spending and the infrastructure intensive projects are only just starting.
Just looking at the energy funding from the Bipartisan Infrastructure Bill and the Inflation Reduction Act, a total of US$370 billion is earmarked to be spent over the next 5 to 10 years, primarily to facilitate the clean energy transition. The IRA encourages the procurement of critical supplies domestically. In order to meet the supply chain requirements, we expect large infrastructure spending on mineral extraction, processing and manufacturing.
The European Union’s REPowerEU plan—designed to wean the economic bloc off Russian hydrocarbon dependency—will also require a large spend on energy infrastructure. The EU is already building liquified natural gas capacity at breakneck speed, aiming to expand capacity by one-third by 2024.1 The EU estimates that delivering the REPowerEU objectives will require an additional investment of €210 billion between 2022 and 2027.
The green industrial ‘arms race’ takes off
After decades of underspending for the climate policy goals governments have signed up to, we may be witnessing a tipping point. Some of the protective features of IRA (regional sourcing requirements) may propel tit-for-tat policies that drive local sourcing elsewhere. Many nations recognising China’s dominance in critical materials had already been designing policies to mitigate the risk of overreliance on the country. This process is likely to drive an upsurge in ex-China green infrastructure spending globally.
Conclusions
After several years of commodity market outperformance, the asset class is already experiencing cyclical headwinds. However, a China reopening is likely to mitigate some of these pressures, and we are seeing tentative evidence of China’s economy rebounding. Commodities are likely to be underpinned by global policy support for an energy transition. Whilst general infrastructure spending may also face cyclical headwinds this year, green infrastructure spending is likely to lead to a new ‘arms race’ as countries compete to support their industries and maintain energy/resource security.

GBPJPY ShortHello traders ,what do you think about GBPJPY ? This pair has reached an important support line. We expect it to down to the specified zone with a little fluctuation in this area
If this post was useful to you, do not forget to like and comment.

40R EURUSD Long Swing Trade (Smart Money Concepts)Testing one of my smart money concepts swing trading strategies using an early entry based on day trading setup. The setup normally involves a sweep of a 4h choch/MSS deep in premium/discount, then a daily pin bar or hammer, or a 4h choch.
Previous Day Opening Gap has been filled on DXY as well as three months of liquidity swept.
This early entry utilizes a long from a trendline following another strategy of mine. If successful, will take the majority of the position off after daily FVG fills and leave some on to run as a swing trade.

eurjpy shortWe are in a supply zone, and price seems to be respecting our supply zone, as well as our trendline we will look for shorts

XAUUSD SellHope you guys are well
I have an idea about selling Gold. I think we have a Return to Supply pattern here and I think we can get a short position to 1870$.
I'll be happy to share your ideas with me too

Short of ABX Barrick Gold #ABXA clear setup; with the long-term chart (M) month. in downtrend. The Current-chart (W) Week is also in downtrend. the (W) is in clear move up, lots of buying to support this momentary fake uptrend. How do I know it is fake. Well one never knows anything as a disclaimer for any trading position; we stack up odd Enhancers in our favour.
So, why did I take the SHRT at $26 while price was rallying (fake rally); the red line on the right hand (W) chart. the price met a Supply Zone, and this SZ happens to be Lower High of the (W) downtrend. a technical downtrend is marked by a series of Lower Lows and Lower High(LH), as long as the LH are not violated the downtrend continue.
Once a price rally into a Lower High Supply zone, am looking for a tight SHORT entry, with a low-er risk STP loss just above the SZ & plenty of room below for the price to fall into & thats exactly what happened here. remembering the long-term is in my favour. thats a great off enhancer.
I Shorted at 26.xx and price fell into my Profit-Target 1, where I closed 2/3 of the position at $5 profit per share. and I moved my STP loss down; today, with price opening well above my last STP Loss, after a weak end of speculation on fallout of banks, the Gold price goes up and so does ABX, no surprise here

EURCHF - New Breakout !Hello Traders 💖
The EURCHF price breaks the Daily Support level ,the old support becomes new resistance level ✔
so, i predict a bearish move 📈
i'm waiting for a retest...
TARGET: 0.97440🎯
...
if you agreed with this IDEA, please leave a LIKE, SUBSCRIBE or COMMENT!

AUDJPY: Buyers IncomingPhase 1 has now been completed from my previous analysis.
Price pierced the zone I wanted and pushed even lower to manipulate the order block.
Now we have had liquidation from both sellers and buyers, the true move can enter the market.
My gut tells me the true move is a buy but only the market knows.

EURGBPHello guys :))
here we will just wait for the price to retest supply and wait for confirmation in the area of 0.88610.

GBPAUD I Short & long opportunity this week!💰Welcome back! Let me know your thoughts in the comments!
** GBPAUD Analysis - Listen to video!
We recommend that you keep this pair on your watchlist and enter when the entry criteria of your strategy is met.
Please support this idea with a LIKE and COMMENT if you find it useful and Click "Follow" on our profile if you'd like these trade ideas delivered straight to your email in the future.
Thanks for your continued support!

EURAUD I Potential correction downward from supply zoneWelcome back! Let me know your thoughts in the comments!
** EURUAD Analysis - Listen to video!
We recommend that you keep this pair on your watchlist and enter when the entry criteria of your strategy is met.
Please support this idea with a LIKE and COMMENT if you find it useful and Click "Follow" on our profile if you'd like these trade ideas delivered straight to your email in the future.
Thanks for your continued support!

Ethereum Important supply & demand zonesI am a time traveler and I come from the future. This is a story that is told to our children.
Once upon a time, there was a cryptocurrency called Ethereum. People who traded Ethereum watched the price carefully. They noticed that when the price reached $2300, it would go down, and when it reached $800 (if $1200 didn't hold), it would go up. But something strange was happening. Banks were playing games with the money, and the range wasn't behaving normally. People watched and waited for a big change. Finally, the price went down a lot, and people who were watching carefully made some money. They learned that it's important to pay attention to the price and the key levels, even when things are strange.
We are in this range now. As long as $1200-$1350 holds, I believe will get to the $2300-2500 target this year. If that $1200 level fails, I think ETH can drop quickly to $800 which would be a 33% drop. Watch that weekly hidden bearish divergence (in white). It may be a significant sign of weakness if we don't get back into the diamond I've been discussing for a week or so.

USDMXN continuation shorts down to demand on dailywe should by now understand the game of probabilities when it comes to our trading edge. so with that being said lets go over this USDMXN. The peso’s strength reflects a relatively optimistic outlook for the Mexican economy, with 2022 growth surpassing expectations. Having grown 4.8% in 2021, the World Bank expects it to grow by 2.1% in both 2022 and 2023. As Far as the US Dollar Over the last 12 months, its price rose by 5.50 percent. Looking ahead, we forecast Dollar Index to be priced at 106.0575 by the end of this quarter and at 110.8027 in one year, according to Trading Economics global macro models projections and analysts expectations. However with recession fears and DXY being close to a weekly supply/order lock we may see a bearish spike on the dollar soon which will give us the EDGE we need to take this setup.

📊 DBR & Demand Zone📍 What is Drop Base Rally in Trading?
The drop base rally pattern in technical analysis is a chart pattern that appears when the market falls, then enters a period of sideways price action, and finally, shows explosive upward movements. Market makers open buy orders from demand zones to have a long position in trading. This is some kind of study for technical analysis known as DBR. These patterns are the basis of supply/demand logics. In the showcased example, after a steep drop, the sale finally stopped, leaving bulls the option of buying at lower prices. However, purchasing power at that point was insufficient to reverse the market. Instead, the market starts moving sideways because neither buyers nor sellers could defeat the other party. Eventually, the price action entered the demand zone that was formed and recovered back to higher prices.
📍 How to identify Drop Base Rally pattern?
The drop base rally pattern contains three waves. As shown in the figure above.
🔹 Bearish wave: Drop
🔹 Sideways wave: Base.
🔹 Bullish wave (rally).
📍 Demand Zone
A demand zone is a price level where a significant amount of buying interest or demand for an asset is believed to exist. Traders use demand zones as potential areas of support where buying pressure could increase, causing the price to rebound or reverse. As shown in the example above, we entered a long trade once the price action reached that demand zone, with the entry being inside the zone and the stop loss below the zone.
👤 @AlgoBuddy
📅 Daily Ideas about market update, psychology & indicators
❤️ If you appreciate our work, please like, comment and follow ❤️

vpvr and support and resistant very important for btc $BTC Is a bitcoin dump imminent? US government moves $1 billion worth of confiscated bitcoin from Silk Road to Coinbase/

RISING WEDGE EURCADEurcad has created a rising wedge and has a strong rsi divergence.
In h4 price reached a strong supply area and now I think that price could drop to tha take profit level.
Do your own research before investing!
Francesco

biocon longbiocon can be long for short term from 235-229 zone with 224 sl
targets in the 250 range as per mentioned above

