AXSUSDT is testing the key level!AXSUSDT is testing the weekly support at the $9.9 area, which is a crucial level for traders and investors.
The 0.786 Fibonacci retracement level is also in close proximity, which is a key level for traders who use Fibonacci retracements to identify potential areas of support. It is expected that the price will bounce off this level, as it has done in the past, as traders look to enter long positions.
However, in order for this bounce to occur, the price needs to break out from the descending channel and static resistance, which has been acting as a significant barrier to upside movement. Once this breakout occurs, it is likely that we will see a strong move to the upside, potentially towards the $12.5 area.
According to Plancton's rules, a new long position should be opened once the breakout occurs and the price closes above the resistance level. This is because the breakout is a strong indication that the trend has shifted in favor of the bulls, and that further upside movement is likely. As such, traders who follow Plancton's rules may look to enter long positions in anticipation of a strong move higher.
–––––
Follow the Shrimp 🦐
Keep in mind.
🟣 Purple structure -> Monthly structure.
🔴 Red structure -> Weekly structure.
🔵 Blue structure -> Daily structure.
🟡 Yellow structure -> 4h structure.
⚫️ Black structure -> <= 1h structure.
Follow the Shrimp 🦐
Supply Zone

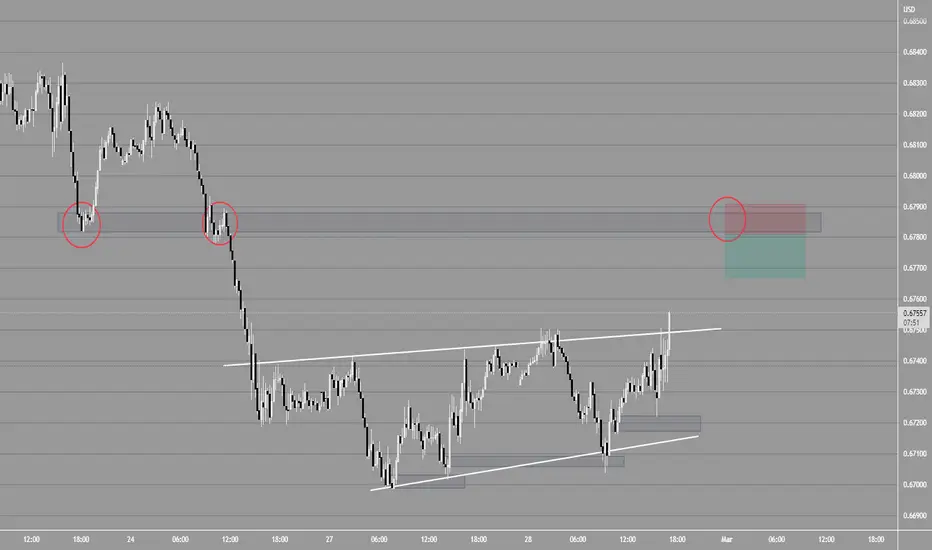
POSITION TRADING: SHORT AUDUSD. TARGET 0.58000TRADE TYPE: INSTANT ENTRY SHORT
TRADE DIRECTION: SHORT
TIMEFRAME: WEEKLY
ENTRY PRICE: 0.66550
STOP LOSS: 0.73400
TAKE PROFIT: 0.58000
RISK TO REWARD: >1:1
ANALYSIS: Price broke the demand zone / support and is likely looking to aim for upcoming demand zone / support. stop loss ideally placed @ 78.6% SWING FIB RETRACEMENT.
Follow this thread for any future updates regarding this specific trade.
CAUTION: Trading outcome is Probability Based and could wipe out your account if risk management and strategy is not followed properly. Cheers

EURAUD I Strong supply zone for a short Welcome back! Let me know your thoughts in the comments!
** EURAUD Analysis - Listen to video!
We recommend that you keep this pair on your watchlist and enter when the entry criteria of your strategy is met.
Please support this idea with a LIKE and COMMENT if you find it useful and Click "Follow" on our profile if you'd like these trade ideas delivered straight to your email in the future.
Thanks for your continued support!

AAPL Aims to Reach $160 Target in Near FuturePrice action in financial markets often gravitates towards key supply zones, which are areas where selling pressure has previously been strong enough to drive prices lower. Traders and investors often use supply zones as important levels to watch for potential price reversals or to enter short positions.
AAPL is no stranger to this, and when looking at the price action mixed with the key indicators on this 4h timeframe, we can see the last few times that the wave master indicator called a buy and sell:
DEC 10 2021: SELL: 179.50 (-6%)
DEC 30 2021: SELL: 178.19 (-14%)
FEB 03 2022: SELL: 173.00 (final warning -14% before -27%)
JUN 14 2022: BUY: 133.25 (+32%)
JAN 05 2023: BUY: 126.50 (+22.4% so far)
We're not geting a solid sell signal yet, but we're darn close. Look at ALL the waves. red, yellow, white are all overbought and the green wave is almost there. That will be the first time we've seen this since Feb 03 2022 but the chart formation looks more like the DEC 30 sell signal.
I'd be very cautious as a drop is likely to occur over the next 1-2 weeks. Probably won't be super deadly like other drops have been but it'll be enough to kill some late bulls for sure.

Fibonacci Retracement on TeslaNASDAQ:TSLA
Fibonacci Retracement on NASDAQ:TSLA implies that it may take support on fib level of 0.236 of 176-177 dollar.
Current price structure shows that it has taken resistance of 0.38 of 222 dollars, therefore, it may go down towards 146 to fill the gap. At this level, its RSI will also be oversold which will trigger bullish rally towards 177.
Tesla takes doesn't retain 196-176 with strength and falls below this price level.


Gap Up or Drop Down?How's it goin traders, hope this recent rally has been treating you guys well. Here we have a potential gap up setup. We have a very aggressive uptrend currently and, we are approaching some supply zones that we will test and see if they prove to be strong resistance. Right now I see more up before we take profit/ have a small pullback. Thoughts traders? Have a good one!

XAUUSDHello traders.
Hope you spent a wonderful weekend!
Gold is currently in very significant area.
If you look higher at Weekly timeframe you will notice that this is close to the previous supply zone, a zone of strength.
On the other hand, forecasts and fundamentals indicate that this specific metal will create new All-Time Highs during 2023.
So,as a traders we want to make money and benefit from the market following the moves with correct entries and exit levels.
Personally, I am expecting a sell from the level of 1880 to 1905.
The point is that we never know the precise reversal areas. All we have is educated guesses.
One position in 1903 (approx.) and another - half size in the area of 1880 for short aiming profit targets:
1850 (80% closed position for safe,)1830-1823-1812
Important to mention is that from the downtrend started at 2067 and terminated at 1616, we are between 0.5 & 0.618 Fibonacci levels.
These levels will mean nothing in case something big is going to be released.
Long term speaking, I am waiting to enter gold again in the range between 1803 and 1812 with a targets 1880-1900-1955-1980.
Perhaps the market will not retrace to such levels so I am waiting to see rejections of 1820 area.

WTI-Oil 5TH MARIs Sunday again with starting our analysis off with WTI oil.
For us it's a pretty simple setup this week. We're looking for a play off of the supply at the high of our swing, we're looking for price to drop down lower towards the 15 minute demand that we have highlighted below.
Now of course, if we don't get a reaction at this supply. We will look for price to travel back down to buy up into the triple top we have on the daily time frame.
Make sure that you always use your confirmations to get into a trade and always be flexible with your analysis. Remember, sticking to your trading plan and consistently entering the same setups will bring you profitability.
If you like this idea, drop us a boost and a comment down below.
We hope you all have a profitable and successful trading week.

buy signal base on unfilled order levels hi there 👋
in hear we have a strong supply levels which price has pushed through it.
base on RRR and risk management it can be a good position.
if you agree with me follow 4 more.

USDCAD Study Case 🧙♂️Intuition suggests price is likely to flow back up to the main weekly supply to clear out seller liquidity.
How we will get to that zone is another story.
I don't think we will push up to the zone from here. I believe price has lured buyers in after breaking the trendline marked.
So price is likely to do some manipulation to clear breakout buyers before flowing to our target.
I have done a rough illustration of what I am after but we will have to judge it as the price progresses.
I am wishing you all a fantastic trading week team!

EURUSD shortEURUSD in a similar situation like GBPUSD. Hovering around a local supply, while in a rising wedge formation, bur less sharp.
A break to the downside and break of the wedge might offer a similar setup to the downside.

GBPUSD shortGBPUSD hovering around some supply liquidity, while also being in this rising wedge. A break to the downside and break out of the wedge, might offer a short scalp.


predictive analysis of nse torntpower in wcb.NSE:TORNTPOWER tested the upward trend channel zone and major support zone and reversed till now in wcb chart. drawn future paths according present price action and supply demand zones.

AUDUSD shortAlthough you could build a case for a bottom reversed H&S long. It's actually a short setup that I have in sight.
It's because it's a broken demand zone that became a supply zone and it had a significant local rally afterward.
So for me it's basically two setups in one. A supply zone and bounce zone, which could indicate a very strong zone for a correction or reversal.
It's of course if price can manage reaching these levels and not punches through. Nothing is curtain, just ideas and probabilities.