EURUSD Testing Strong Support ZONE Near 1.0700EURUSD Testing Strong support zone near 1.0700
EURUSD is currently testing strong support zone near 1.0680:1.0700.
This area seems poised to push the price up again in the coming days making it a potential shortterm trade opportunity.
The US will release the consumer price index CPI data on wednesday so the market is likely to speculate again .
The US consumer price index YOY For October is expectedto be 2.6 percentage vs 2.4 percentage the previous month.
Energy YOY for October is expected to remain 3.3 percentage.
You mayfind more details in the chart thankyou and Good luck
Support-zone

COTI - A short trade#COTI/USDT #Analysis
Description
---------------------------------------------------------------
+ COTI price has broke out from the support zone and heading towards the next support
+ This is a clear indication of the continuing bearish trend.
+ I see a good opportunity for short trade here.
---------------------------------------------------------------
VectorAlgo Trade Details
------------------------------
Entry Price: 0.1833
Stop Loss: 0.2169
------------------------------
Target 1: 0.1622
Target 2: 0.1416
------------------------------
Timeframe: 4H
Capital Risk: 1-2% of trading capital
Leverage: 5-10x
---------------------------------------------------------------
Enhance, Trade, Grow
---------------------------------------------------------------
Feel free to share your thoughts and insights.
Don't forget to like and follow us for more trading ideas and discussions.
Best Regards,
VectorAlgo

Nas100 Bullish Setup Support ZoneNas100 is approaching a Key Price Level
This price level overall has been rejected before
There will be drawdown so we will scale into this trade at 50 pip increments below 14500.

GBPAUD Buybritish Pound vs Australian dollar had a rally downside and having a support on H1 support area also we are having a confluacne on M15 a trendline which was broken and is tested by the pair so we can think of a potential buy setup after a price action we had a inverted hammer down on Support level that could possibly be a reversal signal but still we will be waiting for proper price action for buy

NEARUSDT LONG ideaSince May 8, NEAR has formed a range within its support range. I expect it to break its range soon and go up to the price of 2.004

NZDCAD - Approaching A Strong SupportHello TradingView Family / Fellow Traders. This is Richard, also known as theSignalyst.
NZDCAD is overall bearish trading inside the falling channel in orange and previously we have been trading it by looking for sell setups around the upper trendline and buy setups around the lower trendline.
Now NZDCAD is approaching the lower orange trendline again.
Moreover, the zone 0.83 is a strong support.
🏹 So the highlighted purple circle is a strong area to look for buy setups as it is the intersection of the blue support and lower orange trendline. (acting as non-horizontal support)
As per my trading style:
As NZDCAD approaches the lower purple circle zone, I will be looking for bullish reversal setups (like a double bottom pattern, trendline break , and so on...)
📚 Always follow your trading plan regarding entry, risk management, and trade management.
Good luck!
All Strategies Are Good; If Managed Properly!
~Rich

CADJPY - Trend-Following Buy Setup!Hello TradingView Family / Fellow Traders. This is Richard, as known as theSignalyst.
🗒 CADJPY has been overall bullish trading above the blue trendline acting as a non-horizontal support.
Moreover, the zone 91.5 - 93.0 is a strong support zone .
📌 So the highlighted purple circle is a strong area to look for buy setups as it is the intersection of the green support zone and trendline in blue.
📉 As per my trading style:
As CADJPY approaches the lower purple circle zone, I will be looking for bullish reversal setups (like a double bottom pattern, trendline break , and so on...)
Always follow your trading plan regarding entry, risk management, and trade management.
Good luck!
All Strategies Are Good; If Managed Properly!
~Rich

Large volume. Breakdown of levelsOn the air, the volume has increased.
Also on the coin formed a cascade on the 1 hour TF.
I consider the impulse breakdown of the level after the formation of local trading.
Enter the level by delay. Exit limit.
Observe the PM and correctly calculate the volume of the position.

InvestMate|Bitcoin where to join the rises?💰Observing the current correction on bitcoin it immediately crossed my mind to write a post that is a direct continuation of yesterday's post 👇👇👇
💰In a nutshell, I would like to introduce you to an interesting support zone to which, if we were to rally, it would be worth watching bitcoin's behaviour closely at this point in order to try and connect to the upside
💰This is the zone between $19600 and $20000 which is defined by the 2 fibo levels of 0.382 and 0.5 of the last upward impulse.
💰I encourage you to watch these levels and bitcoin is shaping up to be a month rich in volatility
🚀If you appreciate my work and effort put into this post I encourage you to leave a like and give a follow on my profile.🚀

CADCHF - Video Top-Down Analysis!Hello TradingView Family / Fellow Traders. This is Richard, as known as theSignalyst.
Here is a detailed update top-down analysis for CADCHF.
Which scenario do you think is more likely to happen? and Why?
Always follow your trading plan regarding entry, risk management, and trade management.
Good Luck!.
All Strategies Are Good; If Managed Properly!
~Rich

AUDCAD - Video Top-Down Analysis!Hello TradingView Family / Fellow Traders. This is Richard, as known as theSignalyst.
Here is a detailed update top-down analysis for AUDCAD .
Which scenario do you think is more likely to happen? and Why?
Always follow your trading plan regarding entry, risk management, and trade management.
Good Luck!.
All Strategies Are Good; If Managed Properly!
~Rich

Bitcoin Detailed Top-Down Analysis - Day 66Hello TradingView Family / Fellow Traders. This is Richard, as known as theSignalyst.
66 out of 500 days done.
I truly appreciate your continuous support everyone!
Let me know if you like the series, and if you would like me to change or add anything.
Always follow your trading plan regarding entry, risk management, and trade management.
Good Luck!.
All Strategies Are Good; If Managed Properly!
~Rich

Bitcoin close to a crucial long term support zoneBitcoin price hitting a 7 year long daily support zone. I don't see a single day candle closed below it. Maybe this time we break under it and break the trend, or bounce from here and keep the trend.

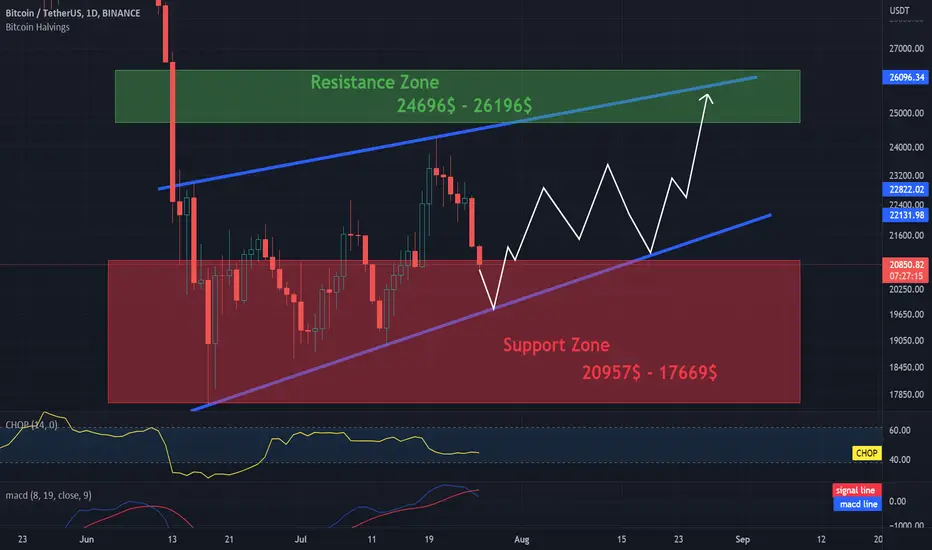
BTC is moving in the channel. Two important zones!Hi everyone.
Today we have marked the channel with blue lines in which the BTC price is currently moving.
Then, with the help of the white arrow, I tried to set the course route for the next few days on which the BTC price may move.
As you can see, we have two important zones:
-the first of them is the support zone which is from $ 20,957 to $ 17,669, if the price drops below the designated zone, we can expect further drops to around $ 12,000.
- the second is the resistance zone, which we have from $ 24,696 to $ 26,196 breaking out of this zone may result in further increases above $ 30,000
Currently, the price is moving nicely sideways on our channel, going down to the top of the channel, which can be potentially used for short-term licks.
It is also worth paying attention to the CHOP indicator, which indicates that energy is slowly running out, and the MACD indicator, which indicates that we have entered a local downward trend.
However, please remember that this is not an investment advice.
GBPUSD - Purple War Zone!Hello everyone, if you like the idea, do not forget to support with a like and follow.
As per my last analysis (below), GBPUSD rejected our upper brown trendline and traded lower.
Now GBPUSD is approaching a strong support zone.
The lower highlighted purple circle is a strong area to look for buy setups as it is the intersection of the blue support (1.29-1.3) and brown trendline. (acting as non-horizontal support)
As per my trading style:
As GBPUSD approaches the lower purple circle zone, I will be looking for bullish reversal setups (like a double bottom pattern, trendline break, and so on...)
Always follow your trading plan regarding entry, risk management, and trade management.
Good luck!
All Strategies Are Good; If Managed Properly!
~Rich

GBPUSD - Video Top-Down AnalysisHello TradingView Family / Fellow Traders. This is Richard, as known as theSignalyst.
Here is a detailed update top-down analysis for GBPUSD.
Which scenario do you think is more likely to happen? and Why?
Always follow your trading plan regarding entry, risk management, and trade management.
Good Luck!
All Strategies Are Good; If Managed Properly!
~Rich

EURUSD - My Trading Plan in a video!Hello everyone, if you like the idea, do not forget to support with a like and follow.
Here is the top-down analysis for EURUSD, feel free to request any pair/instrument or ask any questions in the comment section below.
Best of luck!

USDJPY - Detailed Video AnalysisHello everyone, if you like the idea, do not forget to support with a like and follow.
Here is the top-down analysis for USDJPY, feel free to request any pair/instrument or ask any questions in the comment section below.
Best of luck!

WAVES - Potential Bullish Reversal!Hello everyone, if you like the idea, do not forget to support with a like and follow.
WAVES is sitting around a strong support zone in green so we will be looking for buy setups.
on H4: WAVES is forming a trendline in red but it is not valid yet, so we are waiting for a new swing high to form around it to consider it our trigger swing. (projection in purple)
Trigger => Waiting for that swing to form and then buy after a momentum candle close above it (gray zone)
Meanwhile, until the buy is activated, WAVES would be overall bearish can still trade lower till the lower green support before going up.
Good luck!
All Strategies Are Good; If Managed Properly!
~Rich

AUDUSD Long EntryAUDUSD has been in a consistent downtrend for over a month. The price has repeatedly set lower lows and lower highs but recently has established a support level, 0.70937, that price has been respected multiple times. It appears that the price is beginning to form a range, and as the price has fallen back to the support zone mentioned a long entry seems appropriate. The target for this trade is at the top of the range at the 0.71700 level. The stop loss area for this trade is located at the yearly low of 0.712.

AUDUSD - Potential Bullish Reversal!Hello everyone, if you like the idea, do not forget to support with a like and follow.
AUDUSD is sitting around daily support in blue so we will be looking for buy setups on lower timeframes.
on H1: AUDUSD is forming a channel in red but the upper trendline is not valid yet, so we are waiting for a new swing high to form around it to consider it our trigger swing. (projection in purple)
Trigger => Waiting for that swing to form and then buy after a momentum candle close above it (gray zone)
Meanwhile, until the buy is activated, AUDUSD would be overall bearish can still trade lower inside the blue support before going up, or even break it downward.
Good luck!
All Strategies Are Good; If Managed Properly!
~Rich

TLM testing resistanceHello everyone, hope you all doing well.
TLM has an strong resistance on 0.38 level, with break of this level, there is literally no other resistance on its way up.
Sounds crazy but I can say Take profit zone is : 0.88 after the breakout.
Enjoy
I'm writing about most of crypto currencies;
Follow me on TRADINGview so you wouldnt miss out any updates.
Like if you think this was helpful and let me know on the comment section below.
* This is not a financial advice, use the idea with your own strategy and risk management *

NZDJPY - Potential Bullish Reversal!Hello everyone, if you like the idea, do not forget to support with a like and follow.
NZDJPY is sitting around daily support so we will be looking for buy setups on lower timeframes.
on H1: NZDJPY formed a wedge pattern in red but it is not ready to go yet. before we buy, we want the bulls to prove control again.
Trigger => Waiting for a momentum candle close above the last high to buy. If the price forms a new high around the trendline, then we will update our trigger.
Meanwhile, until the buy is activated , NZDJPY would be overall bearish can still trade lower.
Good luck!
All Strategies Are Good; If Managed Properly!
~Rich
