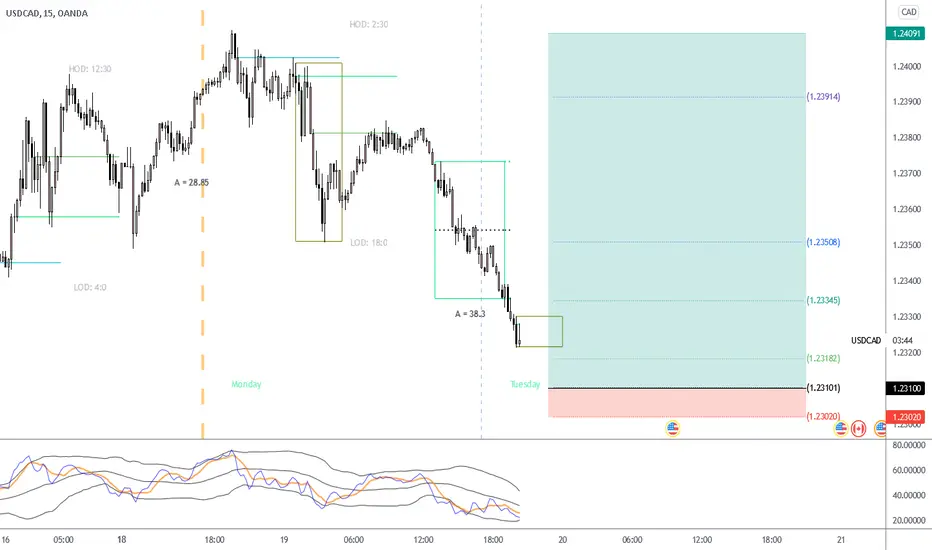
USDCAD - Looking for support at the .23100 LevelUSDCAD
BUY LIMIT @ 1.23100
Stop Loss: 1.23020 (Add Spread)
TP 1 (1R): 1.23186 (Scalp TP / SL→BE)
TP 2 (3R): 1.23356
TP 3 (5R): 1.23526
TP 4 (10R): 1.23950
Reason: Price showed strong resistance in this area in its last testing action to the left. I would like to see price react, and I will be waiting for a Break of Structure or a Wyckoff Accumulation Schematic for my entry. Alternatively, set the limit and cross your fingers 😅😅 Are you guys looking at the same thing??
Support-zone
GBP/JPY CONTINUES TO STAND LOCKED IN A TRIANGLEAt this point in time, the most important thing to pay attention to is that the area between the ¥149 and the ¥150 level continues to be a major support level and is heavily defended including the 200-EMA. However, each successive high continues to get lower so it does make a certain amount of sense that we may see an attempt to break down below the ¥149 level given enough time.
If the price breakthrough the major support zone between the ¥149 and the ¥150 level will kick off a major move to the downside that could send this currency pair all the way down towards the ¥148 level and possibly even that zone doesn’t hold the price it could reach the levels far away on South at ¥145 or ¥142.
On the other side, if the price will turn around and take out the ¥152 level, then it is likely that we would see this market go looking towards the ¥153 level or higher the levels around ¥155 - ¥156.
Risk Disclosure: Trading Foreign Exchange (Forex) and Contracts of Difference (CFD's) carry a high-risk level. By registering and signing up, any client affirms their understanding of their own personal accountability for all transactions performed within their account and recognizes the risks associated with trading on such markets and such sites. Furthermore, one understands that the company carries zero influence over transactions, needs, and trading signals. Therefore, it cannot be held liable nor guarantee any profits or losses.

USD/CAD HIT THE KEY SUPPORT ZONE AND 200-EMA AGAINUSD/CAD traded slightly higher after it hit once again the key support zone between 1.2580 and 1.2600 and the price step again on 200-EMA. That said, the recovery stayed limited near 1.2711. Lately, the pair has been trading in a consolidative manner, and thus, the experts will refrain from confidently calling its next trending direction.
In order to start examining the bearish case, traders would like to see a dip below that key support zone. This will confirm a forthcoming lower low and may initially target the 1.2533 zones. Another break, below 1.2490, could invite more bears into the game, who may drive the action towards the low of July 30th, at 1.2420, or the low from the beginning of July, at levels around 1.2300.
On the upside, the traders would assess a bullish-case scenario when we see a recovery above the zone at 1.2710. This could set the stage for upside extensions towards the high of July 19th, at 1.2810, the break of which could extend the rally towards the peak of August 20th, at 1.2947.
Risk Disclosure: Trading Foreign Exchange (Forex) and Contracts of Difference (CFD's) carry a high-risk level. By registering and signing up, any client affirms their understanding of their own personal accountability for all transactions performed within their account and recognizes the risks associated with trading on such markets and such sites. Furthermore, one understands that the company carries zero influence over transactions, needs, and trading signals. Therefore, it cannot be held liable nor guarantee any profits or losses.

USD/CAD HIT ONCE AGAIN KEY SUPPORT ZONEUSD/CAD traded slightly higher yesterday after it hit once again the key support zone of 1.2580, clearly visible on a 4-hour chart. That said, the recovery stayed limited near 1.2630. Lately, the pair has been trading in a consolidative manner, and thus, investors will refrain from confidently calling its next trending direction.
In order to start examining the bearish case, the experts would like to see a dip below that key support. This will confirm a forthcoming lower low and may initially target the 1.2533 zones. Another break, below 1.2490, could invite more bears into the game, who may drive the action towards the levels of 1.2426 or slightly on South to the key support and psychological zone at 1.2300.
On the upside, the experts would assess a bullish-case scenario when they see a recovery above the high of August 27th, at around 1.2700. This could set the stage for upside extensions towards the high at 1.2787, the break of which could extend the rally towards the peak of August 20th, at 1.2950.
Risk Disclosure: Trading Foreign Exchange (Forex) and Contracts of Difference (CFD's) carry a high-risk level. By registering and signing up, any client affirms their understanding of their own personal accountability for all transactions performed within their account and recognizes the risks associated with trading on such markets and such sites. Furthermore, one understands that the company carries zero influence over transactions, needs, and trading signals. Therefore, it cannot be held liable nor guarantee any profits or losses.

GBPCHF - Look For Buy Setups!Hello everyone, if you like the idea, do not forget to support with a like and follow.
GBPCHF is approaching our lower brown trendline so we will be looking for buy setups.
Moreover, the blue level 1.250 is support from Daily timeframe.
Thus, the highlighted purple circle is a strong area to look for buy setups as it is the intersection of the blue support and lower brown trendline. (acting as non-horizontal support)
As per my trading style:
GBPCHF is sitting inside the purple zone, so I will be looking for bullish reversal setups on lower timeframes(like a double bottom pattern, trendline break, and so on...)
Of course, unless the zone is broken downward, then we will be looking for sell setups on its retest.
Always follow your trading plan regarding entry, risk management, and trade management.
Good luck!
All Strategies Are Good; If Managed Properly!
~Rich

eurchf (buy after break the first blue zone !!)eurchf we will be bullish on eurchf only and if only the first blue zone be broken

NIO heading towards major Support levelMajor support level acting as an LLT
look for extension on trade (yellow arrow)
one resistance zone that could slow done flow however i am not expecting it to have a huge impact of the overall trade
entry: 33.5 (bit deep in the zone but will take my chance of limit order being hit, will manage it though)
Stop: 30.25
TP: 41.7

13 August - GBPJPY Trade PlanGBPJPY
Considering it's Friday i'll have risk today.
Session Bias: Ranging
Daily: Bearish
4H: Bullish
30m: Ranging

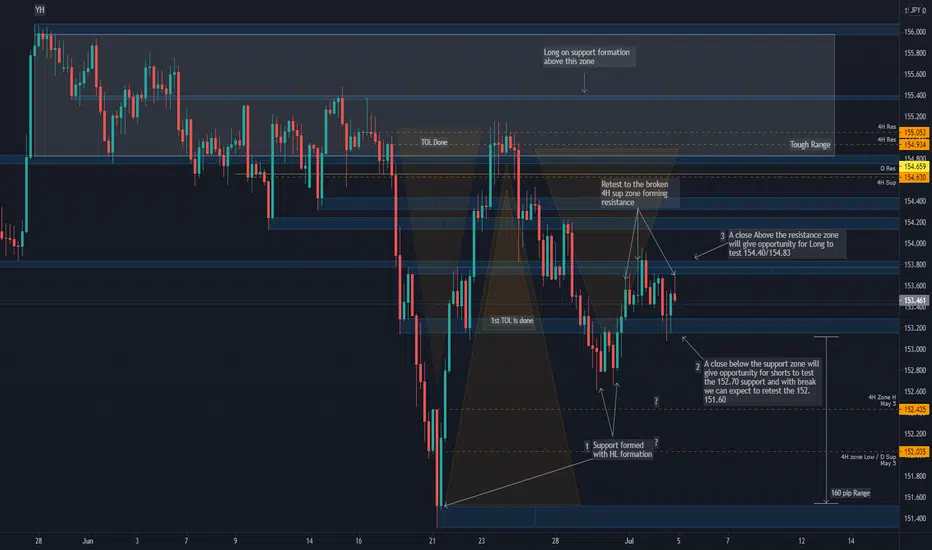
GBPJPY 9-13 August Daily OutlookGBPJPY
GBPJPY 9-13 August Outlook
Monthly structure still holding bullish structure with previous 2 months bearish close respecting 152.00 key level.
Weekly continuing the bullish momentum after 23 July solid close. Still we are trading below 153.66 28 June resistance formed due to 17 May support at 154 key level. Weekly is showing potential for more ups side to retest the 153.66. A close above will indicate a new HH is formed and possible continuation to Yearly High at 155.70.
Daily structure still bearish with LH/LL formation, trading below 1 July resistance formed at 153.56 due to the support formed on 14 May at 153.70. August 3 formed the first HL since 1 July at 151.67 bouncing from the daily zone at 151 key level. A close above 153.70 will give the opportunity to test the highs at 154.43 and 154.85. On the other side a close below 151.67 current daily support and resistance formation will confirm that bearish momentum still in play and testing the lows at 149.50 will be in play.

GBPJPY - 5 August Trade PlanSession Bias: Bullish
Daily: Bullish
4H: Bullish
30m: Bullish
Important news at 12:00

GBPJPY 2 - 6 August Outlook
1- Monthly structure still bullish even with the resistance formation at 155.63 as long we hold closes above 151 we will challenge the highs again. Anticipating August candle to wick down forming a support on Daily and 4H for testing the highs at 153.40 and above.
2- Weekly structure is bearish and a close above 153.65 will give the opportunity to continue the monthly bullish structure.
3- Daily structure still bearish with LH/LL formation, holding support above 152 will give the opportunity to challenge 153/153.65 for bullish continuation. A close back below 152, will invalidate the bullish move and a possible retest to the lows created at 149.50.
4- 4H structure solid bullish with HH/HL formation.
I've 2 Scenarios as following:
Scenario 1: Bullish
Holding support above 152 will give the opportunity to retest the 153/153.65 and with a close above will indicate that we had formed HL on daily which will target the 154/154.50.
Scenario 2: Bearish
A close below 152 will be the first sign of rejection, a lower resistance formation below will confirm the daily bearish structure continuation and the lows created at 149.50 will be in play as targets.
Also note that we have important news almost everyday for JPY and GBP, so please map the news and set alerts.
Good luck all, wishing everyone a good trading week.

SILVER - Potential Bullish Reversal!Hello everyone, if you like the idea, do not forget to support with a like and follow.
SILVER is approaching strong daily support in green so we will be looking for buy setups.
Before we buy , we want the buyers to prove that they are taking over again.
You don't want to buy a bearish market right?
on H4: SILVER is forming a channel in red but our upper trendline is not valid yet, so we are waiting for a new swing high to form around it to consider it our trigger swing. (projection in purple)
Trigger => Waiting for that swing to form and then buy after a momentum candle close above it (gray zone)
Meanwhile, until the buy is activated, SILVER would be overall bearish can still dive inside the green support before going up.
Good luck!
All Strategies Are Good; If Managed Properly!
~Rich

GBPJPY 5- 9 July Weekly Outlook and Trade Plan - Daily ChartGBPJPY
Previous Month : Bearish
Previous Week : Bearish
Previous Day: Bullish
Weekly : Still reacting to the formed Year High reached and the Weekly resistance formed on Jan 2018 but holding bullish weekly structure with June 21 Support formed.
Daily : Structure is solid bullish respecting every zone created during the bullish run since March 2020. currently we are holding support above daily zone low at 151.24 where price formed a solid support trying to push again to the 155 year high, but failed to hold above the broken support at 154.60 forming a lower high. On a daily short term view we are looking bearish with LL/LH formation. If we managed to close below 152.70 a retest to the lows at 151.50 is expected with more potential to extend the move down further.
A close above 154.00 will give the opportunity to test the broken support at 154.80 and 155 level. Holding support at these levels will indicate that retracement from the Year High is finished and we can expect a new year high to form after reaching 156.
4H : Structure still showing LH/LL formation which is keeping GBPJPY to the down side. With the completion of a TOL/Retest of the broken daily support at 154.20 and a resistance formation below will open for more down side.
No Major news for GBP and JPY during this week, but we have the G20 meeting on Thu and Fri, so would expect markets to have some reactions with any news coming out from there.
COT report showing GBP Longs are decreasing during the past 12 weeks while JPY Shorts are still strong. That will keep GBP/JPY to the upside.

GBPJPY 5- 9 July Weekly Outlook and Trade Plan - 4H ChartGBPJPY
Previous Month : Bearish
Previous Week : Bearish
Previous Day: Bullish
Weekly : Still reacting to the formed Year High reached and the Weekly resistance formed on Jan 2018 but holding bullish weekly structure with June 21 Support formed.
Daily : Structure is solid bullish respecting every zone created during the bullish run since March 2020. currently we are holding support above daily zone low at 151.24 where price formed a solid support trying to push again to the 155 year high, but failed to hold above the broken support at 154.60 forming a lower high. On a daily short term view we are looking bearish with LL/LH formation. If we managed to close below 152.70 a retest to the lows at 151.50 is expected with more potential to extend the move down further.
A close above 154.00 will give the opportunity to test the broken support at 154.80 and 155 level. Holding support at these levels will indicate that retracement from the Year High is finished and we can expect a new year high to form after reaching 156.
4H : Structure still showing LH/LL formation which is keeping GBPJPY to the down side. With the completion of a TOL/Retest of the broken daily support at 154.20 and a resistance formation below will open for more down side.
No Major news for GBP and JPY during this week, but we have the G20 meeting on Thu and Fri, so would expect markets to have some reactions with any news coming out from there.
COT report showing GBP Longs are decreasing during the past 12 weeks while JPY Shorts are still strong. That will keep GBP/JPY to the upside.
EURNZD - 07 – 11 June 21 Week Trade PlanEURNZD
This is my 07 – 11 June 21 Week Trade Plan for EURNZD
Previous Month : Bullish
Previous Week : Bullish
Daily : Bearish
As anticipated last week, EURNZD played the range from 6650/7020 and with the daily solid close on 28 May it pushed it to the range high at 6980/7020 Res Zone with some Res formation on the way up at 6820/6860.
As EURNZD still in range and no clear break out, i expect EURNZD to again test the range lows at 6700/6650.
COT report showing that NZD shorts had increased their positions but still not convincing as it's only one week that showed that increase. Longs are still holding their positions. A confirmation that NZD shorts are into the market when i see 2 to 3 weeks consecutive increases in short positions .
Seasonality showing that NZD will weaken till mid May and strength till end of May continuing into June to create new NZD highs which will lead EURNZD to create a new low.
Technically, i'm looking for EURNZD to still range between 7020/6650, which makes me look for longs from range lows and shorts from range highs as long no break and support/resistance formation above Sup/Res zones marked.
My plan for this week as EURNZD reached the top of the range, i'll look for resistance formation below the daily resistance formed and below the Res zone at 6980/7020 to short back to the range low at 6700/6650.
My preferred longs will be above the Res zone 6980/7020 with support formation above on 4H.
No major news this week for NZD and Monday is NZD Bank Holiday.

BTCUSDTAn important and influential point in the bitcoin process
Take a closer look at the blue area shown here. There are support factors, including the Ichimoku cloud range and the moving average within it, that the trend has not been able to defeat.
Now, if it continues to support the trend, it will cause Bitcoin to rise.
And if it can't stop the fall, it will face a serious challenge on the canal floor.

ADAUSDTTriangle pattern is a tool to fly the price of Cardano
As you can see in the chart, the Cardano trend is a triangle that prepares to break the triangle and create a completely uptrend.
In this way, Cardano prepares himself to achieve higher goals.
The area shown in yellow has the support and leverage to push prices, including moving averages and trend lines and the smoothed Ichimoku cloud, and even Fibonacci lines and other supports that Cardano has leaned on in recent trends. Shown. This range will have the power to raise the price to the top of the triangle, but can not guarantee the continuation of the upward trend, but we are optimistic that the triangle pattern will be broken in Cardano's third attempt.

GBPJPY - 22 March - 2 April 21 Weekly Trade PlanGBPJPY
This is my 29 March – 2 April 21 Week Trade Plan for GBPJPY
Monthly: Solid bullish and with a close above 150.40 will open the door to test 153.84 / 154.90 but still a close above 152.62 the May/Aug 13 zone high that is holding GJ from any upside.
Weekly: Solid Bullish with previous week candle tested broken resistance 148.85 and bounced with a long nice lower wick. But still minor weekly resistance formed at 151.62 will be holding any up move until a close above 152.62
Close above the weekly resistance is required for further up move but still a close above 152.62 Monthly range high will give solid confirmation
Close below will indicate a top formed with rejection from M range and a correction to the up move is due
Daily: Solid Bullish with support formed at 148.76 after testing 24 to 26 zone 149.63 / 148.30. A Resistance zone 151.74/151.91 to be a rejection point for any further up move. A solid close above will indicate bullish momentum continuation.
So I've 2 Scenarios for next week as following:
Scenario 1 : Looking for GJ to retrace and form a support between 151.63 and 149.86 to confirm creating a HL to extend the bullish momentum and to test highs
Scenario 2 : A failure to create a support will indicate a LH is formed and we may test the lows created at 148.76 and may be continuation
Weekly trade plan 4H Chart:
Daily Analysis Chart:
Weekly Analysis Chart:

EURNZD 22-26 Feb 21 Week trade Plan FX:EURNZD
Previous Month : Bearish
Previous Week : Bearish
Daily : Bearish
- EURNZD failed to hold above 6820/45 resistance zone and rejected multiple time during last week tide range. Breaking lows on Friday reaching weekly planned TP2 at 6590. Refer to last week plan:
- The COT report showing that NZD buyers are still in control and increasing their NZD long positions. Still NZD sellers are not into market yet and this adds confirmations for EURNZD continued bearish momentum.
- Seasonality is showing that NZD will weaken till end Feb, but still NZD holding and continuing it's strength. We could see some reversals on EURNZD as we had created new lows, but still such spikes are opportunities for better shorts.
- So with Current solid bearish momentum, COT and Seasonality; i'd expect EURNZD to continue the bearish momentum and any spike will be treated as a good opportunity for shorts until a solid formation above 1.7020 level.
- Through trading several Months EURNZD, I prefer to see retracements to any move in order to have a range to trade to target created. So i recommend to Short after retracement or break and Resistance formation below broken Support and vise versa for Longs.
- Important news for NZD this week on Tuesday Retail Sales and Interest Rates for China on Monday.

EURNZD - 15-19 Feb 21 Week Trade Plan EURNZD
Previous Month : Bearish
Previous Week : Bullish
Daily : Bearish
- EURNZD retested the low formed at 6640 and formed a support on Feb 9. The bounce from 6640 extended to test resistance level 6780 and resistance zone at 6820/45 where it found solid rejection on Friday at the resistance zone but still holding above 6780/60 support zone.
- The COT report showing that NZD sellers are still picking up but still not a confirmation that buyers are out yet. I anticipate that this could be the spike that EN does with each new low created and with the current support formed at 6640.
- Seasonality is showing that NZD will weaken till end Feb, I anticipate that this week we could have the last strength for NZD before continuing weakness till end of Feb.
- So with Current solid bearish momentum, COT and Seasonality; I'd expect EURNZD to continue the bearish momentum and any spike will be treated as a good opportunity for shorts until a solid formation above 1.7020 level.
- Through trading several Months EURNZD, I prefer to see retracements to any move in order to have a range to trade to target created. So I recommend to Short after retracement or break and Resistance formation below broken Support and vise versa for Longs.
- No major news for NZD this week and China having Bank Holidays so not expecting major moves during Asia Sessions.
Weekly Chart Outlook:
Monthly Levels:

EURNZD - 08-12 Feb 21 Week Trade Plan EURNZD
Previous Month : Bearish
Previous Week : Bearish
Daily : Slightly Bullish
- EURNZD finally broken the range and closed below 1.6780 reaching 1.6720 and barely 1.6620, meaning we are in a very solid bearish momentum.
- The COT report showing that NZD sellers are picking up for the first time since the start of 2021 but still not a confirmation that buyers are out yet. I anticipate that this could be the spike that EN does with each new low created.
- Seasonality is not correlated with the current PA as NZD strengthen during Feb and created a pick now while Seasonality is showing ranging and a bit of weakness for NZD. I'll wait for this week to clarify a bit to confirm.
- So with Current solid bearish momentum, COT and Seasonality; I'd expect EURNZD to continue the bearish momentum and any spike will be treated as a good opportunity for shorts until a solid formation above 1.7020 level.
- Through trading several Months EURNZD, I prefer to see retracements to any move in order to have a range to trade to target created. So i recommend to Short after retracement or break and Resistance formation below broken Support and vise versa for Longs.
- We have important news for NZD on Tuesday and Friday for Inflation and Business PMI also some news from China on Wednesday which also effects NZD.
Daily Chart :
Weekly Chart :

EURNZD - 1 - 5 Feb 21 Week Trade Plan FX:EURNZD
Previous Month : Bearish
Previous Week : Bearish
Daily : Slightly Bullish
- EURNZD since 5Jan still ranging between 6980 / 6840 after a long term bearish trend since the top created on March 2020.
- The COT report still showing that 68% of institutional positions are Long NZD which is a bit less than last week, but still at it's highest levels since 3 years compared to 32% Short positions. This is translated on the chart with EURNZD sustaining it's bearish trend and we are seeing support levels broken every week.
- Seasonality showing that NZD should be ranging during Feb after reaching the top during Jan by reaching 6770 sup and slightly to the weak side.
- So with Current Range, COT and Seasonality; i'd expect EURNZD to be ranging and slightly moving up if we formed Support above 6980.
- Through trading several Months EURNZD, I prefer to see retracements to any move in order to have a range to trade to target created. So i recommend to Short after retracement or break and Resistance formation below broken Support and vise versa for Longs.
- We have important news for NZD on Wednesday for Employment and historical data shows 200 pip range on this news.

H1 Support Zone, Tested 1xLast support M15 that I share, buyer rejection about 100 pt +/-, and currently breaking it. Based on H1, I prefer this zone as this zone has buyer re entry 1x. Looking for more strong buyer here than my analysis before. I prefer to entry bottom candle bottom shadow.
