EURNZD - 17-22 Jan Week trade Plan This is my 17-22 Jan 21 Week trade Plan for EURNZD . FX:EURNZD
Previous Month : Bearish
Previous Week : Bullish
Daily : Bullish
4H : Bullish
- With all HTFs (M, W, D) are trending down, Monthly pointing to 1.6670 - Weekly pointing to 1.6770 and Daily currently bouncing from a solid support zone 1.6850/20.
- The COT report showing that 70% of institutional positions are Long NZD which is the highest since 3 years compared to 30% Short positions. This is translated on the chart with EURNZD sustaining it's bearish trend and we are seeing support levels broken every week.
- Seasonality showing that EURNZD should be strong during the first 2 weeks of Jan which had happened during the last 2 weeks and the highest to reach this month and weakness should be the theme for the remining of Jan.
- Through trading several Months EURNZD, I prefer to see retracements to any move in order to have a range to trade to target. So I recommend to Short after retracement or break and Resistance formation below broken Support and vise versa for Longs.
- We have important news for NZD on Tuesday and Friday, Also China is having very important news on Monday and Wednesday.
Support-zone

EURNZD - 11-15 Jan Week trade Plan FX:EURNZD
This is my 11-15 Jan 21 Week trade Plan for EURNZD .
Previous Month : Bearish
Previous Week : Bearish
Daily : Bearish
4H : Bearish
With EURNZD ended last week with bearish close below 1.6980 confirming the bearish momentum, I'm expecting further continuation to the down side with cautious as currently we are at HTF support zone that may hold a bit EURNZD from the down move.
Also COT Report and Seasonality are showing that NZD is currently strong, so expectation for the bearish momentum continuation is viable.
I'd highlighted 2 scenarios for Shorts and Longs with No Trade Zone.

EURNZD - HTF Outlook for Q1 2021This is my HTF outlook on EURNZD for Q1 2021 that will evolve on trading plans according to market structure. FX:EURNZD

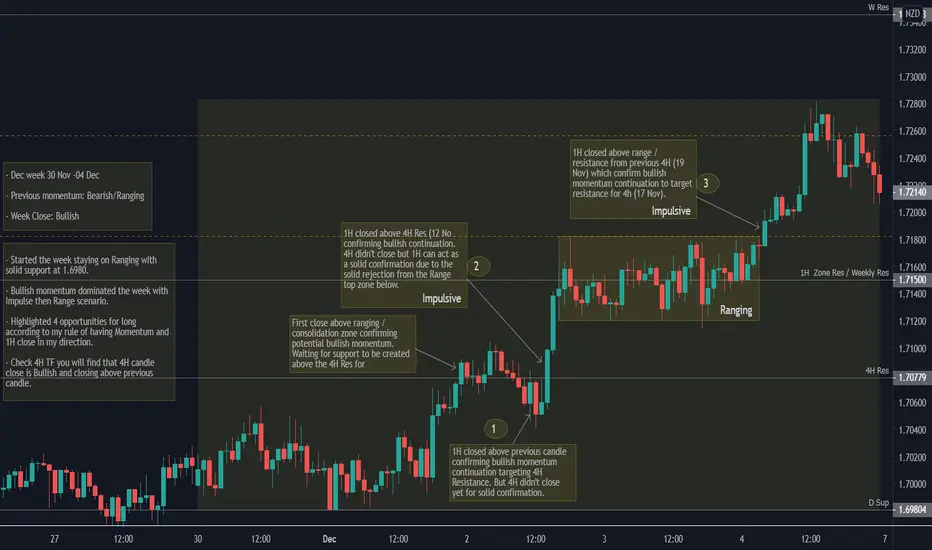
EURNZD - 21-25 Dec Week trade opportunities for reference- Dec week 21 -25
- Previous momentum: Bearish
- Week Close: Bullish
- Range: 242 pip
- Bullish momentum, break of last week high and retesting Nov 9 resistance level was the first spot at week start. With EURNZD HTF bearish momentum and current unjustified bullish move, failure to break and hold above 9 Nov resistance at 7345, suggests that correction for this up move is due.
- Highlighted 2 opportunities for Short according to my rule of having Momentum and 1H close in my direction and as per my Weekly Plan. the other Long opportunity could be traded but wasn't planed.
- Check 4H TF you will find that 4H candle close is Bearish and closing below previous candle.
Previous week trade plan : FX:EURNZD

EURNZD - 07-12 Dec Week trade opportunities for referenceFX:EURNZD
This is a summary of the trade opportunities during this week according to my Trade Rules:
1- Momentum
2- HTF close with momentum direction
3- 1H close above / below previous candle in momentum direction
4- Targets for TP points from Week Outlook

GBPAUD BUY AgainOANDA:GBPAUD
As a part of my trading strategy a martingale with calculated risk.
Reversal signs + trend line analysis + Support zone
TP1 and move SL to BE
Trade at your own risk

EURNZD - Dec 07-11 Week trade planFX:EURNZD
This is my trade plan for EURNZD for next week Dec 07-11 based on HTF analysis.
Trades will be executed according to my trading rules:
1- Momentum
2- HTF close with momentum direction
3- 1H close below/above previous candle in momentum direction
4- Targets for 1H recent support/resistance
Please refer to the Daily outlook for further HTF outlook.

EURNZD - Nov 30-04 Oct Week trade opportunities for referenceFX:EURNZD
This is a summary of the trade opportunities during this week according to my Trade Rules:
1- Momentum
2- HTF close with momentum direction
3- 1H close above previous candle in momentum direction
4- Targets for TP points from Week Outlook
Please refer to week outlook :
EURNZD - HTF Outlook will evolve for a trade plan FX:EURNZD
This is my outlook for EURNZD for next week Nov 23-27.
Putting in consideration the following:
1- HTF Solid Bearish Momentum
2- Weekly tested Solid support zone
3- Daily Bearish Close
4- 4H Bearish momentum
5- 1H Potential Bullish momentum
Also a reference note:
Historical Points on EURNZD
- It intends by end of Nov to slow down in trend to reverse in Dec.
- So if we just reached a support or at least this week another low, i expect it to reverse in Dec

NAS100 - HTF Trade Plan for 16-11-2020 OANDA:NAS100USD
This is my HTF analysis for NAS100 trade plan.
Looking for triggers as per the plan for longs or shorts.
Executions will be according to confirmation of creating Support above Resistance or Resistance below Support.

EURNZD - HTF Outlook will evolve for a tradeFX:EURNZD
1- HTF Solid Bearish Momentum
2- Weekly tested Solid support zone
3- Daily Bullish Close
4- 4H Bullish momentum
5- 1H Solid Bullish momentum
Looking for shorts below 4H resistance zone on 4H Bearish close and confirmation of Resistance creation on 1H.
Entry on 30min confirmation
This plan will be discarded if we created support above 4H Resistance zone


EURAUD video top-down AnalysisHello everyone, if you like the idea, do not forget to support with a like and follow.
Here is the top-down analysis for EURAUD, feel free to request any pair/instrument or ask any questions in the comment section below.
Best of luck!


USDJPY Buy SetupOn DAILY: USDJPY is sitting around a support zone in green so we will be looking for buy setups on lower timeframes.
on M30: USDJPY is currently forming a symmetrical triangle in red. (but it is not valid yet)
so we are waiting for a third swing to from around our upper red trendline to consider it valid and buy after a momentum candle close above it.
Good Luck!

GBPJPY video top-down AnalysisHello everyone, here is the top-down analysis for GBPJPY, feel free to request any pair/instrument or ask any questions in the comment section below.
Best of luck!

USDSEK video top-down AnalysisHello everyone, here is the top-down analysis for USDSEK, feel free to request any pair/instrument or ask any questions in the comment section below.
Best of luck!

Looking Good ***IDEA***Microsoft Is looking to make a move this week, Its in the bottom of the regression trend and in its 204 - 202 support zone, looking to see the move to around 208, earning i believe will be good, i mean come on its microsoft... but looking good on the macd, Rsi is low and stoch rsi made the turn up. Lets see what happens. This is kind of a continuation of my idea from last week. *JUST A IDEA* Looking for move up to $220!!! Fingers Crossed!

USDCAD Important Level To Watch..Do your own analysis ...
Dont Forget Moving StopLoss At Breakeven
Disclaimer!
This post does not provide financial advice. It is for educational purposes only! You can use the information from the post to make your own trading plan for the market. You must do your own research and use it as the priority. Trading is risky, and it is not suitable for everyone. Only you can be responsible for your trading.

GBPUSD Long?I am watching the price of this pair this week, looking for a potential pullback and bullish signs to potentially take a long position up to the resistance zone. Any opinions? Let me know your thoughts! Happy trading!

EURNZD approaching an oversold areaon DAILY: EURNZD is approaching a strong support/resistance zone in blue so we will be looking for objective buy setups on lower timeframes.
on M30: this pair is still overall bearish making lower lows and lower highs, and it is now forming a trendline (not valid yet).
so we are waiting for a third swing to form around it to consider it objective and enter on its break upward.

USDJPY Potential Bullish MovementUSDJPY Potential Bullish Movement
we are waiting for a momentum candle close above 108.0 to buy this one
Reason:
1- Objective symmetrical triangle (in blue)
2- Objective Head and Shoulders pattern (in orange)
3- Support Zone from Daily 107.0 (from in purple)
Three confluences are enough to consider Buying USDJPY, after a break below 108.0 (in gray)
*unless price breaks aggressively below 107.00, then a bearish movement would be expected
