SXPUSDT D1 Analysis | Rank : 264👀 Welcome to my Trading View Analysis and Trading Channel Here , we share the latest market analysis, trading signals, and key insights together .
Ready for smarter trades ? ⭐️
⚡️Today , we're going to analyze the SXP (Solar) coin together on the daily timeframe and find triggers for our positions .
The price chart has successfully broken out of the descending channel , signaling the end of the downtrend , and this breakout has been confirmed . Currently , the price is consolidating below a key horizontal resistance level , exhibiting back-and-forth volatility . At this stage , a bullish flag pattern is forming , which is a strong indication of potential price appreciation . If the price decisively breaks through this resistance , it could pave the way for a significant upward move , potentially targeting $0.40 . 👇🏻
More precisely , if the support at $0.1977 holds , we can be optimistic about this coin’s upward movement . Additionally , if the resistance at $0.2190 is closed above on the daily timeframe and a setup candle provides an entry signal for a spot trade , we can initiate a buy and open a long position . 🐈
I researched this coin on CoinMarketCap on your behalf , and I'm sharing a summary of the information I gathered .
Read carefully , as you need to have this information . 🌈
SXP (Solar) is the native cryptocurrency of the Solar Network, a blockchain platform focused on scalability, speed, and low-cost transactions. Here’s a brief overview:
- Purpose : SXP powers the Solar ecosystem, used for transaction fees , staking, and governance .
- Tech: Solar Network aims for high throughput with a Delegated Proof-of-Stake (DPoS) consensus , making it energy-efficient .
- Use Cases: Primarily for DeFi , payments , and dApps , with a focus on user-friendly wallet solutions .
- Market : As of my last data (Oct 2023) , SXP has a moderate market cap , often fluctuating with market trends . Check CoinMarketCap or CoinGecko for real-time price and volume .
- Community : Active development and partnerships , especially in payment processing and blockchain interoperability .
For trading or investment , check recent price action , volume, and on-chain metrics . Want specific details or analysis tips for SXP ? Let me know !
I love you all so much . 👀
don't forget about capital management and risk management .
Be careful with your positions . 🥇
Support

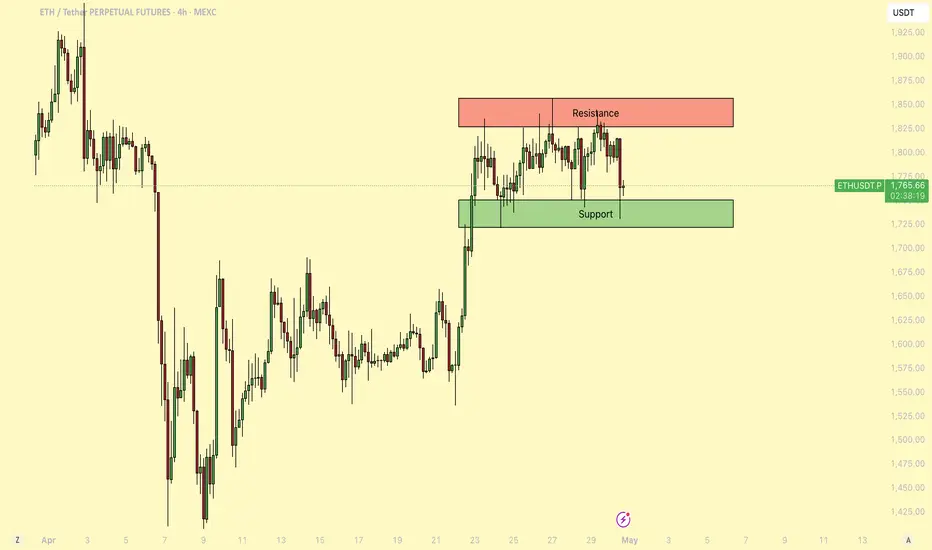
ETH - Consolidating before a major breakout!About a week ago, Ethereum (ETH) saw a strong upward move, pushing the price up with notable momentum. Since then, it has entered a period of consolidation, trading within a tight range as the market awaits the next decisive move.
-------------------------------
Which Direction Will ETH Break?
After such a strong rally, this kind of consolidation is normal. It could signal a continuation to the upside, especially if this is part of a broader relief rally. However, it's important to note that during the rapid move up, ETH left behind a 4h Fair Value Gap (FVG), which may attract price back down for a potential fill in the event of a breakdown.
-------------------------------
Stochastic RSI insight
On the daily chart, the Stochastic RSI remains in the overbought zone. Historically, when this indicator lingers in such territory, ETH has seen notable pullbacks. This could be an early sign that a downward move is more likely unless momentum changes soon.
-------------------------------
ETH vs. the 50-Day Moving Average
ETH is currently struggling with the 50-day Moving Average (MA), trading just below this key resistance level. As long as ETH remains under the 50-day MA, bearish pressure could continue. However, a reclaim and sustained hold above this level would likely indicate a shift toward bullish momentum.
-------------------------------
My Outlook
This range is tricky to trade, and a breakout in either direction is possible. Personally, I think there's a chance ETH could sweep the recent highs before a larger move down. The overbought Stochastic RSI and resistance at the 50-day MA both suggest that the rally might be losing steam in the short term.
-------------------------------
Thanks for your support.
- Make sure to follow me so you don't miss out on the next analysis!
- Drop a like and leave a comment!
Bearish Divergence appeared.Bearish divergence appeared on Daily as well as
Weekly TF.
Strong resistance is there around 127 - 129.
Once this level is Crossed, we have open ways
towards 145 - 147
On the flip side, we have a good support around
120-122. However, breaking 116 this time will bring
more selling pressure towards 113 initially.

LINK Trade Setup – Pullback to Support OpportunityChainlink (LINK) is currently testing resistance, and a retracement into the next support zone offers a clean long entry with solid upside potential.
🔹 Entry Zone:
$13.00 – $13.40
🎯 Take Profit Targets:
🥇 $15.00 – $16.00
🥈 $17.00 – $18.00
🛑 Stop Loss:
Just below $12.00

$16.50 to $39 in less than 24 hours Uptrend was too good to pass on at $16 so I said this could continue uptrending to $30, $40.
The next morning it goes on a power vertical into $40 area NASDAQ:CEP
Congrats if you saw my messages and jumped in!

GOLD...LONGPYTH:XAUUSD
Market structure suggests is preparing for its next move.
The AND level will likely play a critical role in the upcoming direction.
** If structure breaks and confirms the shift, a new bias might form after the retest. **

Extremely Bullish.
Extremely Bullish.
Took Support from a very Important level around 136 - 140.
Hidden Bullish Divergence has appeared.
176 - 182 is a Resistance Zone.
Crossing & Sustaining 201, lead it towards 235 - 237.
On the flip side, 170 & 161 - 162 seems to be a Good Support level.

LINK/USDT 4H Chart ReviewHello everyone, let's look at the 4H chart LINK to USDT, in this situation we can see how the price was moving in a downward channel, from which we saw an exit to the top and the formation of a new local uptrend line.
Let's start by defining the targets for the near future that the price has to face:
T1 = 15.08 USD
T2 = 16.87 USD
Т3 = 17.93 USD
Т4 = 19.07 USD
Now let's move on to the stop-loss in case the market continues to fall:
SL1 = 13.98 USD
SL2 = 13.12 USD
SL3 = 11.74 USD
SL4 = 10.76 USD
SL5 = 9.48 USD
If we look at the RSI indicator we can see how the price correction gave a strong rebound on the indicator, which could potentially give strength for new growth.

#BEARISH MOVE EXPECTEDIn this analysis we're focusing on 1H time frame for gold. In this analyze we are using downward trendline along with the combination of price action. When price enter in our supply area, so our first step is to observe how price will react and if price give any bearish confirmation then we'll execute our trade. Confirmation is very important.
Always use stoploss for your trade.
Always use proper money management and proper R:R ratio.
This is my analysis not a financial advice.
#XAUUSD 1H Technical Analysis Expected Move.

GOLD ANALYSISIn this analysis we're focusing on 1H time frame for Gold. Today I'm expecting bullish momentum and my bias was bullish. On the basis of SMC concept and price action when price reach my zone and give any bullish confirmation, after observing strong confirmation. I'll trigger my trades. Let's see what happens and which opportunity market will give us.
This is a higher time frame outlook. Let's analyze more deeply in smaller time frame for finding ideal and crucial entry point. Confirmation is very important.
Always use stoploss for your trade.
Always use proper money management and proper risk to reward ratio.
This is just my analysis.
#XAUUSD 1H Technical Analysis Expected Move.

#XAUUSD 1H ANALYSISXAUUSD 1H Supply & Demand Analysis
In this analysis we're focusing on 1H time frame, for finding upcoming movement and changes in Gold prices. Price action shows a clear bearish structure following a strong upside move that was met with resistance near the 3370–3380 supply zone. After two Breaks of Structure (BOS), price is retracing toward a premium level where supply is expected to be reactivated.
Marked areas:
🔴 Supply Zone: 3370–3380 (potential short-entry zone)
🔵 Demand Zone: 3260–3290 (reversal or TP zone)
Target 1: 3315
Target 2: 3305
Target 3: 3292
This setup suggests an ideal Sell from Supply once price reacts and confirms bearish intent with internal structure shifts. Patience is key wait for price to tap the zone and show signs of weakness before entering. Confirmation is very important.
Always use stoploss for your trade.
Always use proper money management and proper risk to reward ratio.
This is just my analysis not financial advice.
#GOLD 1H Technical Analysis Expected Move.

EURUSD - Bullish Shift after IFVG? This chart outlines a clean sequence of bullish intent where institutional accumulation is visible through structure, inefficiency, and reactive zones.
---
1. Support Zone Holds — Demand Confirmed
The previous resistance area has now clearly flipped into support , marked by multiple wicks rejecting lower prices.
- This region is a high-probability demand zone engineered through earlier consolidation.
- Price returned to this level, swept minor liquidity, and immediately bounced—confirmation that demand is active.
---
2. Fair Value Gap (FVG) — The Imbalance Magnet
A clean FVG sits above price, created during the prior bearish leg. Now acting as a rebalancing zone.
- Price is pushing into this inefficiency after finding support.
- The gap inversion (price reclaiming and holding above the FVG) would validate bullish continuation.
- Think of this as the mid-point between structure and expansion.
---
3. BSL Above — The Next Liquidity Target
A key Buy Side Liquidity (BSL) level is marked higher, acting as the next logical draw for price.
- Smart money seeks liquidity above recent swing highs.
- If price holds above the FVG, this BSL becomes the magnet for bullish expansion .
---
4. Projected Price Action Flow
The roadmap is clear and logical:
- Step 1: Bounce from support (done)
- Step 2: Push through and hold the FVG
- Step 3: Expand higher toward BSL
Each leg has purpose, and the structure confirms smart money is in accumulation mode.
---
5. Summary:
- Support + FVG + BSL = Structured Bullish Thesis
- As long as price stays above the FVG post-inversion, buyers have control.
- This is a textbook case of price engineering via inefficiency and reactive structure.

SOL/USD 1W Chart ReviewHi everyone, let's look at the 1W SOL to USD chart, in this situation we can see how the price came out sideways from the downtrend line which gave a bounce, however here it is worth paying attention to the trend line that was in force before the last price peak and here we can see that the price is still below this line.
Let's start by defining the targets for the near future that the price has to face:
T1 = 171 USD
T2 = 195 USD
Т3 = 218 USD
Т4 = 252 USD
Now let's move on to the stop-loss in case the market continues to fall:
SL1 = 134 USD
SL2 = 119 USD
SL3 = 95 USD
If we look at the RSI indicator, we can see how the bounce gave a return to the lower part of the range which still indicates that we have a lot of room to continue the started increases.

AR Trade Setup – Watching for Market Structure ShiftAR is showing early signs of strength after defending the $5 key level a crucial support that bulls needed to hold. Now, the focus is on a potential shift in market structure around $6, which could lead to a strong upside move.
📍 Entry Zone:
Enter around $6 after confirmation (e.g., reclaim with strong volume or bullish candle close)
🎯 Take Profit Targets:
🥇 $12
🥈 $16
🥉 $22
🛑 Stop Loss:
Below $5

USDJPY - Already Over-Sold!Hello TradingView Family / Fellow Traders. This is Richard, also known as theSignalyst.
📈USDJPY has been overall bearish trading within the falling wedge pattern marked in blue and it is currently hovering around the lower bound of it.
Moreover, the orange zone is a strong weekly support.
🏹 Thus, the highlighted blue circle is a strong area to look for buy setups as it is the intersection of support and lower blue trendline acting as a non-horizontal support.
📚 As per my trading style:
As #USDJPY approaches the blue circle zone, I will be looking for bullish reversal setups (like a double bottom pattern, trendline break , and so on...)
📚 Always follow your trading plan regarding entry, risk management, and trade management.
Good luck!
All Strategies Are Good; If Managed Properly!
~Rich
Disclosure: I am part of Trade Nation's Influencer program and receive a monthly fee for using their TradingView charts in my analysis.

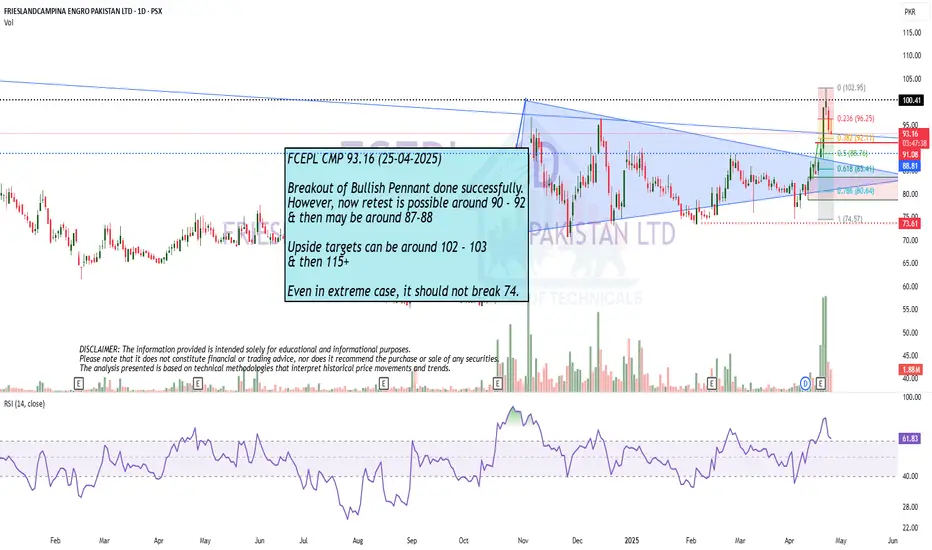
Breakout of Bullish Pennant done successfully.
Breakout of Bullish Pennant done successfully.
However, now retest is possible around 90 - 92
& then may be around 87-88
Upside targets can be around 102 - 103
& then 115+
Even in extreme case, it should not break 74.
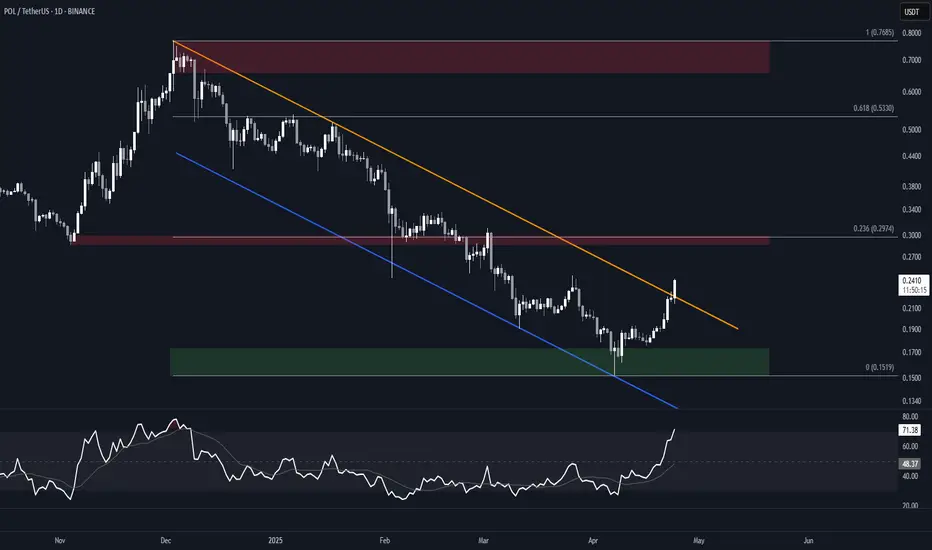
POL (MATIC) Falling Channel BreakoutBINANCE:POLUSDT is attempting a breakout from a nearly 6-months long falling channel. A daily close above the resistance would offer confirmation.
Watch for a potential retest of the resistance as support, as the overbought Daily RSI could signal an imminent pullback.
Key Levels
Aside from the support, these are all good candidates for partial TPs.
• $0.15-$0.17: Bull order block and current support
• $0.30: Previous S/R, 0.236 fib of the move down, and HVN. Will likely offer resistance.
• $0.53: Previous S/R, and 0.618 fib of the move down.
• $0.66-$0.77: Main supply zone, and December 2024 high.
VeChain Range & Structure AnalysisBINANCE:VETUSDT has been range-bound since November 2023, with very clear levels.
Key Zones
• Weekly Demand Zone: $0.019–$0.022 — major support with multiple rebounds.
• Weekly Supply Zone: $0.045–$0.055 — strong resistance dating back to early 2024.
• Midrange / HVN: ~$0.037 — heavy volume area and likely resistance if tested.
• Local Resistance: $0.027 — recent swing high + S/R since December 2023. A daily close above could mark a change of character and a shift to a bullish bias.
Possible Scenario
• With a daily close above $0.027, VET may revisit the $0.055 range high — with potential resistance at the midline along the way.
• If $0.055 is reached and followed by a sharp rejection, we might start seeing the formation of a macro Head & Shoulders — with $0.019 as a key neckline.
• Breakdown below $0.019 would activate a target near $0.0045.*
• Break above $0.055 would invalidate the H&S idea and could open the door toward $0.1150.*
* H&S scenario is purely hypothetical and would require structure confirmation.

ETH gives a strong exit from the descending channel!Hello everyone, I invite you to review the current situation on ETH, because you can see a significant rebound at the level of 30% from the last low. When we enter the four-hour interval, we can see how the ETH price moved in the local downtrend channel, from which we got an exit at the top, such a scenario often gives increases at the level of the channel height, which would bring the price closer to the levels of $ 2100.
Here you can see how the current rebound brought the movement closer to the resistance at the level of $ 1830, and then resistance is visible at the price of $ 1950, where the ETH price must then face a strong resistance zone from $ 2060 to $ 2100, where there could potentially be an upward movement after leaving the channel as in this case.
Looking the other way, you can see that when the trend reverses, we first have support at the level of $ 1730, but if it is broken, the ETH price may continue to fall and return to a strong support zone from $ 1480 to $ 1380.
It is worth paying attention to the MACD and RSI indicators because you can see how in the 4H interval we have gone beyond the upper limits of the ranges, which may translate into visible price consolidation on the chart in order to cool the situation.

LINK Trade Setup – Pullback to SupportLINK has made a solid move from ~$10 to $15 over the past couple of weeks. With that rally showing signs of slowing, a pullback into support presents a potential opportunity to catch the next leg up.
📍 Entry Zone:
$13.00 – $14.00
🎯 Take Profit Targets:
🥇 $15.00 – $16.00
🥈 $17.00 – $18.00
🥉 $19.50 – $20.50
🛑 Stop Loss:
Just below $12.00

FIL RectangleBINANCE:FILUSDT has been trading in a rectangle since August 2022. It recently below the demand zone, swept liquidity to $2 and regained support.
Key Levels to Watch
• $2.4-$3.0: Support and multi-year demand zone, recently tested and regained.
• $10.5-$11.8: Resistance and multi-year supply zone.
Measured Rectangle Targets
• Breakout: $20.0, also a support dating back to December 2020.
• Breakdown: $0.5
Filecoin is still lagging behind other alts, but, if you're looking for something you don't need to chase, it could already offer a nice long entry, with interesting R/R and a clear invalidation (lower low below $2.0).

AUD/USD IS BEARISH STRUCTUREHowdy Traders,
AUD/USD has experienced a bearish rally for the past nine days, during which it found strong support at 0.65735 . This support level has proven reliable in the past, as it successfully held the market. Furthermore, a subsequent bullish rally was observed.
In terms of the target, the market has confirmed a bearish outlook by breaking the 100-day EMA. This indicates that the market is likely to continue selling.
If the market sustained its support level so good movement is seen on the upside.
The target is- 0.66220 , 0.66047

BNB Ascending Channel (1W)BINANCE:BNBUSDT remains within an ascending channel dating back to January 2024, with multiple strong reactions at both boundaries.
After testing the upper boundary and hitting a new ATH last December, it entered a clear downtrend (orange trendline) that led to multiple attempts at the channel's support.
Price action is now getting compressed, and we could see a breakout soon.
Key Levels
• To the upside, the main resistance remains ~$700 area.
• Above that, CRYPTOCAP:BNB could have a shot at a new ATH and potentially the channel's upper boundary in the ~$900 area.
• To the downside, in case of a channel breakdown, $400 seems the first logical support (important S/R for previous swings).
Still very uncertain and in a No-Trade Zone until a breakout is confirmed.
