OptionsMastery: Looking for an immediate buy on RIOT!🔉Sound on!🔉
📣Make sure to watch fullscreen!📣
Thank you as always for watching my videos. I hope that you learned something very educational! Please feel free to like, share, and comment on this post. Remember only risk what you are willing to lose. Trading is very risky but it can change your life!
Support

GBPAUD | SCALPING TIME | BUY NOW HEY THERE;
SIGNAL ALERT
BUY GBPAUD - 2,05048 / 2,04900
🟢TP1: 2,05221
🟢TP2: 2,05689
🟢TP3: 2,06374
🔴SL: 2,04570
RISK REWARD - 3,00
Please don't forget to like 🙏🏻

SOL/USD 4H ChartHi everyone, let's look at the 4H SOL to USD chart, in this situation we can see how the price broke out from the local uptrend line at the bottom.
Let's start by defining the targets for the near future that the price has to face:
T1 = 131 USD
T2 = 136 USD
Т3 = 145 USD
Т4 = 151 USD
Now let's move on to the stop-loss in case the market continues to fall:
SL1 = 122 USD
SL2 = 115 USD
SL3 = 107 USD
If we look at the RSI indicator we can see how the indicator has dynamically gone up despite the price not moving much, but here we can see that there is still room for a potential attempt to grow.

Bitcoin - EMA Support Holding Strong!#BTC/USD #Analysis
Description
---------------------------------------------------------------
BTC/USD – Weekly Chart Analysis
📉 Current Price: $82,239 (-4.47%)
📈 Key Moving Averages:
🔹 EMA 20: 88,143
🔹 EMA 40: 81,116
🔹 SMA 50: 76,230
EMA Support Holds Strong – The chart highlights multiple historical instances where BTC found support at the 20-40 EMA zone (orange circles). This pattern has played out consistently in past market cycles.
- Bullish Trend Continuation – Each time BTC has tested this EMA region on a pullback, it has led to strong recoveries and further bullish momentum.
- Current Market Structure – BTC is once again testing this key EMA support zone. A bounce from here could signal a continuation of the uptrend.
- Historical Patterns Repeat – The blue shaded region and Vector Algo's AI-optimized signals indicate that similar setups have resulted in upward moves.
✅ Bullish Scenario: If BTC holds above the EMA 40 ($81,000) and forms bullish confirmation candles, we could see a move toward previous highs ($96,000) and possibly $100,000+.
❌ Bearish Scenario: A breakdown below $81,000 could lead to further downside towards the 50 SMA ($76,000) and lower demand zones.
Bitcoin remains in a strong uptrend, and the current EMA support test is crucial for trend continuation. Keeping an eye on price action around this zone is key for potential long opportunities!
---------------------------------------------------------------
Enhance, Trade, Grow
---------------------------------------------------------------
Feel free to share your thoughts and insights. Don't forget to like and follow us for more trading ideas and discussions.
Best Regards,
VectorAlgo

Support and resistance: navigating all-time highs with US 30Trading the US30 (Dow Jones Industrial Average) with support and resistance is a powerful strategy, especially when the index approaches or breaks into all-time highs (ATHs). Key support levels often form at previous resistance zones, while psychological price levels (like round numbers) can act as both barriers and breakout points. When US30 reaches new ATHs, traditional resistance no longer exists, so traders must rely on Fibonacci extensions, trendlines, and volume analysis to gauge momentum. Watching price action near key levels and using stop-loss strategies can help manage risk in these uncharted territories. Always stay adaptable—ATH breakouts can lead to explosive rallies, but false breakouts are just as common.

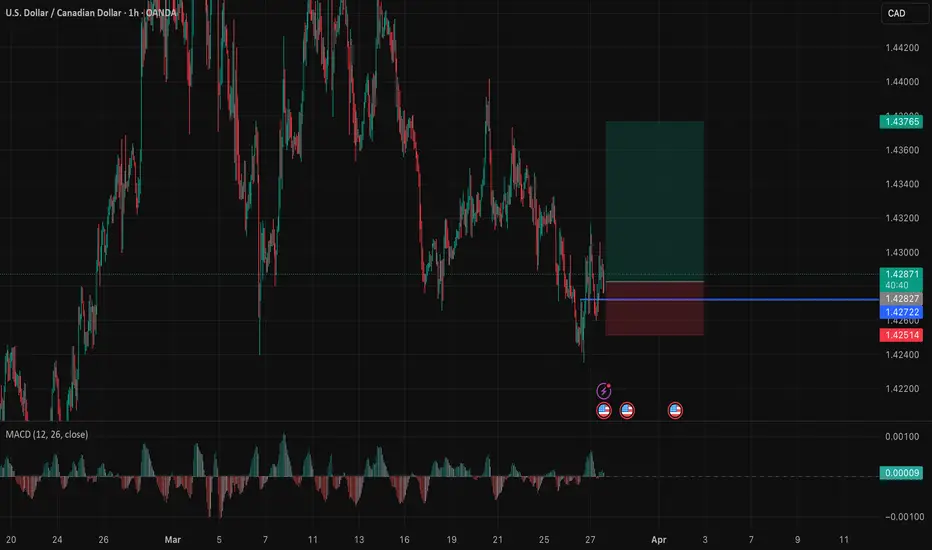
USDCAD 1 hr Chart Long IdeaHello Friends,
USDCAD found support on 4h timeframe and thus gives us opportunity for long positions.
Entry = Market Price
SL = 1.42509
TP = 1.43751
We can break even the position after crossing 1st resistance at 1.43077
Please like, share, and follow for more ideas.
Thanks
GBP/USD Breakdown – Bearish Momentum Ahead?This 4-hour chart of GBP/USD shows a clear bearish setup:
🔹 Rising Wedge Breakdown – The pair has broken below a rising wedge pattern, signaling potential downside pressure.
🔹 Support and Resistance Levels –
Resistance at 1.29206 - 1.30275
Support at 1.28000 - 1.28437
Strong support at 1.27539
🔹 Sell Confirmation – A sell signal is indicated, suggesting further downside movement towards the target zone.
📉 Trading Plan:
✅ Possible short entries below the 1.28956 level.
✅ Target price: 1.27539
✅ Stop-loss above 1.29206 for risk management.
⚠️ Risk Note: Always manage risk properly and watch for any trend reversals before entering trades.
What are your thoughts? Are you bearish or bullish on GBP/USD? 🤔💬

Cardano - Focus On This One Altcoin!Cardano ( CRYPTO:ADAUSD ) will lead the bullish rally:
Click chart above to see the detailed analysis👆🏻
It really seems to be unbelievable but Cardano is 100% repeating the previous cycle which we saw back in 2018. A double bottom neckline breakout, followed by a significant rally and another break and retest and Cardano is now clearly heading towards the previous all time high.
Levels to watch: $0.6, $2.5
Keep your long term vision,
Philip (BasicTrading)

Potentially a good time for LONG MKR/USDHello everyone, let's look at the 1W MKR to USD chart, in this situation we can see how the price created a lower low with the last drop, what is important is that now it goes up creating a new higher local high. What's more, we can see how the ema cross 50 and 200 approached each other, but the price exiting upwards should maintain a long-term upward trend. We can also see how the whole thing is moving in a descending triangle, but an exit from the yellow downward trend line upwards can give a new strong upward movement.
Let's start by defining the goals for the near future that it has to deal with, and here you can see how the price bounced off the first target:
T1 = 1631 USD
T2 = 2159 USD
Т3 = 3015 USD
Т4 = 3607 USD
As for support or potential stop-loss when opening a long, we need to consider a strong support zone from $1028 to $542, with the level around $790 being key, as it is our last lower low in declines.
The RSI and STOCH indicators show an attempt to break out of the local downtrend lines upwards, which may also have a positive impact on the next price movement.

COMP - Shift in Momentum in Action!Hello TradingView Family / Fellow Traders. This is Richard, also known as theSignalyst.
🔹 COMP has been overall bearish trading within the falling channel in red.
However , it is currently rejecting a strong weekly support at $35 - $40.
Moreover, it is clear that the bears are exhausted as the bearish impulse phases are getting more flat.
📈 For the bulls to take over, and shift the momentum in their favor, a break above both trendlines and $50 round number is needed.
📚 Always follow your trading plan regarding entry, risk management, and trade management.
Good luck!
All Strategies Are Good; If Managed Properly!
~Rich

Silver (XAG/USD) Double Top Reversal – Bearish Trading SetupThe provided 1-hour chart for Silver (XAG/USD) presents a well-structured bearish trade setup, highlighting key price action patterns, technical indicators, and confluence factors that suggest a potential downside move. Let's analyze the chart step by step to understand the logic behind this bearish trade setup.
1. Market Structure & Trend Overview
Silver (XAG/USD) has been in a short-term uptrend, as indicated by the ascending trendline. However, the trend now shows signs of exhaustion, with a clear shift in market behavior. The price action reveals the formation of a double top at a strong resistance level, coupled with a Change of Character (CHOCH), which signals a possible reversal.
A break below the trendline suggests that the bullish momentum is losing strength, and sellers are beginning to dominate the market. The combination of these elements makes this setup a high-probability short trade opportunity.
2. Key Technical Levels & Zones
A. Resistance Zone ($33.96 - $34.20) – The Selling Pressure Area
The chart marks a clear resistance zone, where price has struggled to break higher.
Two price rejections from this level indicate that sellers are actively defending this region.
This zone serves as an ideal stop-loss area for short trades, as a breakout above this level would invalidate the bearish setup.
B. Double Top Formation – Reversal Pattern
The price tested the resistance zone twice and failed to establish new highs, forming a double top structure.
A double top is a well-known bearish reversal pattern, indicating a shift from bullish to bearish momentum.
The second top (Top 2) aligns with a downward trendline, further confirming that sellers are stepping in at lower levels.
C. Support Level ($32.60 - $32.80) – Initial Reaction Zone
This area has previously acted as a demand zone where buyers stepped in.
If the price breaks below this support, it would confirm further downside movement towards the final target.
D. Trendline Breakdown – Loss of Bullish Momentum
The dotted trendline represents the previous bullish trend, supporting price action for several days.
A break below this trendline suggests a structural shift in market dynamics, meaning buyers are losing control.
The failure to reclaim the trendline increases the probability of a deeper move downward.
E. Target Level ($32.11 - $32.20) – The Bearish Objective
The projected target is based on the double top’s measured move, which suggests a price drop to at least $32.11.
This level also coincides with previous historical price action, making it a strong confluence zone for profit-taking.
3. Trading Strategy & Execution Plan
📌 Entry Point:
Aggressive Entry: Short position around $33.40 - $33.50, near the second top where price rejected the trendline.
Conservative Entry: Wait for a confirmed break and retest of the support level at $32.80 before entering short.
📌 Stop-Loss Placement:
The stop-loss should be placed above the resistance zone at $33.96.
This level ensures that the trade is invalidated if the price breaks out higher.
📌 Take-Profit Target:
Primary Target: $32.60, which is the first support level where price may temporarily react.
Final Target: $32.11, aligning with the double top breakdown target and historical support.
📌 Risk-Reward Ratio:
A minimum 1:2 risk-reward ratio, meaning for every 1% risked, there is a potential 2%+ gain.
This makes the trade favorable in terms of risk management.
4. Confluence Factors Supporting the Bearish Outlook
✅ Double Top Formation – A classic bearish reversal pattern.
✅ Lower Highs Formation – Indicates increasing selling pressure.
✅ Trendline Breakdown – A significant loss of bullish momentum.
✅ Resistance Zone Rejection – Strong seller presence.
✅ CHOCH (Change of Character) – Confirms a shift in market sentiment.
5. Risk Management & Alternative Scenario
📌 What If Price Moves Against the Trade?
If the price breaks above $33.96, the bearish outlook becomes invalid, and a potential bullish continuation could follow. In this case:
Stop-loss is triggered, and the setup is considered invalid.
Traders should then wait for a new setup before re-entering the market.
📌 Market Conditions to Monitor:
Volatility: Ensure there is enough momentum in the market before entering.
Volume Confirmation: A break below support should have strong volume.
News Events: Watch out for fundamental catalysts, such as US Dollar strength, economic data, and geopolitical events, which could influence Silver’s price movement.
6. Final Thoughts & Summary
This chart setup provides a clear bearish trade opportunity based on technical analysis. The combination of double top formation, resistance rejection, trendline breakdown, and lower highs strongly supports the idea of further downside movement.
💡 Key Takeaways:
Bearish bias is valid as long as price stays below $33.96.
Target is set at $32.11, with an intermediate support at $32.60.
Risk-to-reward is favorable, making it an ideal short trade setup.
If the market follows this expected scenario, this trade has the potential to yield significant profit while maintaining disciplined risk management. However, always stay alert to market conditions and adjust strategies accordingly.

#GOLD ANALYSIS (BEARISH BIAS)🔍 XAU/USD Technical Breakdown – Bearish Setup Ahead?
Gold has been struggling against a key trendline resistance, with a strong supply zone acting as a barrier. The price is currently approaching a critical rejection area ($3,033 - $3,040), aligning with the downward trendline. A potential liquidity grab in this region could trigger a bearish reversal. Always take confirmation before executing your trade.
Expected Price Action:
A rejection from resistance, followed by a lower high formation.
A move towards the $3,010 - 3015 level, with a possible test of liquidity.
Break below could open doors for further downside.
🔴 Stop-Loss: Above the resistance zone.
🟢 Target: Key support around $2,999-$3,010.
Will the bears take control, or will bulls break through? Let’s watch how price reacts! 👀
#XAUUSD 30M Technical Analysis Expected Move.

GBP/USD Technical Analysis – Potential Bearish MoveThis 4-hour GBP/USD chart indicates a potential bearish setup. Price has been trading within a range, with resistance around 1.30366 and support near 1.29467.
The price recently retested the support zone, showing signs of weakness.
If the support level fails to hold, a breakdown could push the price towards the 1.27035 target.
A stronger support level is observed further below, around 1.2600, which could act as a key demand zone.
Traders should monitor the price action near the support zone. A clear rejection could signal a potential buy opportunity, while a confirmed breakdown could validate a short trade targeting lower levels.
Key Levels:
🔹 Resistance: 1.30366
🔹 Support: 1.29467
🔹 Target: 1.27035
Would you like any modifications to the analysis? 🚀

BEAM Trade Setup - Gaming Sector StrengthWith the gaming sector holding strong, BEAM is showing signs of momentum after forming a higher low, signaling a possible upward move.
🛠 Trade Details:
Entry: Around $0.0075 (Support Level)
Take Profit Targets:
$0.0083 (Initial Resistance Zone)
$0.0098 (Breakout Zone)
$0.011 (Major Resistance Target)
Stop Loss: $0.0067
Looking for bullish confirmation before entry. 🎮🚀

(XAU/USD) Bearish Reversal After Head & Shoulders Formation."
Overview:
The price action of Gold (XAU/USD) on the 2-hour timeframe indicates a potential bearish move. A Head & Shoulders pattern has formed, signaling a possible trend reversal. The market recently tested a resistance level and is now showing signs of weakness.
Key Levels:
🔹 Resistance: $3,044 - $3,055 (Rejection Zone)
🔹 Sell Entry: Below $3,028 (Break of Support)
🔹 Support Level: Around $2,980 (First Key Level)
🔹 Target: $2,940 - $2,931 (Final Bearish Target)
Analysis:
✅ Price has broken below the neckline of the Head & Shoulders pattern, confirming a potential sell-off.
✅ A retest of the broken support as resistance could offer a better entry for shorts.
✅ If the price holds below $3,028, further downside toward $2,940 is expected.
✅ Bullish invalidation if price breaks back above $3,044.
Trade Idea:
📉 Sell below: $3,028
🎯 Target: $2,940
🛑 Stop Loss: Above $3,044
This setup aligns with technical analysis principles, with risk-to-reward favoring sellers. Monitor price action for confirmation before entering a trade.
🚀 What’s your view on Gold? Comment below!

ETH at a Make-or-Break Level – What’s Next?🚀 Hey Traders!
If you're getting value from this analysis, smash that 👍 & hit Follow for high-accuracy trade setups that actually deliver! 💹🔥
🚨 ETH Update – Critical Level Ahead!
ETH is currently forming a symmetrical triangle on the 2-week timeframe and is now testing the lower trendline. With 4 days left before the candle closes, this level is crucial! 🔥
📌 What’s next?
✅ If ETH bounces from here, we could see a strong bullish move in the coming days.
❌ Invalidation: A close below $1850 could trigger further downside.
📉 Breakdown or Bounce? What’s your take? Drop your thoughts in the comments! 👇💬
🔔 Follow us for real-time updates and winning trade setups! 🚀

BTC/USD UPDATESIn this forecast we're analyzing 1H time frame for finding the upcoming movement and changes in BTCUSD price. My BIAS for today was Bullish and when price come to my key level area. we'll observe the reaction of price if price give any bullish confirmation then we'll execute our trade. Let's delve deeper into these levels and potential outcomes.
Always use stoploss for your trade.
Always use proper money management and proper risk to reward ratio.
This is just my analysis.
#BTCUSD 1H Technical Analysis Expected Move.

#GOLD BULLISH UPDATESGold Analysis - Bullish Bias for Today.
Currently, I’m analyzing Gold on the 1-hour time frame. As we all know, Gold is at an all time high, with the market pushing upwards without a valid retracement. The overall trend remains bullish, so my bias for today is also bullish based on my analysis.
📍 Key Focus:
I’ll wait for Gold to create a solid structure and retest at least my key levels. This will allow me to place my trade in the ideal demand zone.
✨ Confirmation is Key:
When the price hits my key levels, I’ll look for confirmation through a bullish candlestick pattern or bullish price action before planning my trade.
⚠️ Always Use Stop Loss in Your Trades. ⚠️
📊 Proper Money Management is Key.
💡 Maintain a Solid Risk-to-Reward Ratio.
This is just my analysis. 🔍
Further updates related to this analysis will be shared soon, once the price reaches our key levels. Stay tuned!⏳
🔍 Let’s see what opportunity the market provides.
#XAUUSD 1H Technical Analysis Expected Move.

World Index Shows 5Th Wave Is Still MissingWorld Index ETF with ticker TSX:XWD has extended its rally for 261,8% Fibonacci retracement, which is ideal zone for wave 3, so current slow down can be just a higher degree ABC correction in wave 4. It’s now testing interesting and important textbook support at the former wave 4 swing low and 38,2% Fibonacci support area, from where we may see a bullish resumption for wave 5 this year. Invalidation level is at 90.

Bitcoin (BTC/USD) – Bullish Breakout in Progress📈 Chart Pattern:
Bitcoin has been trading inside a descending channel for several weeks. Recently, BTC has broken out of the channel’s upper boundary, indicating a potential shift in momentum.
🔹 Key Levels:
Support: $80,043.75 (Critical stop-loss level)
Resistance: $87,500 (Short-term)
Target: $92,944.17 (Upside projection)
📊 Trading Plan:
BTC might retest the breakout zone before continuing the upward move.
A confirmed higher low formation could signal strong bullish momentum.
If BTC remains above $85,500, further upside toward $92,944.17 is possible.
⚠️ Risk Management:
If BTC drops below $80,043.75, the bullish setup could become invalid.
Traders should wait for confirmation before entering long positions.
💡 Conclusion:
This breakout could lead to a strong uptrend, but traders should watch for a successful retest before making a move. 🚀🔍

Trading in a Parallel Channel on Monthly TF.Trading in a Parallel Channel on Monthly TF.
Strong Support around 49 - 50 & then 54.
However, 53.20 if SUstained on Weekly
basis, may give further upside around 57 - 58
To be in Uptrend, it should cross 61 - 62. &
Don't Forget the Channel Top is around 75 - 77
On the flip side, 46 is the last level that should
not break.

Will THETA return to an upward trend?Hello everyone, I invite you to review the current situation on Theta Token. When we enter the one-day interval, we can see how the price moved in the formed downtrend channel. What's more, we can see here the movement at the lower border of the channel and how the price maintains a strong support at the level of $ 0.90, however, if we go lower, just below the channel border, a very strong support zone for the price from $ 0.69 to $ 0.42 is visible.
We can also see how the price enters a slight sideways trend in which it can approach the downtrend line lasting inside the downtrend channel, such consolidation and gathering of energy can have a positive impact on the movement in the coming weeks, which can lead to growth. When such a scenario works, we can see a nice upward movement around $ 1.36, another significant resistance can be seen at $ 1.75, and then we have strong resistance around $ 2.36.
It is worth paying attention to the MACD indicator here, which shows how we are staying in the lower range and the ongoing movement is visible here, which may also indicate a potential attempt to rebound the price.

GBPUSD Week 12 Swing Zone/LevelsA new trading week begins.
The swing zone and projected paths are set.
Trades will be guided by price action.
