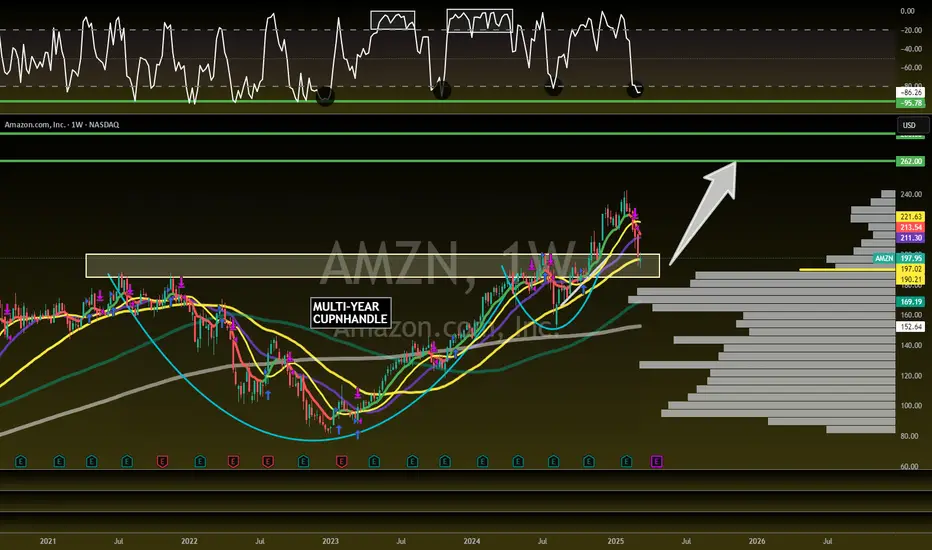
Amazon is about to DELIVER! 32% UpsideNASDAQ:AMZN
Great Risk/Reward here!
Confirmation of Retest = 🎯$262
- Right at CupnHandle Retest area
- Volume Shelf Support
- 50WMA
- Wr% Green Support Beam
Not financial advice
Support
Short setup on SPX (x2)After the most recent upward move, the SPX shows clear signs of weakness, suggesting a potential short setup.
Since mid-July, the SPX has been moving upward and it's now near its all-time high. However, the RSI Exhaustion at the bottom of the chart has significantly declined and hasn't recovered much, establishing a downtrend.
This divergence between the price and the RSI Exhaustion is the first major signal of a possible short configuration.
Three additional signs support this setup:
The RSI Exhaustion shows recent bullish exhaustion (indicated in green), signaling that further price increases are unlikely.
The price has formed a top just shy of its all-time high, as identified by the Bottoms Tops Signal indicator.
A major level has formed, as indicated by the Levels and Zones indicator. While this level turned into support, it originated as resistance and could well revert back to it should be price start to drop further.
Is the bull run over? Only time will tell, but for now, it's crucial to remain patient and always seek confirmation from the indicators.

#AI16ZUSDT is setting up for a breakout📉 Long BYBIT:AI16ZUSDT.P from $0,2037
🛡 Stop loss $0,1985
1h Timeframe
⚡ Plan:
➡️ Waiting for consolidation near resistance and increased buying activity before the breakout.
➡️ Expecting an impulsive upward move as buy orders accumulate.
🎯 TP Targets:
💎 TP 1: $0,2072
💎 TP 2: $0,2100
💎 TP 3: $0,2125
🚀 BYBIT:AI16ZUSDT.P is setting up for a breakout — preparing for an upward move!

Chart is crystal clear. Reaction on divergence at support.All liquidity on the upperside are left open. No reason to not go down while these are open.

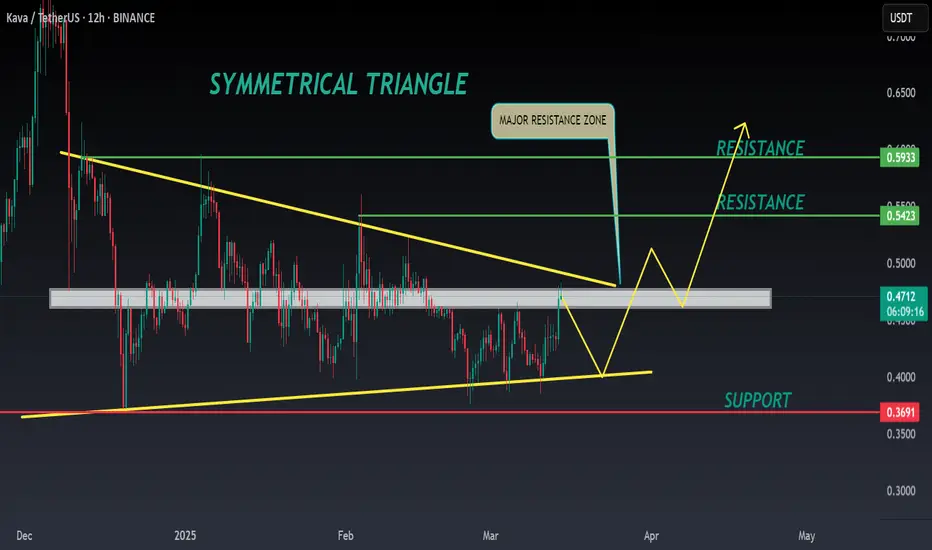
KAVA ANALYSIS🔮 #KAVA Analysis
💲💲 #KAVA is trading in a Symmetrical Triangle Pattern. If the price of #KAVA breaks and sustain the higher price then will see a pump. Also there is an instant strong support zone. We may see a retest towards the support zone first and then a reversal📈
⁉️ What to do?
- We have marked crucial levels in the chart . We can trade according to the chart and make some profits. 🚀
#KAVA #Cryptocurrency #Support #Resistance #DYOR
$4 to $16 with power hour making +60% run $10 to $16It was consolidating for 4 hours after morning news that investor or group purchased at least 5% stake in the company and filled with SEC. This made the stock pop to +150% on the day as traders speculated it could be a big reputable firm or individual so they want to be in as well. After strong support it moved further to +300% area total on the day and I warned everyone on time to get ready for $10 and $11 buys for the vertical new highs.
Last hour brought easy money NASDAQ:RGC

BNB/USDT 1DHello everyone, let's look at the 1D BNB chart to USDT, in this situation we can see how the price moves in the local triangle in which we approach the moment we leave and try to take the direction of further movement.
However, let's start by defining goals for the near future the price must face:
T1 = $ 595
T2 = $ 649
Т3 = 690 $.
T4 = $ 738
Let's go to Stop-Loss now in case of further declines on the market:
SL1 = $ 562
SL2 = $ 527
SL3 = = $ 474
SL4 = 436 $
Looking at the MACD indicator, you can see the traffic in the downward trend, but here you can see an attempt to change the direction and after

Ethereum - Watch This Massive Support!Ethereum ( CRYPTO:ETHUSD ) is weak but testing strong support:
Click chart above to see the detailed analysis👆🏻
The entire crypto market is currently not able to stop the bleeding and also Ethereum just dropped another -20% over the past three days. It might seem like a horrible scenario but overall Ethereum is still in a bullish market. Just watch the final confluence of support now.
Levels to watch: $2.000, $4.000
Keep your long term vision,
Philip (BasicTrading)

USDCAD Trade Idea (1H Chart Analysis)**USDCAD Trade Idea (1H Chart Analysis)**
**Market Structure:**
- The price is in a **downtrend** on the 1H chart, with lower highs and lower lows forming.
- It is currently testing a **key support level** around **1.4350**.
- The **50 EMA (black line) is above the price**, confirming bearish momentum.
- The recent candles show **decreasing volume**, indicating possible consolidation before the next move.
**Trade Plan**
**Scenario 1: Bearish Breakdown (Sell Trade)**
📉 **Entry:** Below **1.4350**, after a strong bearish candle closes.
🎯 **Target 1:** **1.4320** (previous minor support)
🎯 **Target 2:** **1.4280** (stronger support zone)
🛑 **Stop Loss:** **1.4375** (above recent lower high)
📊 **Risk-to-Reward Ratio:** 1:2 or better
**Confirmation:** If price breaks 1.4350 with strong volume, it signals continuation of the downtrend.
**Scenario 2: Bullish Reversal (Buy Trade)**
📈 **Entry:** If price **bounces from 1.4350** and forms a strong bullish engulfing candle.
🎯 **Target 1:** **1.4395** (previous resistance)
🎯 **Target 2:** **1.4415-1.4420** (major resistance zone)
🛑 **Stop Loss:** **1.4335** (below recent low)
📊 **Risk-to-Reward Ratio:** 1:2
**Confirmation:** A strong rejection from 1.4350 with bullish volume indicates potential reversal.
**Final Thoughts**
- **Bias:** Bearish unless we see a clear reversal signal at 1.4350.
- **Watch for a breakout or bounce at key levels before entering.**
- **Always use risk management** – never risk more than 1-2% per trade!

MOVE Price Analysis: Key Levels & Potential ScenariosCurrent Market Structure
Since mid-February, MOVE has been consolidating, with a critical support level forming around $0.4371.
This level aligns with a bullish daily gap and the midpoint of a previous candle tail, making it a key area to watch for a potential retest.
Following the mainnet launch, a "sell the news" reaction may test this support level before determining the next directional move.
Downside Risk: Key Support Levels
If $0.4371 support fails, there is minimal historical support below, making a drop more probable.
Possible profit-taking zones include:
$0.3705 (near bulls' stop levels)
$0.3500 (a major psychological support level)
Upside Potential: Resistance Levels to Watch
If MOVE rebounds off support and breaks above $0.4980 (previous rejection zone), the next bullish targets include:
$0.5573 (first major resistance level)
$0.5820 (historical rejection zone)
Conclusion & Strategy
Bullish Scenario: A strong bounce from $0.4371 could lead to a push toward $0.4980 and potentially $0.5573 if buying pressure sustains.
Bearish Scenario: A break below $0.4371 could accelerate losses toward $0.3705-$0.3500, where buyers may attempt to step in.
Key Watchpoint: How the price reacts at $0.4371 will dictate the next significant move. If it holds, bulls regain control; if it fails, further downside is likely.

BTCUSDT Major supports and resistances after FallWe were expecting this fall from 108K$ and now most of target almost hit:
Now we can expect maybe some range here for a while near 77K$ support zone and soon after that more fall is also expected or if the red trendline break to the upside then market is again bullish.
Major supports now:
A. 78000$
B. 72000$
C. 69000$
Major Resistances now:
A. 85000$
B. 89000$
C. 93000$
DISCLAIMER: ((trade based on your own decision))
<<press like👍 if you enjoy💚

Double BottomDouble bottom with Bullish Divergence
Immediate Targets around 43 - 45
Support is around 39 - 39.50
Should not Break 37.50

ETH/USD 1D Chart ReviewHey everyone, let's look at the 1D ETH to USD chart, in this situation we can see how the price has reverted back to the long-standing uptrend, and here we can see a significant decline below the uptrend line.
In the event that the trend reverses and growth begins again, it is worth setting targets for the near future that the price must face:
T1 = 2246 USD
T2 = 2533 USD
Т3 = 2785 USD
Т4 = 3010 USD
Т5 = 3365 USD
However, here we can see how the current decline has been maintained by the support zone from $ 1904 to $ 1686, however, if the zone is broken further, we can see a decline to the level of $ 1338, and then again we can have the price go down to the area of $ 921
The RSI indicator shows a continuing downward trend, and here we can see a decline to the lower part of the range, but there is still room for the price to go lower to the lower limit.

[LONG] STX - STACKS on support and ready for a bounceSTX is another beaten up coin that this year alone lost more than 60% of it's already beaten up marketcap. From the peak on April of 2024 to January of this year STX was already down 50%. Bulls got completely obliterated, but not everything is lost for STACKS: Sitting at $0.75 is now testing (and holding) for second time the previous 2023 resistance, now turned support. A bounce here doesn't immediately mean the end of the fall, but we can catch a good counter-trend move to retest the distribution zone on the $1.44 to $2.00 range
1st Entry: $0.75 (previous resistance, now support)
2nd Entry: $0.65 (most traded zone)
move SL to Break even if price breaks the previous high at $1.00
1st TP: $1.34
2nd TP: around $1.80 or look for signs of weakness in lower timeframes at this area

Will BTC drop to further supports?Hello everyone, I invite you to review the current situation on BTC. When we enter the one-day interval, we can see how the BTC price is moving under the local downtrend line. What's more, we can see here how we broke the uptrend line at the bottom, but we are still above the main uptrend line.
Currently, we can see how the price is based on support at $ 79,339, but if we leave this support at the bottom, we still have strong support at $ 72,294, which is located at the golden FIB point 0.618, under it we can see the main trend line passing and then support at $ 62,217.
Looking the other way, in a situation when the trend reverses, we can expect resistance at $ 85,562, then resistance is visible at $ 90,843, the next significant resistance is at $ 97,888, behind which we already have a very strong resistance zone from $ 103,060 to $ 109,481.
On the MACD indicator, we can observe the continuation of the ongoing downward trend, in which at the moment there is no signal for the price to return. However, it is worth looking at the EMA Cross 50/200 indicator here, which, despite a strong decline, still maintains an upward trend, which may have a positive impact on the price in the coming weeks.

GBPUSD Week 11 Swing Zone/LevelsLast week marked the first losing week of the year.
With a strong upward trend, a price pullback is expected.
By using tight stop losses and effective trade management, we keep losses small while aiming for larger gains. To achieve this, the stop loss is moved to break even once the price gains 20 pips.
a or b? Only price can tell

BTC - Get Ready!🚨 CRYPTOCAP:BTC is dipping hard! 🚨
📉 Get ready for a massive entry at $72,000—here’s why:
It aligns with:
1️⃣ Lower bound of the blue wedge pattern
2️⃣ Previous resistance turned support
3️⃣ Key demand zone
4️⃣ -34% correction phase
📊 This level could be a game-changer! Are you buying?

GOLD UPDATE ROUTE MAPI am currently analyzing the 4-hour timeframe of gold. As we know, there has been strong bearish pressure in the gold market over the past few days. Therefore, my focus will remain on bearish opportunities. On the higher timeframe, gold has broken its bullish trendline, and my selling area will be around this level, as seen on the chart. I will wait for the price to reach my key levels and either show bearish confirmation or any reversal signal so that I can plan my sell entry at my ideal level. Confirmation is very important. Let's see what happens.
Always use stoploss for your trade.
Always use proper money management and proper risk to reward ratio.
This is just my analysis or prediction. Let's analyze more deeply in smaller time frame.
#XAUUSD 4H Technical Analysis Expected Move.

Bullish Divergence on Monthly TF.Bullish Divergence on Monthly TF.
However, a Very Strong Resistance is around
44 - 45.
39.50 - 40 may act as a Daily Support Level but
it resisted twice from 42.
34.50 - 36.50 seems to be a Strong Support which
is also a Confluence area of 2 Important Tools.

Important Support level159 - 163 would be a Very Good Support Level
as this Support is of Monthly TF. So Patient Traders /
Investors may wait for this level; which seems bit
difficult (as of now) due to Bullish Divergence on
Shorter TF.
180 - 185 is an Important Resistance.

TTD at multi month supportTTD has been beat to pieces the past month. However we have just reached a multi month support which could present a short term bounce

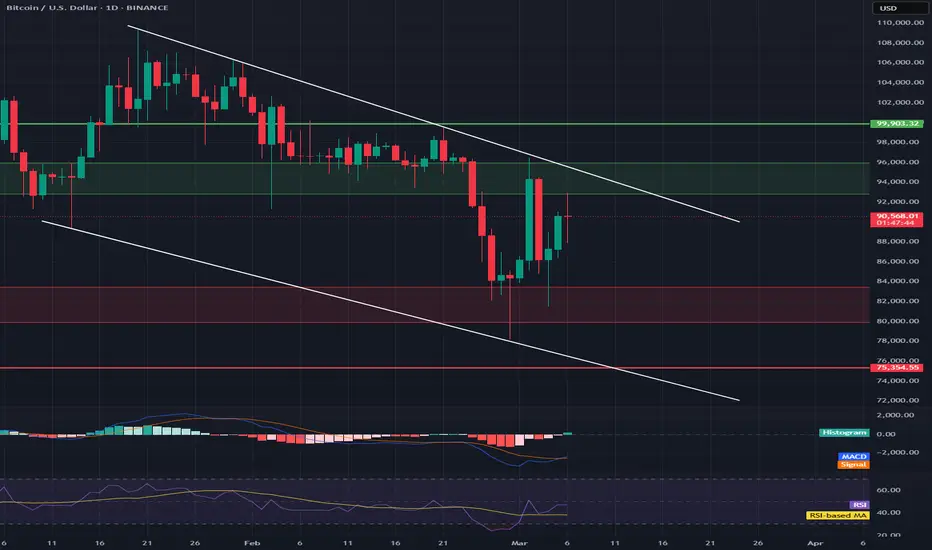
BTC/USD 1D Chart ReviewHello everyone, I invite you to review the current situation on BTC. When we enter the one-day interval, we can see how the BTC price is moving in the formed downtrend channel in which we are again approaching its upper limit.
Here you can see how the current rebound has approached the resistance zone from $ 92,851 to $ 95,975, which the price cannot break through, only when we exit it upwards will the path open towards resistance at $ 99,903.
Looking the other way, we can see that in the first place we have a significant support zone from $ 93,477 to $ 79,907, which currently manages to keep the price from larger declines. However, when the zone is broken, we can see the price going down to the level of $ 75,354.
On the MACD indicator we can observe a fight to return to the upward trend in which we have a lot of room for price increases, while on the RSI indicator we are approaching the middle of the range which still gives room for growth, however, at this level we could previously see a reaction, which is something to watch out for.
Bitcoin - 200 EMA is holding Strong#BTC #Analysis
Description
---------------------------------------------------------------
+ Bitcoin has successfully tested the 200 EMA line and rebounded effectively.
+ However, caution is still advised, as the price may revisit the EMA support line.
+ The strong performance of the EMA is a positive indicator, suggesting the bullish trend could persist after a few retests.
---------------------------------------------------------------
Enhance, Trade, Grow
---------------------------------------------------------------
Feel free to share your thoughts and insights. Don't forget to like and follow us for more trading ideas and discussions.
Best Regards,
VectorAlgo
