AUDJPY - let's do it again!Hello TradingView Family / Fellow Traders. This is Richard, also known as theSignalyst.
As per our last AUDJPY analysis (attached on the chart), it rejected the first blue circle zone and surged in a parabolic manner.
📈AUDJPY is currently retesting the intersection of the blue trendline and red support.
📚 As per my trading style:
As #AUDJPY is around the latest blue circle zone, I will be looking for bullish reversal setups (like a double bottom pattern, trendline break , and so on...)
📚 Always follow your trading plan regarding entry, risk management, and trade management.
Good luck!
All Strategies Are Good; If Managed Properly!
~Rich
Disclosure: I am part of Trade Nation's Influencer program and receive a monthly fee for using their TradingView charts in my analysis.
Support

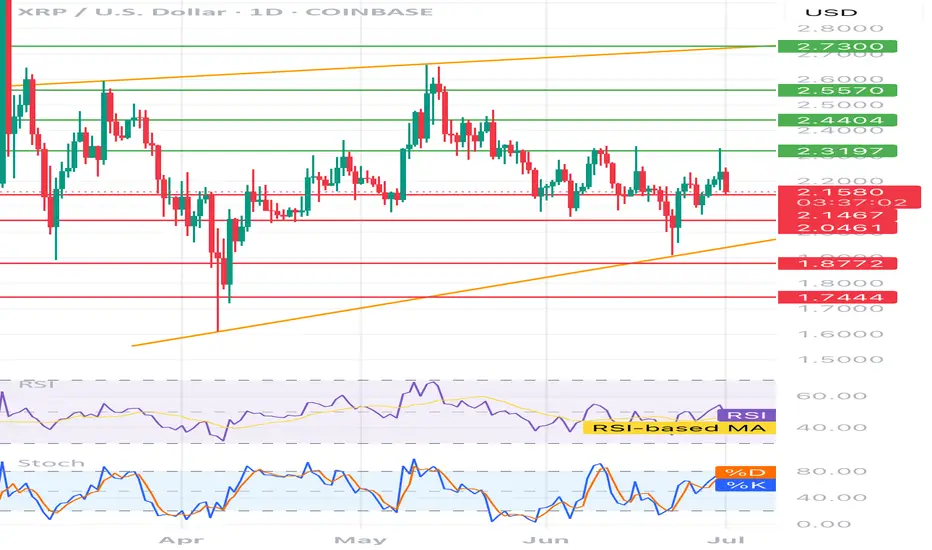
XRP/USD – Technical Analysis (1D)📊 XRP/USD – Technical Analysis (1D)
Current Price:
• Buy: 2.1554 USD
• Sell: 2.1553 USD
⸻
🧭 Trend & Structure
• Price is moving within a rising channel (orange lines).
• It’s currently trading closer to the lower trendline, suggesting potential support.
Resistance Levels (green lines):
• 2.3197
• 2.4404
• 2.5570
• 2.7300 (channel top)
Support Levels (red lines):
• 2.1467
• 2.0461
• 1.8772
• 1.7444 (key support)
⸻
📈 Indicators
RSI (Relative Strength Index)
• Hovering around the 50 level → neutral momentum.
• No strong divergence observed – RSI is moving with price.
Stochastic Oscillator
• %K has crossed %D upward → short-term bullish signal.
• Nearing the overbought zone (above 80) → a pullback could occur soon.
⸻
📌 Interpretation
• Price is testing the 2.15–2.16 zone, which has acted as both support and resistance in the past.
• A break above 2.32 could open the door toward 2.44 and 2.55 USD.
• A drop below 2.04 USD could lead to retesting 1.87 or even 1.74 USD.
• Overall trend: neutral to bullish, supported by the rising channel.
🎯 Trading Ideas
• Long Entry: Break and close above 2.32 USD with volume → targets: 2.44 / 2.55
• Short Entry: Breakdown below 2.04 USD → targets: 1.87 / 1.74
XMR Long Swing Setup – 50% Retrace with Structure ShiftXMR rallied from $200 to $400 and has now pulled back 50% of that move. With price reclaiming the 20-day SMA and a recent structure shift, there’s a solid setup forming with ~60% probability of continuation.
📌 Trade Setup:
• Entry Zone: $305 – $315
• Take Profit Targets:
o 🥇 $360
o 🥈 $400
• Stop Loss: Daily close below $300

WLDUSDT – Bullish Setup Unfolding!Hey Traders — if you're into high-conviction setups with real momentum, this one’s for you.
WLD is breaking out from a well-defined falling wedge pattern on the 4H chart — a classic bullish structure. Currently retesting the breakout zone while holding the green demand box like a champ. 📈
💥 Entry Zone:
$0.87 – $0.91 (accumulate inside the green box)
🎯 Targets:
• $1.08
• $1.28
• $1.45
• $1.58
🛑 Stop Loss:
$0.81 (below the wedge + demand zone)
Looks poised for a strong move. As always, use proper risk management and watch for volume confirmation.
Let’s see how this plays out — bullish structure, solid risk-reward!

silver head and shoulder pattern price breakout in first week of june then sideways entire month
during same time gold was selling off below $3430 resistance and fed was very hawkish on stagflation
if buyers stopped buying and seller come in then price can breakdown then neckline of pattern

BNB/USDT 1D🕵️♂️ General context
• Steam: BNB/USDT
• Price: 649.52 USDT
• Time: 1D (daily interval)
• Currently, the reflection is underway after the inheritance, but the technical situation remains uncertain.
⸻
📈 Trend and market structure
• You can see a previous strong drop (visible long red candles).
• Currently, reflection is underway to the level of technical resistance (approx. 650–672 USDT).
• A medium -term inheritance trend is still in force - marked with an orange interrupted line of decreasing (inheritance) trend.
⸻
📊 Technical levels
🔹 Opora (green levels):
1. 651.01 USDT - the first tested resistance (current price right next to it).
2. 672.68 USDT - another resistance, above SMA (2), historically strong level of sales.
3. 700.81 USDT - strong psychological and technical level, tested in the past.
🔻 Support (red levels):
1. 636.40 USDT - short -term support (price maintaining just above this level).
2. 625.65 USDT - key support - if it is broken, a possible test of lower levels.
3. 607.62 and 595.27 USDT - subsequent support, where purchases appeared earlier (Long Knoty).
⸻
📉 Technical indicators
🔵 MacD
• Histogram comes out of red - a potential signal of Momentum change to upward.
• The MacD line begins to turn up to the signal line - possible Bullly Crossover soon (buy signal).
🟣 RSI
• RSI oscillates around line 40-50-it is a neutral zone with a slight tilt down, but RSI-Based has a possible reflection.
• Lack of purchase or sale - suggests that traffic can go both ways.
⸻
🔃 Medium walking (SMAS)
• The price is tested by several medium (green, red, blue line):
• SMA (1) and SMA (5) are similar and flat - no clear short -term trend.
• SMA (2) acts as a strong resistance at 672 USDT.
• Need to break out over 672.68 to recognize that the trend can turn around.
⸻
✅ Applications - technical scenarios
🔼 Bullish (upward) scenario:
• Crossing the level 651–672 USDT and closing the daily candle above.
• Confirmation by RSI> 50 and MacD crossover.
• Target: 700–710 USDT.
🔽 Bearish (inheritance) scenario:
• Price rejection with current resistance and descent below 636 → 625 USDT.
• If 625 falls, a possible drop in around 607/595 USDT.
• RSI may then fall into the sale zone.
⸻
🧠 Neutral / swing strategy
• Currently, the market in potential consolidation between 625 and 672 USDT.
• You can consider:
• Buying at the lower consolidation limit (625–636) with a stop-loss below 620.
• Short or Take Profit at the upper limit (670+) until it breaks out.

SOL/USD🔹 Trend direction
Current short-term trend: down
Price below key moving averages:
SMA50 (green) ≈ 154.84
SMA200 (blue) ≈ 168.79
Price ≈ 142.49 – below both, confirming weakness.
🔹 Supports and resistances (key levels)
✅ Supports:
142.00–143.50 – current level where price is struggling (multiple price reactions).
131.00 – strong support, last low (June 18).
119.00 / 116.00 / 113.00 – next supports from previous consolidations.
95.61 – deep support if market breaks down.
❌ Resistances:
148.00–150.00 – local resistance, coinciding with the red SMA (short-term resistance).
154.84 – resistance (SMA50).
162.00 – resistance (SMA200).
183.00 – main resistance from the May peak.
218.55 – very strong resistance from March.
🔹 Technical indicators
📉 MACD:
MACD line < signal, negative histogram → bearish signal.
No signs of bullish strength.
📉 RSI:
RSI ≈ 41.31 – close to the oversold zone, but not there yet (below 30).
RSI trend also downward.
🔹 Formations and trend lines
Broken support line after the April-May bullish structure (white trend line).
The previous bearish trend line (yellow) was broken in April, but the momentum did not hold.
A lower high and lower low may be forming now – a classic bearish structure.
🔹 Potential scenarios
🔻 Bearish:
Breakout of 142 → test of 131 → possible drop to 119/116.
Staying below SMA50 and MACD still negative = high chance of continuing declines.
🔼 Bullish:
Recovery of 148–150 needed → only then a chance to test 154 and SMA50.
RSI close to oversold = possible local technical bounce, but not reversing the trend.
📌 Conclusions / Summary
General trend: Bearish (down).
Sentiment: Negative, no confirmed signals of strength.
If level 142 breaks - next test will be at 131.
A strong breakout above 150-154 is needed to talk about a change in structure.

INJ Long Swing Setup – Breakout Retest Opportunity at Key LevelIf the crypto market pushes higher and INJ flips current resistance into support, we’ll be looking to enter on a retest of the $11.60 zone. This level could act as a launchpad for the next leg up.
📌 Trade Setup:
• Entry Zone: $11.60 – $11.60 (Breakout Retest)
• Take Profit Targets:
o 🥇 $14.20 – $16.25
o 🥈 $19.80 – $23.00
• Stop Loss: Daily close below $10.70

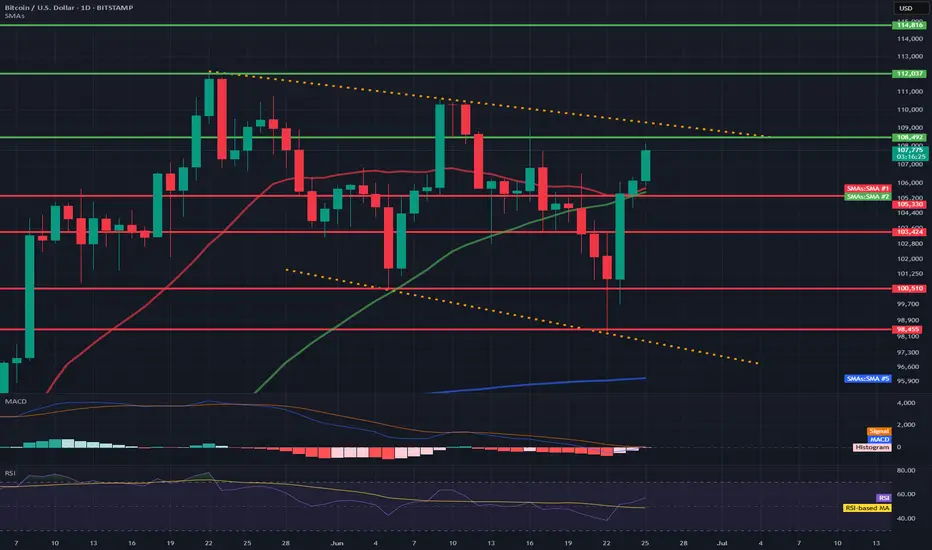
BTC/USD 1D Chart📊 1. Technical formation: Downtrend channel marked with orange lines
Upper trend line (resistance): ~108,200 – 110,000 USD
Lower trend line (support): ~98,455 – 97,000 USD
➡️ Such a formation usually ends with a breakout. The direction of the breakout will be key – currently, the price is testing the upper resistance line.
💵 2. Support and resistance levels
📈 Resistance:
108.202 – currently tested
112.037 – psychological level
114.816 – local top
📉 Support:
105.300 – SMA 50 + local support
103.424 – local lows
100.510 – key psychological support
98.455 – lower edge of the triangle
📉 3. Moving averages (SMA)
SMA 50 (green): currently as dynamic support (~105.300)
SMA 200 (blue): far below the price (~96.000), inactive in the short term
SMA 20 (red): price broke through it upwards – a signal of bullish strength
➡️ A bullish crossover took place between SMA 20 and SMA 50 → bullish signal.
📉 4. MACD (Momentum)
MACD line is approaching the intersection with the signal line from below.
The histogram is becoming less and less red → a potential intersection and a bullish crossover signal may occur any day now.
📉 5. RSI (Relative Strength Index)
Currently: 57.19
RSI is rising and approaching the overbought zone (70), but it is not overheated yet.
Exceeding 60 would be a signal of further bullish strength.
🔍 6. Volume and context
There is no volume marking on the candles, but:
The current bullish candle is strong and breaks through the key averages (SMA 20, 50).
This indicates buyer activity with technical support.
🟢 Bullish scenario (if a breakout occurs up)
A breakout above 108.200 with a close of the daily candle could open the way to:
112.037 (next resistance)
then even 114.816
🔴 Bearish scenario (false breakout)
A rejection from 108.200 and a drop below 105.300 → a possible return to:
103.424 or even 98.455 (lower triangle line)
Silver Long Setup–Breakout Retest After Clearing Key ResistanceSilver TVC:SILVER has broken above the $34.50 resistance level, as it looks to catch up to the gold/silver ratio. We’re now watching for a retest of this breakout zone at $34.00–$34.50 for a potential long spot entry.
📌 Trade Setup:
• Entry Zone: $34.00 – $34.50
• Take Profit Targets:
o 🥇 $37.50 – $40.00
o 🥈 $44.00 – $48.00
• Stop Loss: Daily close below $33.00

ONDOUSDT – POTENTIAL BREAKOUT TRADE SETUP!Hey Traders — if you're into high-conviction setups with real momentum, this one’s for you.
ONDO is trading inside a falling wedge on the daily chart — a classic bullish structure that often leads to explosive breakouts. 📈
Accumulation Zone: Price is currently sitting inside the green support box, which has held strong multiple times. This makes it a good area to start accumulating before a potential breakout.
🚀 Breakout not confirmed yet, but structure looks promising. A breakout above the wedge will be the confirmation trigger.
📌 Trade Setup:
✅ Entry (Spot Accumulation): $0.73–$0.78
🎯 Targets after breakout: $1.10 / $1.45 / $2.05
🛑 Stop-loss: $0.58
📈 Bias: Bullish on breakout
🔸 Monitor for a clean breakout candle + volume above the wedge.
🔸 Manage position sizing while accumulating in the zone.
Let’s see if history repeats and ONDO gives us a strong breakout move.

Uber (UBER, 1W) Tightening Structure Ready for BreakoutOn the weekly chart, UBER has formed a strong ascending wedge / tightening channel, showing clear higher lows and repeated rejections near upper resistance. The price is now approaching the apex of the pattern, with a possible breakout setup above $82.42.
If confirmed, the projected measured move (H = $27.67) aligns with Fibonacci extension targets at:
– $89.86 (1.272)
– $93.74 (1.414)
– $99.32 (1.618)
Technical structure:
– Price held support twice, confirming bullish intent
– Structure tightening — breakout likely on sustained volume
– Bullish divergence forming on the weekly stochastic oscillator
– A breakout above $82.42 activates the next impulse wave
– Volume is stable, with no signs of heavy distribution
Fundamentals:
Uber has reached a major financial milestone: consistent profitability and positive EBITDA growth. The company continues to expand across mobility and delivery, with a focus on cost efficiency, platform monetization, and retention. Increased user activity and growing institutional interest support a bullish mid-term thesis. Uber is increasingly seen as a core holding in next-gen tech and services portfolios.
The technical structure is approaching resolution. A confirmed breakout above $82.42 opens the door for a move to $89.86 → $93.74 → $99.32. With bullish structure and improving fundamentals, Uber is positioned for the next leg higher. This is a setup worth watching.

SUI - Only way is up.BINANCE:SUIUSDT (1W CHART) Technical Analysis Update
SUI is currently trading at $2.77and showing overall bullish sentiment
Price has touches the trending support and managed to bounce back from the support, this is a good sign. I see a good opportunity for long trade here with a decent stoploss.
Entry level: $ 2.77
Stop Loss Level: $ 1.77
TakeProfit 1: $ 3.6997
TakeProfit 2: $ 4.2126
TakeProfit 3: $ 5.7785
TakeProfit 4: $ 9.5494
TakeProfit 5: $ 14.1762
Max Leverage: 5x
Position Size: 1% of capital
Remember to set your stop loss.
Follow our TradingView account for more technical analysis updates. | Like, share, and comment your thoughts.
Cheers
GreenCrypto

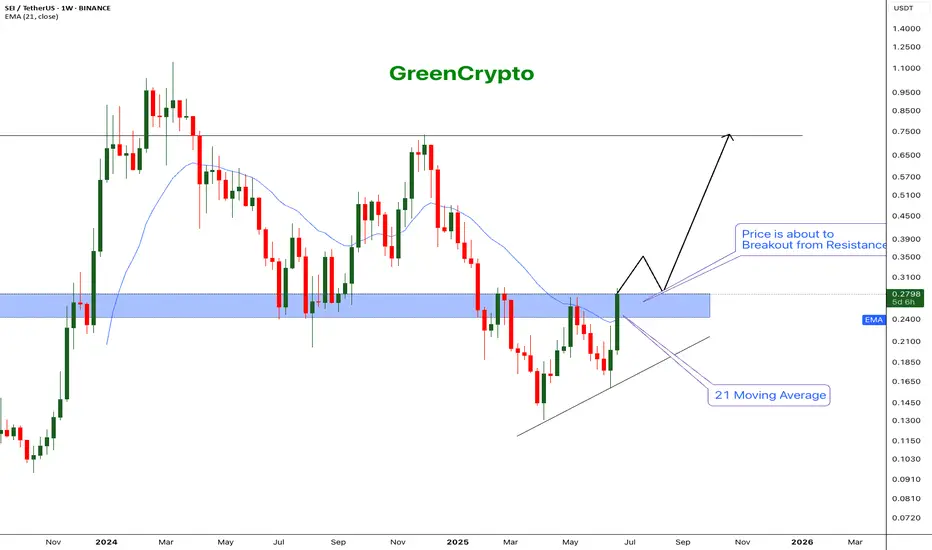
SEI - The next big runner$BINANCE:SEI/USDT (1W CHART) Technical Analysis Update
SEI is currently trading at $0.2785 and showing overall bullish sentiment
Price successfully breached the 21 EMA and now price is trading near one of the major resistance zone.
If the weekly candles closes above the resistance then we can expect further bullish momentum.
I'm expecting the price to easily break the resistance and hit the next major resistanc e around 0.75
Entry: After close above resistance (0.285)
StopLoss: 0.18
TakeProfit 1: 0.3506
TakeProfit 2: 0.4962
TakeProfit 3: 0.7367
Don't forget to keep stoploss!
Follow our TradingView account for more technical analysis updates. | Like, share, and comment your thoughts.
Cheers
GreenCrypto
Gold Trading Strategy June 23The last two D1 candles have continuously drawn out the wicks. The Sellers may no longer be interested in dominating the market.
Currently, Gold is moving sideways in a wide range. 3345 and 3375 are the two Breakout zones of the gold price in today's trading day. When breaking out of the breakout zone, the price will continue its strong trend. Limit trading against the trend when the price breaks out.
Trading signals may also appear if there is confirmation from the candle that does not break out of this breakout zone.
Resistance and support zones remain the same as last week.
Resistance 3400-3415-3443
Support 3322-3296
Break out: 3375-3345
Recommended good trading signals
SELL 3399-3401 Stoploss 3405
BUY 3322-3320 Stoploss 3306

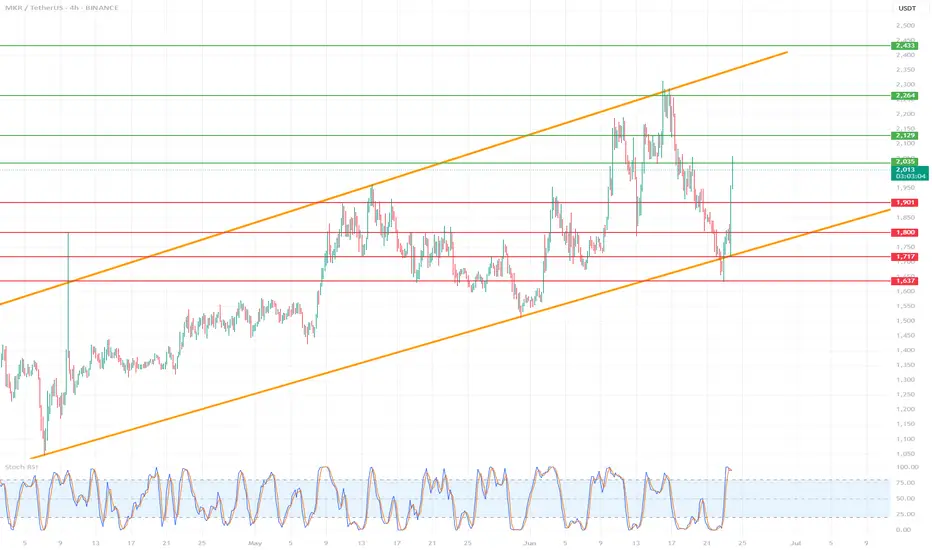
MKR/USDT (MakerDAO) on the 4H time frame🔷 1. Trend and market structure
🔸 Upward channel:
The price is moving in a wide, ascending channel (orange lines).
The lower line of the channel was last tested on June 22, 2025, which ended with a dynamic upward bounce.
The upper limit of the channel reaches around 2,450 USDT.
🕸️ Market phase:
In the short term, the market was in a downward correction phase within the uptrend.
Currently, we see a strong rebound from support - a new uptrend is possible.
🔷 2. Key horizontal levels (support/resistance)
🟥 Support:
1,637 USDT - local support (the lowest level of the red zone), almost tested at the bottom.
1,717 USDT - very technical support, tested several times.
1,800 USDT – psychological level and local consolidation.
1,901 USDT – last support peak, currently broken upwards.
🟩 Resistances:
2,003 USDT – current price level, currently tested as new resistance.
2,129 USDT – strong resistance from previous peaks.
2,264 USDT – previous swing high.
2,433 USDT – upper boundary of the channel and technical level from historical peaks.
🔷 3. Price and candle behavior
Strong demand reaction at the lower boundary of the channel: long pin bar/bull's embrace at the lower boundary.
The upward movement was dynamic and uniform, which indicates high buyer activity.
If the price stays above 1,901 USDT – further increases are possible.
🔷 4. Technical indicators
🔁 Stochastic RSI (4H):
Currently in the overbought zone, just below the level of 100 - a temporary correction or consolidation may occur.
However, with a strong upward trend, Stoch RSI may "stick" to the upper band - it does not yet give a clear S/S signal.
🔷 5. Technical scenarios
🟢 Bullish scenario (continuation of growth):
Condition: maintaining the level above 1,901 USDT.
Targets:
TP1: 2,129 USDT
TP2: 2,264 USDT
TP3: 2,433 USDT (upper limit of the channel)
Stop-loss: below 1,800 USDT
🔴 Bearish scenario (rejection of resistance):
Condition: strong rejection of 2,003 USDT and return below 1,901
Targets:
TP1: 1,800 USDT
TP2: 1,717 USDT
TP3: 1,637 USDT
SL: return above 2,003 USDT
🔷 6. Final remarks
The current upward movement looks like a "V-shape reversal" reaction - a sharp turnaround with dynamic volume suggests strong buyer interest.
The key will be the reaction to 2,003 USDT - a breakout and retest can give a very good long entry.
Short positions are risky as long as the price is in the lower half of the ascending channel.
BTCUSDT Update — Big Macro Forces In Play!!Hey Traders!
If you’re finding value in this analysis, smash that 👍 and hit Follow for high-accuracy trade setups that actually deliver!
Bitcoin once again testing key support levels as global tensions continue to fuel uncertainty in the markets.
Chart Overview:
BTC broke down from short-term resistance and is now retesting the major support zone between $102K–$103K. The structure still remains within a broader consolidation range, but this support zone is absolutely critical for bulls to defend.
Immediate Resistance: $106K → $110K
Immediate Support: $102K → $100K
A breakdown below $100K could trigger deeper liquidations towards $95K–$98K, while a successful defense here could push BTC back toward previous highs.
Geopolitical Impact:
Global headlines are heavily influencing risk assets right now:
🇮🇱 Israel-Iran tensions are escalating.
🇺🇸 The US is signaling stronger involvement diplomatically, adding more fear to markets.
📉 Traditional markets have already started to show signs of caution.
Bitcoin, as a risk asset, remains vulnerable to these global macro shocks in the short term.
The Game Plan Right Now:
If we see sustained support at $102K–$103K, there’s still room for a relief bounce towards $106K–$110K in the near term.
However, if global tensions escalate further, expect increased volatility with downside liquidity grabs.
Stay cautious with tight risk management. Macro headlines are still driving sudden sentiment shifts.
📊 My Bias:
Watching for potential sweep of $102K with possible reversal structure forming. Any clear reclaim of $105K may signal a local bottom.
📝 Key Takeaway:
Global narratives are bigger than technicals right now. The next few days could dictate whether BTC holds or faces another sharp liquidation event.
Stay patient. Stay disciplined. And most importantly: manage your risk.
👉 Follow for more real-time updates as we track both price action and macro headlines impacting crypto.

Major Support Confluence, Tactical Rebound or Looming Flush?__________________________________________________________________________________
Technical Overview – Summary Points
__________________________________________________________________________________
Momentum: BTC is working a major daily support zone (102.6–103k USDT) with strong confluence across 1D, 12H, and 2H pivots. Technical rebound in play, but still no strong behavioral catalyst.
Supports / Resistances: Key support clusters at 102.3–103.3k (2H, 720min, daily pivots). Main resistances: 106.4k–110k.
Volume: Very high on 2H/1H near supports, hinting at possible washout/profit-taking. No buy climax identified.
Risk On / Risk Off Indicator: Strong bullish signal from 1D to 30min (neutral on 15min), while lower TFs remain under selling pressure.
Multi-TF Behavior (ISPD DIV): No excess or euphoria: market is waiting/compressed, caution is necessary in the short term.
__________________________________________________________________________________
Strategic Summary
__________________________________________________________________________________
Global Bias: Tactical bullish but cautious — confirmation on clean rebound needed to strengthen conviction.
Opportunities: Technical entries in the 102.6–103.3k zone with stops below 102k (aggressive) or 97.5k (defensive). Profit-taking zones at 106.4k/109.9k/110k.
Risk Areas: Invalidated below 97.5k (swing), potential flush down to 94k/88–89k. Heightened vigilance around macro releases.
Macro Catalysts: PMI prints (June 23), Fed on pause, increased geopolitical risks (latent volatility and cross-asset caution).
Action Plan: Prioritize active management: reduced position sizing, mechanical stops, and real-time bias adjustment based on volume and behavioral response.
__________________________________________________________________________________
Multi-Timeframe Analysis
__________________________________________________________________________________
1D–12H: Major supports (D Pivot Low 102626.8), structural uptrend, strong Risk On signal, but no behavioral/volume extremes.
6H–4H: Ongoing technical rebound, moderately high volume, support confluence, BUT short-term TF pressure remains.
2H–1H: Very high volume at support, possible local flush, but still no bullish behavioral confirmation—monitor for rapid volatility.
30min–15min: Tentative stabilization post-support absorption, no clear psychological excess, risk of further downside if rebound not confirmed; Risk On / Risk Off Indicator is neutral at 15min.
Summary: Bullish structural setup, but fragile micro dynamics—discipline and speed are key.
__________________________________________________________________________________
Fundamental & On-chain Overview
__________________________________________________________________________________
External factors: Fed on hold, US inflation slightly higher, robust economy, increased geopolitical risks (hot spots Israel–Iran, Ukraine–Russia). Latent risk-off sentiment but not yet materialized.
Calendar to watch: June 23, 09:45–10:00 UTC (US PMI & home sales).
On-chain: Low user activity, high institutional volumes, off-chain flow dominance, leverage high (mostly in stablecoins, limiting crypto-margined liquidation spirals), no euphoria or panic detected.
Risk/reward synthesis: Key technical buy zone 102.6–103.3k (stop < 102k/97.5k), targets 106.4k/109.9–110k. Below 97.5k: bearish bias, defensive risk management needed.
__________________________________________________________________________________
Final strategic synthesis
__________________________________________________________________________________
BTC remains "structurally strong but tactically fragile": major support confluence and bullish sectoral signal, but persistent micro selling pressure and macro/cross-asset uncertainty. Only entries on clear technical signals, mechanical stops and active risk management offer rational short-term setups in this volatile and compressed environment.
__________________________________________________________________________________

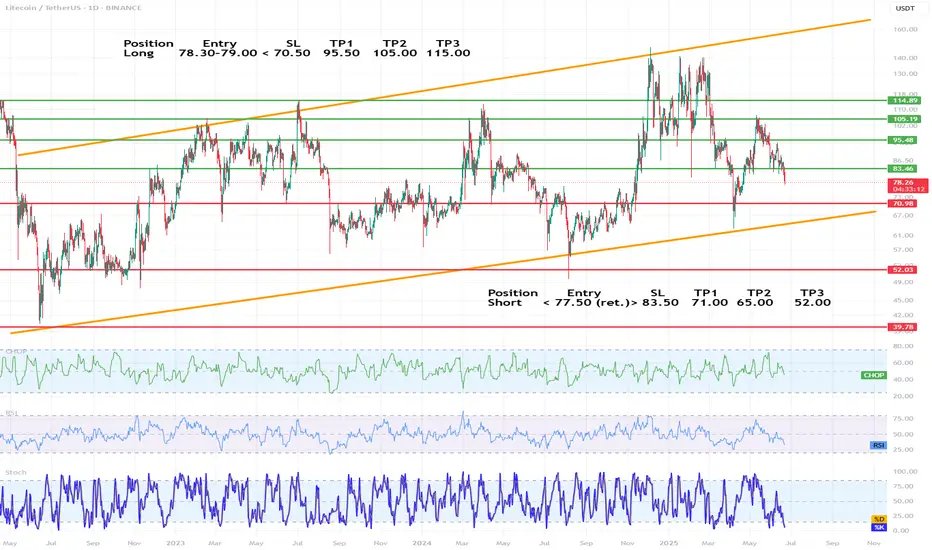
LTC/USDT chart technical analysis (1D)🔷 1. Trend and market structure
🔺 Main channels:
The chart is moving in an ascending channel (orange lines), the lower and upper limits of which have been respected since mid-2022.
The current price (around 78.3 USDT) is in the middle range of the channel, with a downward trend in recent weeks.
🔁 Market phase:
The price is in consolidation in a broader uptrend.
The last upward swing did not break through the previous peak (~135 USDT), which may indicate weakening momentum.
🔷 2. Key horizontal levels (support/resistance)
✅ Resistance levels (green lines):
83.46 USDT – the nearest resistance, currently being tested from below.
95.48 USDT – strong resistance from March-April 2024.
105.19 USDT – a level tested many times in the past.
110.00 USDT – a psychological level.
115.83 USDT – a local high from December 2023.
🛑 Support levels (red lines):
78.30 USDT – currently tested support level.
70.98 USDT – a key defensive level for bulls.
52.03 USDT – strong historical support.
39.78 USDT – the last line of defense, consistent with the lows from 2022.
📐 Dynamic support (orange line):
The lower boundary of the ascending channel – currently falls around 65 USDT and increases over time.
🔷 3. Technical indicators
📊 CHOP (Choppiness Index)
Oscillates near the lower values → the market is starting to leave the consolidation phase.
Potential directional movement soon, most likely downward (due to momentum).
📉 RSI (Relative Strength Index)
RSI below 50, currently around 40–45 → supply advantage.
Not oversold yet, but momentum is downward.
🔄 Stochastic
Well below 20, i.e. in the oversold zone.
Potential for a short-term bounce, but it can also go lower with a stronger sell-off wave.
🔷 4. Technical scenarios
🟢 Growth scenario (long):
Condition: Defending the level of 78.3 USDT and a quick return above 83.46.
Targets:
TP1: 95.48
TP2: 105.19
TP3: 115.83 (upper border of the channel)
SL: below 70.98 USDT
🔴 Bearish scenario (short):
Condition: Break 78.3 and retest as resistance.
Targets:
TP1: 70.98
TP2: 65 (lower channel line)
TP3: 52.03 (large accumulation zone)
SL: return above 83.46
🔷 5. Swing strategy proposal
Long
Entry 78.30–79.00
SL < 70.50
TP1 95.50 TP2 105.00 TP3 115.00
Short
Entry < 77.50 (ret.)
SL > 83.50
TP1 71.00 TP2 65.00 TP3 52.00
🔷 6. Additional comments
It is worth observing the price reaction at 70.98 USDT - this could be a capitulation level or a strong rebound.
The formation on the daily chart resembles a head and shoulders (H&S) - a warning signal for bulls.
Looking deeper in the consolidation zone of $BTC 4hr Wanted to show how I use fibs and how I use them to approach entry and exit points while in consolidation.

SWDY Decrease AnalysisSWDY stock is in a decreasing zone. It reached the lowest support line at 73.011. In case of rebounding up which is highly expected, it'll reach the resistance line 75.011 to reach the 75.215 then the 3rd at 75.338

ETHUSDT – LAST HOPE FOR BULLS!Hey Traders!
If you’re finding value in this analysis, smash that 👍 and hit Follow for high-accuracy trade setups that actually deliver!
ETH has officially broken below the ascending channel support and is now testing the final demand zone (highlighted in green). This zone also aligns with the 200 EMA on the 12H timeframe — historically a strong dynamic support.
📉 If ETH fails to hold this green box, it could trigger a deeper correction, potentially dragging the price back towards the $2,200–$2,100 range.
✅ Bullish Case: A quick reclaim of the $2,460–$2,500 area followed by strong volume could invalidate this breakdown and bring back momentum toward $2,800.
🚨 Bearish Confirmation: A clean close below $2,400 on the 12H/Daily with rejection wicks would open the floodgates for lower targets.
💡 This is a make-or-break moment. Bulls need to defend this zone with strength — or risk handing over full control to the bears.
📍 Levels to Watch:
Support: $2,360 / $2,280 / $2,120
Resistance: $2,500 / $2,660 / $2,800
📊 Stay cautious, stay prepared. Follow for real-time crypto breakdowns & setups.

ORDI/USDT – Bullish Falling Wedge Formation!!Hey Traders — if you're into high-conviction setups with real momentum, this one’s for you.
ORDI is forming a bullish falling wedge pattern and is currently consolidating near crucial support. The price is showing initial signs of breakout potential.
Here's the trade plan:
Entry: $7.20–$7.70
Targets: $9.20 / $10.50 / $11.90
Stop Loss: $6.50 (Strict)
Excellent risk-to-reward opportunity here. Keep your stops tight and manage your risk wisely.
