ADA 4H OUTLOOKIF ADA is a bounce at the support 0.919725 and break the trendline resistance, there is a high possibility that the price will rise to the resistance target at 1.068930. However, if it turns out that the price bounces on the trendline resistance, it means that ADA is still continuing its down channel pattern until the support 0.844890
Do your own research guys
Support_and_resistance


GoldViewFX - DAILY CHART UPDATEHey Everyone,
Updated DAILY CHART LEVELS.
1916 AXIS SUPPORT is providing support on the daily chart. Although we have seen price drop as low as 1890, price was not able to close below 1916 level on this chart, maintaining the Bullish structure.
If we see a candle body close below 1916 then we will see price challenge 1885 and if we see the candle body close with EMA5 cross then 1847 Goldturn will also be open.
Maintaining this support gives us the setups needed to remain Bullish with Targets at 1948, 1959 and 1978.
These are longer range targets and levels so expect big swings in-between. We will break this down into smaller levels to trade safely.
Please don't forget to HIT like, comment and follow us, we appreciate it!
GoldViewFX
XAUUSD TOP AUTHOR

Falling Wedge- Bullish - UpdatePosting a quick update on AAPL here as this falling wedge caught my eye. AAPL setting up nicely here holding a big falling wedge on the daily timeframe while also flagging on the weekly timeframe. AAPL closed on Friday reclaiming its 100-day EMA and seemingly looking to reclaim the 50-day as well. MACD golden cross along with some bullish hidden divergence on the RSI, Bollinger Bands are also starting to squeeze (Not Pictured). Additionally, AAPL has earnings coming up on May 3rd. AAPL is almost always a classic case of "buy the hype, sell the news" . That being said, am expecting a run-up into earnings so will certainly be looking for a breakout from this falling wedge (Broader Market Conditions Permitting). Just some support and resistance levels to keep an eye on along with some RSI-based supply and demand zones to keep an eye on in the meantime- Price Targets & Previous Charts Attached Below
- Falling wedge on the Daily timeframe
- Bollinger Bands Daily Weekly Timeframe (Not Pictured)
- Slight bullish hidden divergence on the RSI
- MACD Golden Cross
PT1- $164.48
PT2- $165.55
PT3- $166.60
PT4- $167.30+
--Weekly Timeframe--
--Previously Charted--

Falling Wedge- Bullish - UpdateJust posting a quick update here as GS has gotten beaten down as the broader markets pulled back but has seemingly found some support after reclaiming its 20-Day SMA. GS is lagging the XLF at the moment, however, looks to be setting up nicely for a big breakout. GS respected support nicely with a triple bottom around the $228 mark. GS is holding within a nice falling wedge along with forming an inverse head and shoulders & bullish Gartley harmonic pattern on the hourly timeframe. Additionally, Bollinger bands are squeezing along with some bullish hidden divergence on the RSI on the 4-hour timeframe, and a golden cross on the MACD on the daily timeframe. Bullish and will be looking for a breakout from this wedge (Broader Market Conditions Permitting). Just some support and resistance levels to watch along with some RSI-based supply and demand zones to keep an eye on in the meantime- Price Targets & Previous charts are attached below
- Falling Wedge
- MACD Cross on the Daily Timeframe
- Sitting on the 20-day SMA
- Bullish Gartley Harmonic Pattern Formed on the Hourly Timeframe
- Bullish Hidden Divergence on the RSI on the 4-Hour Timeframes as well
PT1- $340.23
PT2- $342.28
PT3- $344.08
PT4- $345.73+
4-Hour Timeframe
Hourly Timeframe
Previously Charted

Falling Wedge- Bullish (Long) - UpdateRUN looking really nice here heading into earnings sitting right on its 9-Day EMA. Big Falling wedge on both the daily and weekly timeframes (See Attached Chart Below), Bollinger bands are starting to squeeze (Not Pictured) as buyer volume starts to pick up relative to seller volume. Slight bullish hidden divergence on the RSI on the daily timeframe & the weekly timeframe along with a bullish Gartley harmonic pattern formed on the weekly timeframe- Bullish and will be looking for a breakout from this falling wedge (broader market conditions permitting)- Just some support and resistance levels along with some RSI-based supply and demand zones to keep an eye on in the meantime (Previous Charts Attached Below)
- Falling Wedge
- Bollinger bands are starting to squeeze (Not Pictured)
- Slight bullish hidden divergence on the RSI on the daily timeframe & the weekly timeframes
- Bullish Gartley harmonic pattern formed on the weekly timeframe
- RSI getting out of oversold territory as buyer volume starts to pick back up
PT1- $23.87
PT2- $24.60
PT3- $25.54
PT4- $26.06 +
--Weekly Timeframe--
--Previously Charted--

Falling Wedge- Bullish - UpdateBig falling wedge on LAC here- Played the last run-up when it was setting up very similarly to how it is now. Clean Bullish hammer bouncing right off the 200-day EMA, some bullish hidden divergence on the RSI, MACD golden cross. Bullish and will be looking for a breakout from this wedge (Broader Market Conditions Permitting)- Just some support and resistance levels to keep an eye on along with some RSI-based supply and demand zones in the meantime
- Falling Wedge
- MACD Golden Cross
- Hammer off of the 200-day EMA
- Bullish Hidden Divergence on the RSI
PT1- $25.89
PT2- $26.94
PT3- $27.38
PT4- $30.53
--Previously Charted--

Symmetrical Triangle - UpdateJust posting a quick update on MSFT here as it's currently in somewhat of a make-or-break spot sitting right on its 200-day EMA. However, MSFT has some bullish divergence on the weekly timeframe but bearish hidden divergence on the RSI on the daily timeframe. However, a big bullish cypher formed. MSFT's Bollinger bands are squeezing so will be watching this one closely going into next week depending on the broader markets- Just some support and resistance levels and some RSI-based supply and demand zones to keep an eye on, previous charts are attached below
--Previously Charted--

Falling Wedge- BullishDDOG starting to look really nice here. Starting to breakout of a big falling wedge it's been holding for quite some time now after bouncing right off the 200-day EMA. Bollinger bands are also squeezing (Not Pictured), MACD golden cross on the daily timeframe, bullish bat harmonic pattern formed on the 4-Hour timeframe along with some bullish hidden divergence on the RSI. Will be watching DDOG closely for a breakout here (Broader Market Conditions Permitting). Just some support and resistance levels to watch along with some RSI based supply and demand zones to keep an eye on in the meantime- Bullish and looking for a breakout from this wedge
- Falling Wedge
- MACD Golden Cross
- Bollinger Bands are squeezing (Not Pictured)
- Bullish Hidden Divergence on the RSI on the 4-Hour Timeframe (See Attached Chart Below)
- Bullish Bat Harmonic Pattern on the 4-Hour Timeframe (See Attached Chart Below)
PT1- $146.33
PT2- $148.60
PT3- $150.35
PT4- $154.86 +
--4-Hour Timeframe--

Falling Wedge- Bullish - UpdateENPH looking really nice heading into earnings here. After getting beaten down below the 200-Day SMA where it's previously found support, ENPH just reclaimed the 20-Day EMA & is currently sitting on the 20-Day SMA. Big falling wedge on the daily timeframe and massive hidden bullish divergence on the weekly timeframe (Not Pictured). RSI is finally starting to come out of oversold territory as buyer volume picks back up. Bollinger bands are also squeezing (Not Pictured) in addition to some slight hidden bullish divergence on the 4-hour timeframe. Bullish and will be looking for a breakout from this wedge (Broader Market Conditions Permitting)- Just some support and resistance levels to watch along with some RSI-based supply and demand zones to keep an eye on in the meantime- see previous charts attached below for previous price targets.
- Falling Wedge
- Reclaimed the 20-Day EMA
- RSI Finally Out of Oversold Territory
- Massive Bullish Hidden Divergence on the RSI on the Weekly Timeframe (Not Pictured)
- Bollinger Bands Squeezing (Not Pictured)
- Buyer Volume Picking Back Up
PT1- $143.38
PT2- $145.42
PT3- $146.71
PT4- $148.66 +
--Previously Charted--

TSLA at a Critical Spot- UpdateTSLA is currently at a make-or-break spot heading into earnings after hours today. Currently sitting right on its 200-day EMA and is testing a long-term uptrend line. Additionally has some bearish hidden divergence on the RSI. However, big bullish cypher formed and buyer volume is picking back up. Will be watching this one closely- Just some support and resistance levels and some RSI-based supply and demand zones to keep an eye on, previous charts are attached below
--Previously Charted--

Falling Wedge- Bullish (Long) - UpdateBeen a while since I've posted an update on ETH, starting to catch my eye here as it continues to sell off for potential long entries. ETH is holding quite a large falling wedge here on the daily timeframe but also is testing a long-term uptrend line. ETH is also seeming to be following an ABCDE Elliot wave so will be looking for a potential bounce or breakout after completion. (correctional wave, however, if at the end of the E wave there is no demand on the buy side, there will be no breakout).
Lastly, something certainly worth noting and keeping an eye on the weekly timeframe- a bearish bat harmonic pattern is formed and currently playing out (See Attached Chart Below). Just some support and resistance levels to watch along with some RSI based supply and demand zones to keep an eye on in the meantime- Bearish in the short-term but bullish in the long-term so will be watching closely for potential long entries, all previous charts are attached below
- Falling wedge on the daily timeframe
- RSI in oversold territory on the daily timeframe
- ABCDE Elliot Correctional Wave playing out
- Bearish bat harmonic pattern on the weekly timeframe (See Attached Chart Below)
- Declining volume on the weekly timeframe (See Attached Chart Below)
--Weekly Timeframe--
--Previously Charted--

EOS 15 min scalpTrade number: 002
Setup picture: S002
This is a scalping idea in 15 minutes time frame and I hope you enjoy it please subscribe so that I will share my trade ideas and you can enjoy and rate any trading ideas.
Thank you for your support

Falling Wedge- BullishWatching NVDA closely here- a bit wary of big tech at the moment, however, NVDA is setting up quite nicely holding a big falling wedge. Bollinger bands are starting to squeeze (Not Pictured), slight bullish hidden divergence on the RSI & MACD golden cross on the 4-Hour timeframe (See Attached Chart Below). Lastly, looks like NVDA went to try & reclaim the 50-day EMA but hard rejection off of it. Will be looking for a breakout from this wedge and for NVDA to reclaim the 50-day EMA (Broader Market Conditions Permitting). Just some support and resistance levels to watch along with some RSI based supply and demand zones to keep an eye on in the meantime- Bullish and looking for a breakout from this wedge
- Falling Wedge
- Bollinger bands are starting to squeeze (Not Pictured)
- Slight bullish hidden divergence on the RSI on the 4-Hour timeframe (See Attached Chart Below)
- MACD Cross on the 4-Hour Timeframe (See Attached Chart Below)
PT1- $225.25
PT2- $276.31
PT3- $281.39
PT4- $284.56+
-- NVDA 4-Hour Timeframe --

Symmetrical Triangle - UpdateKeeping a close eye on DIS here as it's still holding a big symmetrical triangle with a big gap to fill on the upside after selling off after earnings. MACD cross and some slight hidden bullish divergence on the RSI on the 4-Hour timeframe (Not Pictured). With buyer volume should really pop- Will be looking for a breakout from this triangle (Broader Markets Permitting) - Just some support and resistance levels to keep an eye on in the meantime along with some RSI-based supply and demand zones - Bullish and looking for a breakout
- Symmetrical Triangle
- Closed Friday Reclaiming & Sitting on the 50-day EMA
- MACD Cross on the 4-Hour Timeframe (Not Pictured)
- Slight Hidden Bullish Divergence on the RSI on the 4-Hour Timeframe (Not Pictured)
- Big Gap Fill on the Upside
- Buyer Volume Picking back Up
PT1- $158.76
PT2- $161.83
PT3- $163.67
PT4- $172.55 & Gap Filled
-- Previously Charted --

Falling Wedge- Bullish - UpdateNice falling wedge on CAT here along with some slight bullish divergence on the RSI. Will be watching CAT closely here for a breakout from this wedge (Broader Market Conditions Permitting). Definitely worth noting that CAT is a relatively slow mover so likely will be a longer-term play. Bullish- just some support and resistance levels and some RSI-based supply and demand zones to keep an eye on in the meantime. -Previous Charts are attached below-
- Falling Wedge
- EMA's converging & starting to curl upwards
- Bollinger Bands starting to squeeze (Not Pictured)
- Slight Bullish Divergence on the RSI (Not Pictured)
- MACD Golden Cross
- Buyer volume picking up to seller volume
PT1- $207.79
PT2- $208.61
PT3- $210.79
PT4- $211.34
--Previously Charted--

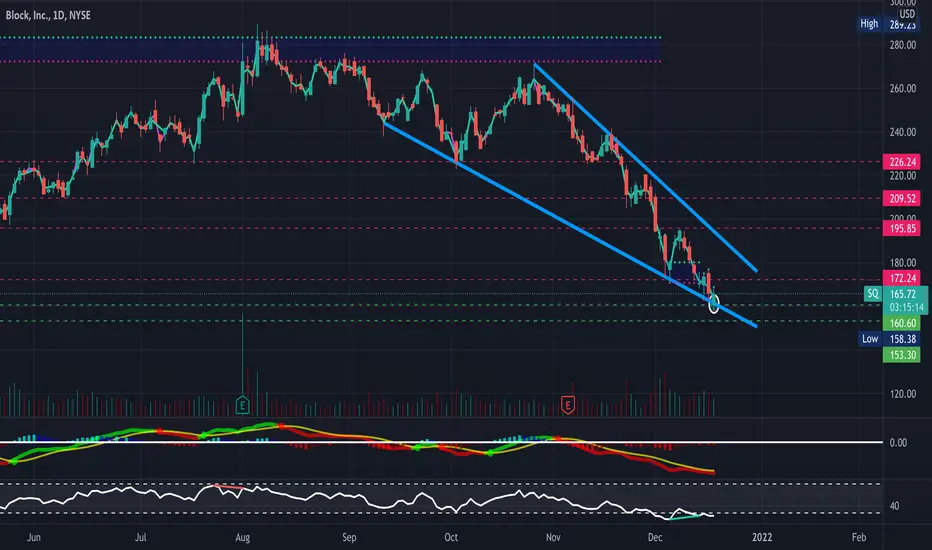
Falling Wedge- Bullish - UpdateJust posting a quick update on SQ here as it has gotten beaten down badly amidst all of the intraday volatility. However, respected support nicely and is holding quite a large falling wedge. Bullish and will be watching closely for a breakout from this wedge as buyers start to step in (broader market conditions permitting)- Just some support and resistance levels along with some RSI-based supply and demand zones to keep an eye on in the meantime- Previous charts are attached in the description below
- Bollinger Bands Squeezing on the hourly timeframe (See Attached Chart Below)
- Slight bullish hidden divergence on the RSI on the hourly timeframe (See Attached Chart Below)
- MACD Cross on the Hourly Timeframe (See Attached Chart Below)
- Falling wedge on the daily timeframe
- Sitting right above the VWAP
- Bullish Hidden Divergence on the RSI on the Daily Timeframe as well
PT1- $168.13
PT2- $171.21
PT3- $172.24
PT4- $175.51 +
--Hourly Timeframe--
--Previously Charted--
Falling Wedge- Bullish - UpdateENPH starting to look really nice here after pulling back to the 200-day EMA following new ATHs. Big falling wedge forming on the 4-Hour and Daily Timeframes. Certainly a longer-term play, however, bullish and will be looking for a breakout from this wedge (Broader Market Conditions Permitting). Just some support and resistance levels to watch along with some RSI-based supply and demand zones to keep an eye on in the meantime- Bullish and looking for a breakout, see previous charts attached below for previous price targets.
- Bullish Hammer off the 200-Day EMA
- RSI in Oversold Territory
- Falling Wedge
- Slight Gap to FIll on the Upside
- Holding Above VWAP on the 4-Hour (See Attached Chart Below)
- Falling Wedge on the TAN ETF as well
PT1- $185.37
PT2- $187.64
PT3- $189.36
PT4- $191.48
--4-Hour Timeframe--
--Previously Charted--
--TAN--

Falling Wedge- Bullish- Gap FillFVRR catching my eye here as it's one of those stocks that can really move with volume. Holding a nice falling wedge with buyers starting to step in, some slight bullish hidden divergence on the RSI, Bullish bat (Alt Bat) Harmonic formed, and Bollinger bands squeezing as well. Bullish and will be looking for a breakout from this wedge (Broader Markets Permitting) - Just some support and resistance levels along with some RSI-based supply and demand zones to keep an eye on in the meantime
- Falling Wedge
- Bullish Hidden Divergence on the RSI
- Gap Fill on the Upside
- Bollinger Bands Squeezing
- Bullish Bat Harmonic Pattern Formed
PT1- $123.46
PT2- $124.84
PT3- $125.52
PT4- $128.92 +

Falling Wedge- BullishNET starting to catch my eye here after holding this falling wedge for quite some time now. Seemingly has found some support as it closed on the daily timeframe sitting right on its 200-Day EMA. Bullish and will be looking for a breakout from this wedge (Broader Markets Permitting) - Just some support and resistance levels along with some RSI-based supply and demand zones to keep an eye on the meantime-
Hourly Timeframe Attached Below
- Sitting on its 200-day EMA
- RSI is Nearing Oversold Territory (Not Pictured)
- Bollinger Bands Squeezing on the Hourly Timeframe (See Attached Chart Below)
- Bullish Hidden Divergence on the RSI on the Hourly Timeframe (See Attached Chart Below)
- MACD Cross on the 4-Hour Timeframe (Not Pictured)
- Buyer Volume Starting to Pick up Relative to Seller Volume
PT1- $132.34
PT2- $134.40
PT3- $136.36
PT4- $138.92
--Hourly Timeframe--

Price may go down before reaching highs!There's two imbalances at the market below and above! Price may continue to go shorter before reaching next high to fulfil the imbalance above :) Cheers!

Falling Wedge- BullishSPCE starting to catch my eye here after selling off for quite some time in addition to getting beaten down amidst all of the intraday volatility. SPCE holding a big falling wedge, buyers starting to step in, RSI finally starting to come out of oversold territory. Additionally worth noting that SPCE has a space flight next month could act as a catalyst.- Bullish and will be looking for a breakout from this wedge (Broader Markets Permitting) - Just some support and resistance levels along with some RSI-based supply and demand zones to keep an eye on in the meantime - Bullish and looking for a breakout from this wedge - (See charts attached in the description below)
- Falling Wedge on the 4-hour and Daily Timeframes
- MACD Cross & Bullish Hidden Divergence on the RSI on the Daily & 4-Hour Timeframe (See Attached Chart Below)
- Small Gap Fill on the Upside Circa $23.03-21.74 (See Attached Chart Below)
- Bollinger Bands Squeezing & Buyer Volume Starting to Pick Up Relative to Seller Volume
PT1- $15.09
PT2- $15.90
PT3- $16.44
PT4- $16.87+
--4-Hour Timeframe--

Falling Wedge- Bullish - UpdateTAN along with the solar sector starting to catch my eye here- Holding a big symmetrical triangle with a falling wedge at the end (See Attached Chart Below). Undoubtably a longer-term play, however, solar's price action tends to be quite cyclical so will certainly be looking for a breakout from this triangle and wedge (broader market conditions permitting)- Just some support and resistance levels and some RSI-based supply and demand zones to keep an eye on in the meantime- Bullish
- Symmetrical Triangle
- Bullish Hidden Divergence on the RSI
- Bollinger bands squeezing on the hourly timeframe (See Attached Chart Below)
- MACD Golden Cross & bullish divergence on the RSI on the hourly timeframe (See Attached Chart Below)
- Falling wedge on the daily, 4-hour, and hourly timeframes (See Attached Charts Below)
PT1- $83.93
PT2- $84.87
PT3- $85.17
PT4- $86.15
--Hourly--
--4-Hour--
--Daily--
--Previously Charted--
