Bitcoin on the Edge: Trading in a Tight Range, Will it Break OutAt the time of writing, Bitcoin is still within its current range, bounded by the monthly resistance level of $23,301 and the daily support level of $22,393. We are below the Value area Low (VAL) of the current range and testing the daily support level.
For the bearish scenario: we have liquidity and stop losses along with the CME gap around the $20,000 level. It’s a significant psychological level and hard to break, but if we break through this level, we can expect a drop around $18,170-$18,540 which is a 0.66 Fibonacci level from overall lows to the current high. This level previously acted as a strong resistance.
For the bullish scenario: if the price manages to break above the $23,301 monthly level, then we can witness another $1,000 rise upwards around the $24,297 weekly level, or if the bullish momentum is strong enough, then we can expect the price to move straight to $25,211 for the swing failure pattern (SFP) or Failed auction (FA) of the last high before a significant sell-off.
Conclusion: As of now, we are in the mini range and will trade the range until it breaks. With apparent resistance and support levels, traders can identify entry and exit points to capitalize on the current market conditions.
Support_and_resistance

EURJPY TRADE IDEAWaiting pullback
My trading strategy isn't intended to be used as a signal service. It's a process of gaining knowledge of market structure and improving my trading abilities.
Like and subscribe and happy trading to all

Falling Wedge- BullishAfter holding a long downtrend since the beginning of 2022, GOOG is finally looking ready to breakout here as Google is approaching the end of a nice falling wedge, testing the 20-day EMA while also hovering at a weekly low, heading into earnings.
Bollinger bands are squeezing (Not Pictured), a bullish shark harmonic pattern, and a MACD golden cross have formed on the daily timeframe. This is accompanied by a massive falling wedge on the weekly timeframe (See Attached Chart Below), along with some bullish hidden divergence on the RSI. Bullish and will be looking for a breakout from this wedge (Broader Market Conditions Permitting)- Just some support and resistance levels to watch along with some RSI-based supply and demand zones to keep an eye on in the meantime - (See Attached PT's &Charts Below)
PT1- $91.86
PT2- $92.54
PT3- $96.23
PT4- $96.23+
--Weekly Timeframe--

Range Bound: Analyzing Key Levels in the Bitcoin MarketYesterday, the Bitcoin market experienced significant volatility; however, Today's activity was relatively subdued as the price of bitcoin fluctuated between $20,646.5 and $21,179.5. This trend persisted throughout the Asia and London trading sessions; BTC struggled to claim the Point of Control of the current range and spent most of the time between $20,650- $20,964. After the NY Open, we saw BTC start grinding upwards, and before the NY close, the price finally reached the level at which I had intended to enter a short trade, allowing me to enter at $21,144.5.
Currently, the market remains within the developing range of $21,481 to $20,400, with key levels including the Value Area High at $21,237, the Point of Control at $20,908.5, and the Value Area Low at $20,677. (These numbers can vary slightly based on price action)
In terms of future market activity, there are several potential scenarios to consider.
Scenario no.1: Point of Control may act as a form of support, allowing the price to continue upward to reach the 0.66 Fibonacci level and the Value Area High, then get accepted into the range and begin to move towards the Value Area Low of the range.
My trading strategy would be to enter a short trade, as soon as it appears that the price is being accepted in the Value area High of the range, my TP1 would be the Point of Control, and I would allow the trade to run as I anticipate that price will break through Value area Low and grab the liquidity from $20,000 level.
Scenario no.2: Price continues ranging and takes the liquidity below $20,000, fills the CME gap, gets accepted back in the range, and then continues the bull trend. It is worth noting that entering a long trade in this scenario may be challenging, as it can be a continuation of a downtrend on a long-term time frame. To minimize risk, I will be monitoring the price action closely. I will wait for the price to get acceptance within the Value Area Low of the range and at the level of $20,246 before entering a conservative long position.
Based on my analysis, there are several key levels to consider before jumping into any trade.
On the upward trend, key levels to consider include the 0.618 fib level and an untapped weekly level at $21,827.5. f the price manages to break through this resistance, the following significant levels to watch are the daily level at $22,393, the monthly level at $23,301, and the weekly level at $24,297.
On the downward trend, a consolidation area around $18,375-$18,850 may serve as support, as it previously acted as resistance before the breakout. f the price breaks through this zone, it is advisable to look for support at levels between $17,450 - $17,750, as there are several daily Naked Point of Control levels, untapped daily levels, and a 0.66 fib level from the low to the current high.
I have set alerts for all these important levels and will approach potential trades with patience, carefully observing market reactions before making any decisions. If the levels do not hold, I will remain patient and look for potential opportunities at the following levels.

BTC Analysis and Key Levels to WatchBYBIT:BTCUSD.P
As traders, we must always start our analysis with higher-term timeframe ranges. Recently, we saw the price break to the upside, and currently, it is testing the value area low of the previous range. The horizontal fib 0.618 from the high to the current low acts as a resistance.
If we zoom in on the lower-term time frame, we can see that we are forming a range that started on Friday and continued over the weekend. A fixed range tool gives us significant levels ranging between 20700- 21250, which is almost a 4% range. This should be our main trading idea.
Yesterday, we saw a push to the downside, which touched the value area low of the range, a swing failure pattern of the previous low, and followed with a nice buyback. The price started to claim the point of control and daily VWAP, and after some consolidation near VWAP, the price started pushing toward the top of the range, where we got another swing failure. After getting accepted back from the SFP level price continues ranging.
However, sooner or later, we all know this range will break to either upside or downside. As a trader, we need levels, both to the upside to back up the bullish scenario and to the downside for the bearish scenario. At this point in time, I expect more upside price action. On the upside, we have the NSPOC (Naked Session Point of Control) level at 21725, the weekly level, the fib level 0.618, and the previous range VAH (Volume area high) level around 21827.5.
But if the price breaks to the downside, we have a little consolidation around the 18375-18850 area; we do have VAL of the previous range along with the last support area. So we can expect a reaction here. But if the momentum is strong, then we can expect lower. We have daily naked points of control at $17,725 and $17450, along with 0.618 fib level around $17,550. I will expect some reaction here.
In conclusion, it's crucial to constantly keep an eye on critical levels such as Current range volume areas and horizontal fib levels, as they can be important in determining the market's direction. Always have a plan and be prepared for bullish and bearish scenarios. Happy trading!

Flagging on the 5-YearAAPL is looking quite nice here after reclaiming its 50-Day SMA. AAPL is currently testing the upper trendline of this falling wedge on the daily timeframe, while simultaneously flagging on the weekly timeframe, accompanied by a bullish butterfly harmonic pattern, a MACD golden cross, and a double bottom (See Attached Chart Below). While all signs point to bullish, personally, I would like to see some consolidation prior to scaling into some Feb 2023' Calls to play the run-up to its earnings in January. Nevertheless, AAPL is still looking primed for a breakout on the daily timeframe holding a falling wedge with buyers stepping in as depicted on the RSI along with some bullish hidden divergence. Bullish and will be looking for a breakout from this wedge (Broader Market Conditions Permitting). Just some support and resistance levels to watch along with some RSI-based supply and demand zones to keep an eye on in the meantime- Price Targets & Previous charts are attached below
PT1- $152.48
PT2- $154.12
PT3- $156.98
PT4- $160.14+
Weekly Timeframe
Previously Charted

Symmetrical Triangle - Watching closelyWatching LAC and the lithium sector closely here- LAC is currently holding a massive symmetrical triangle on the daily timeframe while holding an even larger falling wedge on the weekly timeframe (See Attached Charts Below). Additionally, LAC is sitting right on its 100-day SMA, which, is has been acting as a strong support level for quite some time. LAC's EMAs are starting to curl upwards as well (Not Pictured), accompanied with a bullish cypher harmonic pattern on the daily timeframe, and lastly some bullish hidden divergence on the RSI on the weekly timeframe. Bullish and will be looking for a breakout from this triangle (Broader Market Conditions Permitting)- Just some support and resistance levels to keep an eye on along with some RSI-based supply and demand zones in the meantime
-- Price Targets & Previous Charts Attached In Description -
PT1- $27.69
PT2- $28.56
PT3- $29.96
PT4- $31.15
--Weekly Timeframe--
--Previously Charted--

AUDCAD > What Is He best Place for A Buy!!Analysis of #AUDCAD
Hi traders, today we will have a look at #AUDCAD
The AUDCAD also broke out of its resistance structure level as you can see, and the perfect way of trading now is to look for a trend continuation pattern such as a Flag pattern, or wedge pattern, Triangle pattern, or wait for the market to come and test the previous structure support now becomes a resistance level
I hope you guys found this helpful, if you are new here click on follow, to get these ideas delivered straight to your email inbox, I will see you guys at the next one
Thanks for your continued support!

EURUSDHello to all
In my opinion, after reaching the determined demand level and after changing its nature, it can continue its upward path up to the determined range.

Swing Sell at Demand ZoneEverything is explained in the chart. You have complete pattern of S1, S2 and S3. Next is finding the Demand Zone for sell oppurtunity.

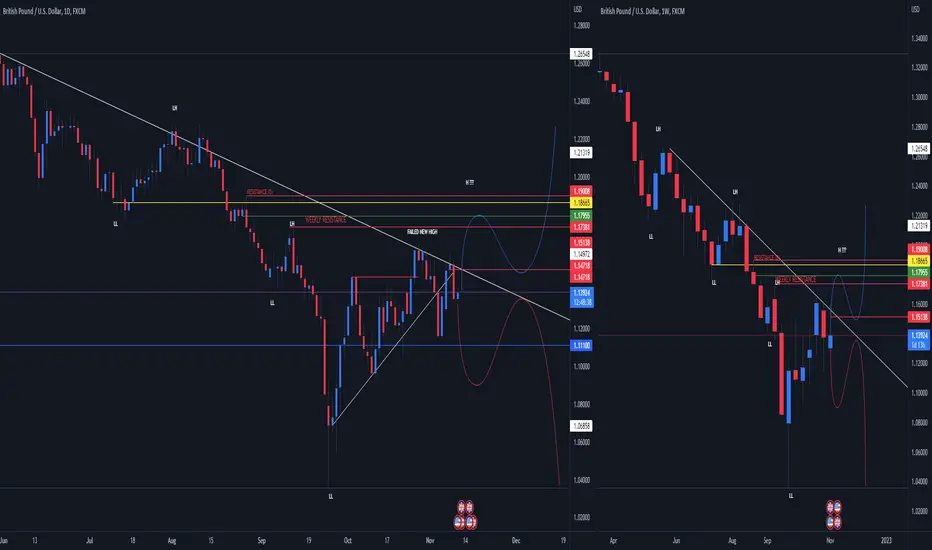
GBPUSD UPDATEMy trading strategy isn't intended to be used as a signal service. It's a process of gaining knowledge of market structure and improving my trading abilities.
Like and subscribe and happy trading to all
USOIL TRADE PLANMy trading strategy isn't intended to be used as a signal service. It's a process of gaining knowledge of market structure and improving my trading abilities.
Like and subscribe and happy trading to all

Waiting for the pullback from the strong resistance levelWaiting for the pullback from the strong resistance level that previously served support. Points of control do not let the price go higher. Activity of buyers is decreasing. Target - 0.021

XAUUSD WAITINGThis is my opinion of xauusd. Can the CPi break the weekly trendline and stay above 1712.665, or will the trendline hold?
My trading strategy isn't intended to be used as a signal service. It's a process of gaining knowledge of market structure and improving my trading abilities.
Like and subscribe and happy trading to all

EURUSD UPDATERE- DISTIBUTION PHASE ????
My trading strategy isn't intended to be used as a signal service. It's a process of gaining knowledge of market structure and improving my trading abilities.
Like and subscribe and happy trading to all

GBPUSD UPDATERE-DISTIRBUTION ZONE ????
My trading strategy isn't intended to be used as a signal service. It's a process of gaining knowledge of market structure and improving my trading abilities.
Like and subscribe and happy trading to all

Udated major support & resistance levels Weekly updated Support and Resistance levels for this week based on Central Pivot Range and its major support & resistance levels of week. Three black lines indicating weekly Central Pivot Range.

BankNifty looking bearish, Gap down ,Double Tweezer on top ??As per analysis Banknifty showing Tweezer on top on 4 Hours time frame, which means in upcoming week we can see a bearish moment in BankNifty
Banknifty having strong resistance at 39500 and nearest support at 39000 (open interest data).
Next strong support will be at 37833 as per 200 EMA ( Moving Average)
Please trade your plan accordingly.
Only for Educational purpose.

Falling Wedge - BreakoutDDOG starting to look quite nice here as buyers are starting to step in so long that the broader markets don't pullback. DDOG has been holding a big falling wedge for quite some time, getting rejected by the 20-day SMA, however will be keeping a close eye on DDOG with buyer volume starting to increase relative to seller volume. Bullish and will be looking for a breakout from this wedge (Broader Market Conditions Permitting)- Just some support and resistance levels to watch along with some RSI-based supply and demand zones to keep an eye on in the meantime
**(See Attached PT's &Charts Below)**
Daily Timeframe
- Bullish Hidden Divergence on the RSI
- Falling Wedge
- Bollinger Bands Squeezing
4-Hour Timeframe
- Bollinger Bands Squeezing
- Falling Wedge
- Bullish Gartley Harmonic Pattern
PT1- $89.90
PT2- $95.37
PT3- $99.34
PT4- $103.39+

Nifty IT Levels (Support & Resistance)Next Nifty IT Support & Resistance Levels On 1 Day Timeframe
NSE:CNXIT

Falling Wedge- Bullish (Long) - UpdatePosting a quick update here on SQ as buyer volume finally picked up and SQ closed the day breaking above strong resistance at the $68.84 mark while also reclaiming its 20-Day EMA. SQ has been trading sideways for quite some time and is seemingly breaking out of this falling wedge heading into earnings on 9/22' and with quadruple witching this coming Friday. Additionally, SQ closed out the weak with a golden cross on the MACD. On top of that, SQ's RSI is finally out of oversold territory on the weekly timeframe, accompanied by a massive bullish harmonic pattern and its Bollinger bands squeezing. Personally am bullish and am looking for a breakout, however, will add some downside protection due to how long SQ's been trading sideways. Nevertheless, bullish and will be watching closely for a breakout from this wedge as buyers continue to step in (broader market conditions permitting- earnings & quadruple witching)- Just some support and resistance levels along with some RSI-based supply and demand zones to keep an eye on in the meantime.
**See Below for Price Targets, Weekly Timeframe, and Previous Charts**
--Weekly Timeframe--
- Falling Wedge
- Bullish Harmonic Formed on the Daily & Weekly Timeframes
- Bollinger Bands Squeezing
- Closed Friday Breaking Above Strong Resistance
- RSI Finally Out of Oversold Territory
PT1- $78.82
PT2- $81.03
PT3- $86.76
PT4- $90.71+

INTEL Corp. $INTC - Buy @ ~ $35/$36INTEL Corp. $INTC - Buy @ ~ $35
I'm always on the Buy Side of the S&P500 Stocks.
I believe $INTC price is fairly good to buy it now for a long term investment.
My analysis is based on the trend lines (SMA 20 & 50) and Support & Resistance on the Daily time frame.
Target Prices are respectively as follow $40, $42, $45 & $56 and you can aim higher ($70) since the entry price is fairly too low.
NASDAQ:INTC

Range Trading Meets Pattern TradingMany times I enter discussions where people tend to bash pattern trading...
...saying that pattern trading is not actionable, that "most reversal patterns fail while most continuation patterns succeed", that "most diagonal patterns fail while most horizontal patterns work", that you can't derive direction from them.
My answer is always that direction is not derived from the pattern itself (that would be statistically based only), but instead is derived from both interior and exterior context. When searching for actionable setups, again, patterns and diagonals will mostly provide bias, signs such as exhaustion and trend shifts, while horizontal SR (Support & Resistance) levels will actually be the ones we'll be looking for actionable setups.
Here's a quick example of a Rising Wedge divided in three constantly smaller ranges showing a slowing down of the trend, where we can start seeing exhaustion by the constant failed breakouts of HORIZONTAL levels, and where one can derive potential direction bias from the first DIAGONAL trend break...
...potentially expecting now a cascade effect from smaller ranges down to the larger ranges, providing larger and larger expansion gaps ultimately running the Rising Wedge pattern target.
