WMT Showing Bullish Momentum – Move Toward $99.00 ExpectedNYSE:WMT is demonstrating strong bullish momentum, driven by consistent price strength and support from key moving averages. The recent price action confirms buyers' dominance, with a clear uptrend evident on the chart. The stock has advanced steadily, breaking out of prior consolidation zones, and is now poised to target the $99.00 level, which serves as the next significant milestone.
This setup aligns with the expectation of a bullish continuation, offering a potential long opportunity if pullbacks or consolidations occur near current levels.
If you agree with this analysis or have additional insights, feel free to share your thoughts here!
Support_and_resistance

NZDUSD Approaching Key Resistance – Potential Sell SetupOANDA:NZDUSD is approaching a key resistance zone. Previously, this level has acted as strong supply area, leading to a bearish reaction. The ongoing bullish momentum suggests that buyers might test this level soon. A bearish confirmation, such as a strong rejection pattern, bearish engulfing candles, or long upper wicks, would increase the probability of a pullback. If sellers step in, the price could move toward the 0.56570 level.
This is not financial advice but rather how I approach support/resistance zones. Remember, always wait for confirmation, like a rejection candle or volume spike before jumping in.
Please boost this post, every like and comment drives me to bring you more ideas! I’d love to hear your perspective in the comments.
Best of luck , TrendDiva

LEAD at Key Resistance Level - Correction Incoming?FUSIONMARKETS:XPBUSD is currently testing a significant resistance zone. Previously, this area has acted as a strong barrier, leading to bearish reactions. The recent rally into this zone suggests a potential for sellers to step in and drive prices lower.
A bearish confirmation, such as a strong rejection pattern, bearish engulfing candles, or long upper wicks, would increase the probability of a pullback. If sellers regain control, the price could move toward the 1,967.000 level.
This is not financial advice but rather how I approach support/resistance zones. Remember, always wait for confirmation, like a rejection candle or volume spike before jumping in.
Please boost this post, every like and comment drives me to bring you more ideas! I’d love to hear your perspective in the comments.
Best of luck , TrendDiva

EURNOK: Buy Setup at Key Support ZoneOANDA:EURNOK is currently testing a significant demand zone. Previously, this area has acted as strong support, leading to bullish reactions. The recent decline into this zone suggests a potential for buyers to step in and drive prices higher.
A bullish confirmation, such as a strong rejection pattern, bullish engulfing candles, or long lower wicks, would increase the probability of a rebound. If buyers regain control, the price could move toward 11.7300 level.
This is not financial advice but rather how I approach support/resistance zones. Remember, always wait for confirmation, like a rejection candle or volume spike before jumping in.
Please boost this post, every like and comment drives me to bring you more ideas! I’d love to hear your perspective in the comments.
Best of luck , TrendDiva

GOLD Maintains Bullish Momentum, Targeting $2,840OANDA:XAUUSD has recently broken out above a key resistance zone and successfully retested it as new support, subsequently rebounding and maintaining its position within the ascending channel. This solidifies the bullish structure, with buyers stepping in at the newly reclaimed support.
The next potential upside target is around $2,840, in line with the upper boundary of the channel. However, short-term pullbacks within the structure remain probable, particularly near mid-channel levels.
As long as Gold holds above the support zone, the bullish momentum remains intact. A break below this support would invalidate the current setup and shift focus back to lower support levels.
This is not financial advice but rather how I approach support/resistance zones. Remember, always wait for confirmation, like a rejection candle or volume spike before jumping in.
Please boost this post, every like and comment drives me to bring you more ideas! I’d love to hear your perspective in the comments.
Best of luck , TrendDiva

GBPCAD Approaching Key Resistance — Will Sellers Step In?OANDA:GBPCAD is approaching a key resistance zone, a level previously met with strong selling pressure. The market has rejected this level before, indicating the presence of supply and reinforcing the potential for another move lower.
If bearish confirmation follows—such as rejection wicks or strong bearish candles—this could trigger a continuation to the downside, with 1.80080 as the next key target.
However, a breakout above this resistance would invalidate the bearish bias, shifting focus toward higher levels.
This is not financial advice but rather how I approach support/resistance zones. Remember, always wait for confirmation, like a rejection candle or volume spike before jumping in.
Please boost this post, every like and comment drives me to bring you more ideas! I’d love to hear your perspective in the comments.
Best of luck , TrendDiva

AUDNZD – Potential Long from Key Support ZoneOANDA:AUDNZD is approaching a key demand zone, which has previously led to bullish reversals. The recent downward move brings price into this support area, signaling a potential opportunity for buyers to step in.
A bullish confirmation, such as a strong rejection pattern, bullish engulfing candle, or long lower wick, would support the likelihood of an upward move. If buyers regain control, the price could rally toward 1.10500.
This is not financial advice but rather how I approach support/resistance zones. Remember, always wait for confirmation, like a rejection candle or volume spike before jumping in.
Please boost this post, every like and comment drives me to bring you more ideas! I’d love to hear your perspective in the comments.
Best of luck , TrendDiva

GBPNZD Approaching Key Resistance – Potential Sell SetupOANDA:GBPNZD is approaching a critical resistance zone that has previously attracted strong selling interest, making it a key level to watch.
If rejection signals appear, such as bearish engulfing candles or increased selling volume, I anticipate a move toward 2.19900. However, if the resistance fails to hold, it may open the door for further upside.
This is not financial advice but rather how I approach support/resistance zones. Remember, always wait for confirmation, like a rejection candle or volume spike before jumping in.
Please boost this post, every like and comment drives me to bring you more ideas! I’d love to hear your perspective in the comments.
Best of luck , TrendDiva

NZDHUF – Potential Long from Key Support ZonePEPPERSTONE:NZDHUF has reached a key support level, which has historically acted as a strong demand zone, leading to bullish reversals. The recent decline into this area suggests a potential opportunity for buyers to regain control and push prices higher.
A bullish confirmation, such as a strong rejection pattern, bullish engulfing candle, or long lower wick, would strengthen the case for an upward move. If buyers step in, price could rally toward 222.600. This setup aligns with a short-term bullish outlook within the broader market structure.
This is not financial advice but rather how I approach support/resistance zones. Remember, always wait for confirmation, like a rejection candle or volume spike before jumping in.
Please boost this post, every like and comment drives me to bring you more ideas! I’d love to hear your perspective in the comments.
Best of luck , TrendDiva

EURUSD - Sell Setup After Key Support BreakOANDA:EURUSD has decisively broken below a key trendline, signaling an increase in bearish momentum. This breakdown suggests that sellers are gaining control, with the potential for further downside continuation.
In the near term, price may revisit the breakout level for a retest, where the previous support could now act as resistance. A failure to reclaim this level would reinforce bearish sentiment, increasing the likelihood of renewed selling pressure. If sellers maintain dominance, the price may head toward the 1.03120 level.
For confirmation of continued downside movement, traders should look for bearish technical signals, such as a rejection wick, a bearish engulfing candlestick, or increased selling volume. Conversely, a sustained move back above the resistance level could invalidate the bearish setup and shift the bias toward a potential bullish recovery.
This is not financial advice but rather how I approach support/resistance zones. Remember, always wait for confirmation before jumping in.
Please boost this post, every like and comment drives me to bring you more ideas! I’d love to hear your perspective in the comments.
Best of luck , TrendDiva

CADJPY - Buy Setup at Clear Support LevelOANDA:CADJPY is approaching a strong support zone, an area that has previously attracted buyers. The recent bearish momentum has pushed price closer to this zone, making it a key level to watch for potential buying interest.
If buyers step in and confirm the support with bullish price action—such as rejection wicks, bullish engulfing candles, or increasing buying volume—I anticipate a move toward 107.710. However, if price breaks below this level, it could signal further downside and invalidate the bullish outlook.
This is not financial advice but rather how I approach support/resistance zones. Remember, always wait for confirmation, whether it’s a strong rejection candle or a spike in volume, before making a move.
Your support means the world! Every like and comment motivates me to share more insights. Also, let me know your thoughts in the comments—I’d love to hear your perspective!
Best of luck , TrendDiva

BITCOIN Reaches Critical Level - Will Bitcoin Sell Off?COINBASE:BTCUSD is reached a significant resistance zone, aligning with past price rejections and a strong supply area. This region has historically triggered strong selling pressure, making it a key level to watch.
If price struggles to break higher and forms bearish signals—such as rejection wicks, a bearish engulfing candle, or a shift in order flow—a pullback toward $102,500 could follow. This would confirm sellers stepping in to defend the level.
However, if BTC manages a strong breakout and holds above resistance, bullish momentum could extend further, invalidating the short setup.
Just my take on support and resistance zones—not financial advice. Always confirm your setups and trade with solid risk management!
Please boost this post, every like and comment drives me to bring you more analyses!
Best of luck , TrendDiva

GOLD at Critical Resistance – Reversal Incoming?OANDA:XAUUSD is trading at a key resistance zone, a level where sellers have previously taken control. If buyers fail to break through, we could see a rejection that sends the price lower toward $2,740.
I anticipate a move downward if we get bearish confirmation—such as rejection wicks, a bearish engulfing candle, or weakening buying pressure. However, a strong breakout and sustained hold above this zone could invalidate the setup, shifting momentum bullish and opening the door for new highs.
This is not financial advice but rather how I approach support/resistance zones. Remember, always wait for confirmation, like a rejection candle or volume spike before jumping in.
Please boost this post, every like and comment drives me to bring you more ideas! I’d love to hear your perspective in the comments.
Best of luck , TrendDiva

Platinum Approaching Key Resistance — Will It Drop to 1,010$?OANDA:XPTUSD is approaching a significant resistance zone, an area where sellers have previously stepped in to drive prices lower. This area has historically acted as a supply zone, making it a key level to watch for potential rejection.
If price struggles to break above and we see bearish confirmation—such as rejection wicks, a bearish engulfing candle, or weakening bullish momentum—I anticipate a pullback toward the $1,010 level. However, a strong breakout and hold above resistance could invalidate the bearish outlook, potentially opening the door for further upside.
This is not financial advice but rather how I approach support/resistance zones. Remember, always wait for confirmation, like a rejection candle or volume spike before jumping in.
Please boost this post, every like and comment drives me to bring you more ideas! I’d love to hear your perspective in the comments.
Best of luck , TrendDiva

Bullish Setup on CHFJPY — Watching for Confirmation!OANDA:CHFJPY has reached a critical demand area where buyers have previously stepped in, leading to strong bullish momentum. This zone has historically provided a solid base for upward momentum, making it a key level to watch.
If we see bullish confirmation—such as rejection wicks, bullish engulfing candles, or a surge in buying volume—I anticipate a move toward 171.180, aligning with previous market structure. However, a decisive breakdown below this zone could weaken the bullish outlook and shift momentum downward.
This is not financial advice but rather how I approach support/resistance zones. Remember, always wait for confirmation, like a rejection candle or volume spike before jumping in.
Please boost this post, every like and comment drives me to bring you more ideas! I’d love to hear your perspective in the comments.
Best of luck , TrendDiva

ORANGE JUICE Testing Key Support: Will Buyers Step In?FUSIONMARKETS:OJ has reached a significant demand area that has historically attracted buyers, leading to bullish momentum. This support level aligns with prior price reactions and represents a strong foundation for potential upward moves.
If the support holds and bullish confirmation appears, such as bullish engulfing candles or long lower wicks, I anticipate a move toward 502.70 level. Conversely, if the support is broken, the bullish outlook could weaken, paving the way for further declines.
This is not financial advice but rather how I approach support/resistance zones. Remember, always wait for confirmation, like a rejection candle or volume spike before jumping in.
Please boost this post, every like and comment drives me to bring you more ideas! I’d love to hear your perspective in the comments.
Best of luck , TrendDiva

EURGBP - Bearish Setup at Key ResistanceThe EURGBP pair is approaching a notable supply zone, where sellers have previously regained control and driven prices lower. This area has historically acted as resistance, suggesting the potential for bearish continuation.
A confirmation of selling pressure, such as a bearish engulfing pattern or multiple rejection wicks at the resistance level, would increase the likelihood of a downward move. If the selling momentum materializes, the price could target the 0.83586 level.
What are your thoughts on this outlook?

Platinum Testing Key Resistance - Reversal Ahead?OANDA:XPTUSD has reached a major resistance zone, where sellers have previously taken control. The current rally has been strong, but this level could act as a turning point if buyers start losing momentum.
If we see bearish confirmation—such as rejection wicks, bearish engulfing candles, or a drop in volume—I anticipate a move toward $971.78 level. A clear rejection here could fuel selling momentum, leading to further downside. However, if price breaks and holds above the zone, the bullish trend could extend higher.
This is not financial advice but rather how I approach support/resistance zones. Remember, always wait for confirmation, like a rejection candle or volume spike before jumping in.
Please boost this post, every like and comment drives me to bring you more ideas! I’d love to hear your perspective in the comments.
Best of luck , TrendDiva

AUDJPY - Buy Opportunity at Key Support LevelOANDA:AUDJPY is approaching a significant support zone, where buyers have previously stepped in, leading to strong bullish reactions. The recent decline suggests a potential buying opportunity if the price shows signs of reversal.
A bullish confirmation, such as a strong rejection candle or a bounce from support, could indicate a move toward 97.240. However, a break below the support zone could invalidate this setup, signaling further downside.
This is not financial advice but rather how I approach support/resistance zones. Remember, always wait for confirmation, like a rejection candle or volume spike before jumping in.
Please boost this post, every like and comment drives me to bring you more ideas! I’d love to hear your perspective in the comments.
Best of luck , TrendDiva

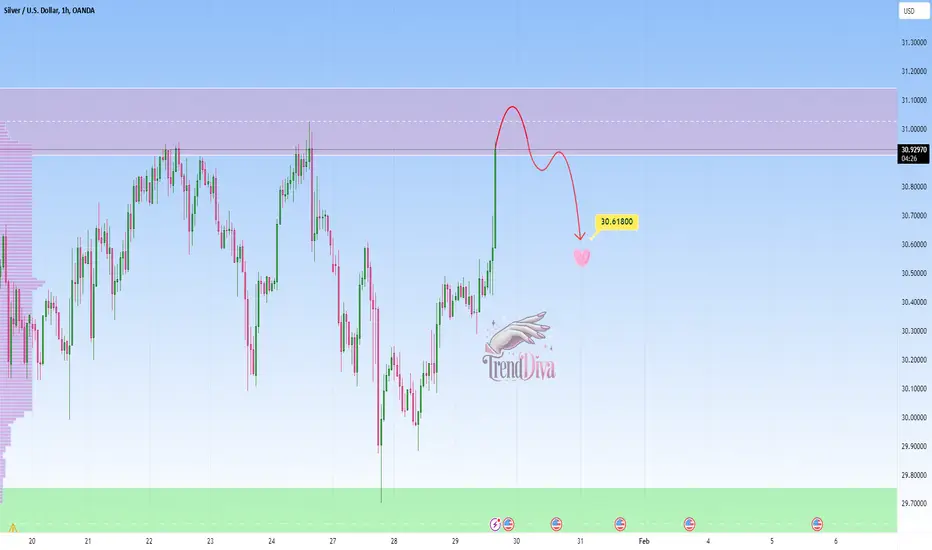
SILVER - Potential Short Setup at Key Resistance LevelOANDA:XAGUSD is currently testing a key resistance level, presenting a potential sell opportunity. If price fails to break above and holds below this resistance, a downward move towards 30.61800 could be expected.
A rejection at this level—confirmed by a bearish candlestick pattern or strong selling pressure—would strengthen the bearish outlook. Traders should watch for signs of failure to break resistance, which would support the short position. However, if the price breaks and closes above resistance, the bearish scenario would be invalidated, and the bias would shift to the upside.
This is not financial advice but rather how I approach support/resistance zones. Remember, always wait for confirmation, like a rejection candle or volume spike before jumping in.
Please boost this post, every like and comment drives me to bring you more ideas! I’d love to hear your perspective in the comments.
Best of luck , TrendDiva
ZARJPY - Potential Long from Key Support ZoneOANDA:ZARJPY is currently testing a significant support zone. The recent decline into this zone suggests a potential for buyers to regain control and push prices higher.
A bullish confirmation, such as a strong rejection pattern, bullish engulfing candles, or long lower wicks, would indicate an increased likelihood of a move upward. If this scenario unfolds, the price may head toward the 8.350 level.
This setup aligns with a potential short-term rebound within the broader market structure.
This is not financial advice but rather how I approach support/resistance zones. Remember, always wait for confirmation, like a rejection candle or volume spike before jumping in.
Please boost this post, every like and comment drives me to bring you more ideas! I’d love to hear your perspective in the comments.
Best of luck , TrendDiva

RTX Bullish Momentum – Move Toward $131.00 ExpectedNYSE:RTX is demonstrating strong bullish momentum, supported by moving averages and consistent upward strength in price action. The recent push above $125 confirms that buyers are in control, and suggests a likely continuation toward the $131.00 level.
A pullback toward $125–126 could provide an opportunity for buyers to step in, maintaining the rally's trajectory.
This setup aligns with the expectation of a bullish continuation, offering a potential long opportunity if pullbacks or consolidations occur near current levels.

NZDSGD - Potential Long from Key Support ZoneOANDA:NZDSGD is approaching a key support level that has previously acted as a strong demand zone, leading to bullish momentum. The recent decline into this area suggests a potential opportunity for buyers to step in and push prices higher.
A bullish confirmation, such as a strong rejection pattern, bullish engulfing candle, or long lower wick, would increase the likelihood of an upward move. If buyers regain control, the price may head toward the 0.76630 level. This setup indicates a potential short-term rebound within the broader market structure
This is not financial advice but rather how I approach support/resistance zones. Remember, always wait for confirmation, like a rejection candle or volume spike before jumping in.
Please boost this post, every like and comment drives me to bring you more ideas! I’d love to hear your perspective in the comments.
Best of luck , TrendDiva
