DISNEY Revisiting a 10 year Support LineThis Technical Analysis is on Disney (DIS), on the 2 Week timeframe.
Our Current Price action is TESTING SUPPORT on this MASSIVE Decade Long SUPPORT LINE.
The 1st time we have ever tested SUPPORT on this was September 29th, 2014.
Highlighted by the RED circles, everytime we've tested this we've had some sort of Price Bounce.
The Most massive gains were from the Bottom of the COVID Crash to the TOP @ approx. $202.00
A Gain of about 154%.
It was also a more evident time to buy as the RSI gave hints along with some other indicators.
Another one being the GOLDEN CROSS where 2 week 21 EMA CROSSED Above 2 week 50 SMA .
Whats happening now?
Currently our 2 week candle, has not yet closed. It will do so August 14th. We will give more clues then. If we maintain support thats GOOD, If we see ourselves below it, and CONFIRM BELOW that would be VERY BAD. This would mean we have broken a 10 year SUPPORT LINE.
We have also had a DEATH CROSS, which is when 21 EMA CROSS below the 50 SMA. This often times causes price to fall as we've recently seen. The moving averages currently seems like there pointing downwards, indicating that price can still drop more.
I would like to see the Moving Averages to flatten out at 180 degrees. To have this happen price needs to bounce from here.
Price is also currently in a downward channel.NOTE how the lower trend line of the channel is below the MAJOR RESISTANCE.
It can be possible that we test this.
Notice the BLACK ARROWS on the RSI and MACD. If you relate them to the lower trend line of the downward channel on Price action. This shows a BULLISH DIVERGENCE. Which is a sign of potential BULLISH MOVE UP.
Bullish Divergence = When Price action shows LOWER LOWS but the indicators show HIGHER LOWS. Usually means price is lagging behind the indicators and eventually PRICE will increase to catch up to the indicators. In normal instances, price moves in sync with indicators.
If PRICE moves BELOW the SUPPORT, its possible we touch this area indicated by the BLACK ARROW, which coincides with the horizontal black line that touches the previous candle wicks. This would put the BULLISH DIVERGENCE at play. Look to see in the upcoming weeks what happens.
Some danger signs are seen in the indicators:
RSI -> Currently our ORANGE RSI Line as moved below the BLACK Moving Average. If you look left it has always been associated with price drops. If we continue to stay below, risk of price drop remains.
MACD-> Notice how the size of the GREEN histograms have been decreasing, indicating a slow down on MOMENTUM. If we don't see bigger GREEN histograms print, next likely thing is the appearrance of RED Histograms which will indicate increased probability of PRICE going down.
ADX -> Highlighted zone shows RED LINE above GREEN. This indicates that bearish momentum is present. As long as RED line is ABOVE GREEN, likelyhood of bearish momentum and price falling is probable.
CONCLUSION:
Disney has reached the CRITICAL SUPPORT line for the 5th time in the 10 year history of this SUPPORT LINE. Everytime when it did so as seen in previous history, its been known to be decent area to BUY. Is it a good area to buy? In my opinion its hard to tell in this moment. For one, we should wait till the close of this CURRENT 2 week candle on the 14th of August. Something to note, everytime we test a trendline, support or resistance, each time it gets weaker. Keeping this in mind, with the warning signs in the indicators and a potential BULLISH DIVERGENCE, a scenario that can be possible: we break it, to test the lower trend line of the Downward channel, only to have prices MOVE BACK UP. But its important to state that this doesn't have to happen either. We need to be patient and observe what is to come in the coming weeks. Zooming into the smaller timeframes, can also give more concrete short-term clues on direction. Stay tuned for updates on other timeframes.
Thank you for your time! Please do support this idea and my work by boosting, following and commenting. Follow for updates and ideas on other trade-ables.
If you have any questions do reach out. Thank you again.
DISCLAIMER: This is not financial advice, i am not a financial advisor. The thoughts expressed in the posts are my opinion and for educational purposes. When trading always spend majority of your time on risk management strategy.
Support_level

HINDUNILVR AT SUPPORT !!!Hello to everyone
Hindunilvr tradind near demand zone ..2420--2460. If price respects this level than We can see a reversal from the support level in coming days.If price taken support from the support level than we can see target of 2525--2600++ In next coming day's.
If price breaks the level of 2620 than support level will breakdown and price can move towards the downside.
Traders, if you liked this idea or if you have your own opinion about it, write in the comments. I will be glad.

GTLS: Watching Diversified IndustrialsThe Diversified Industrials Industry is expected to have good growth this year. GTLS is in that industry.
The stock is developing a bottom with intermittent institutional accumulation at a strong support level from 2022.
Percentage of Shares Held by Institutions is very high.
When the bottom completes, this will be a good candidate for all styles of trading, from short-term to long-term.

MUTHOOT FINANCE AT CRUCIAL SUPPORT LEVEL !!Hello to everyone
Price trading near strong demand zone. If price respects the support level of... 950--945, than we can expect a good move in price towards the upside and if price breaks the support level than price will go down to fulfill their the downward targets.
#MUTHOOTFIN
👉Add to your watchlist.
👉Important demand level
👉Make or Break Level
👉Support 950-45
👉Above 950 full reversal possible for 1000/1040+
👉Fresh breakdown below 945

GBPAUD-4HGBPAUD is at a strong support level and has the potential to break up the descending Channel

AMZN: Moving into A Buy Zone?The Weekly Chart of AMZN shows that the stock has dropped into a strong support price level with a risk that there could be a Dark Pool Buy Zone here. The share price is now below fundamental values.
With a month before AMZN reports earnings, it will be interesting to see how the stock behaves; it will reveal how well AMZN is recovering from the hyper revenues created by the stay-at-home orders and stimulus checks of the pandemic. This is the last quarterly report that will be skewed with the revenues and earnings from the pandemic anomaly.
This company MUST provide a dividend soon.

NQ Power Range Report with FIB Ext - 9/27/2022 SessionCME_MINI:NQZ2022
- PR High: 11327.25
- PR Low: 11297.75
- NZ Spread: 66.0
Evening Stats (As of 12:15 AM)
- Weekend Gap: -0.23% (filled)
- 8/29 Weekend Gap: -0.18% (open > 13125)
- 8/19 Session Gap: -0.04% (open > 13540)
- Session Open ATR: 312.10
- Volume: 40K
- Open Int: 280K
- Trend Grade: Bear
- From ATH: -32.0% (Rounded)
Key Levels (Rounded - Think of these as ranges)
- Long: 12391
- Mid: 11820
- Short: 11248
Keep in mind this is not speculation or a prediction. Only a report of the Power Range with Fib extensions for target hunting. Do your DD! You determine your risk tolerance. You are fully capable of making your own decisions.

Nifty Important levels for Wednesday 01.06.22Here are some important levels for nifty for 01.06.2022- Nifty has formed double top in 75 min time frame, and in 15 min time frame it broke its previous swing low. Hence it can be considered in retrenchment mode if we consider daily time frame. In this case we have to wait for tomorrow’s opening to predict its resistances and support levels. If nifty crosses today’s low without breaking today’s high then the trend will be continued. In that case, major support levels will be at 16500, 16288 and 16066. If Nifty crosses the last support level of 16066, then it will again enter into bearish trend. For any opening below 16656 with negative price action crossing CPR at 16590 we can enter in a bearish trade. If nifty crosses 16700 level without breaking today’s low with positive price action, then only we can initiate bullish trade. In that case important resistance levels will be at 16821 and 16912
Highest CE side OI is present at 17000 and for PE side it is at 16500, but in pe side change of OI is in negative but in CE side change of OI is in positive which indicates bearishness in the market.
According to India vix at the closing time nifty range for Wednesday will be 210

ASX200 support remains from 6910Hi all, this morning, it's hard not to notice 6910 support on the ASX200 daily chart. Sellers once again breached the level but have again been unable to hold the break with buying developing in today's cash session.
We see this level as key support as it has held firm since April 2021. Green circles show the amount of times sellers have been unable to break the level since April. Interestingly, we've seen four moves higher after a level test. Today's idea is not a buy or a sell, it's more of a heads up.
We will be watching this level to see if any further ideas develop.

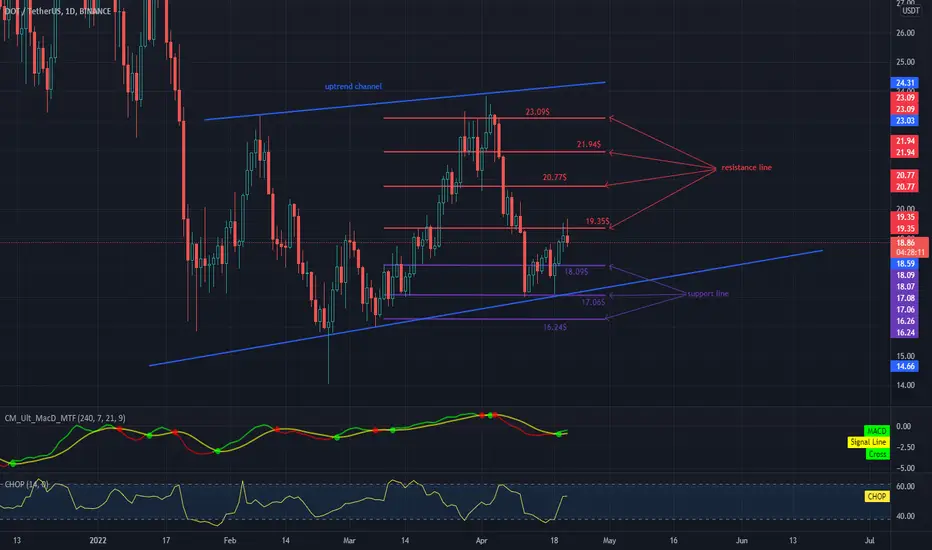
DOT possible breakout?Hello everyone, let's take a look at the DOT to USDT chart over the 1 day timeframe. As you can see, the price is moving in an uptrend channel marked with blue lines.
Let's start by determining the support lines with the Trend-Based Fib Extension tool and as you can see, the first support in the near future is $ 18.09, if the support breaks down, the next ones are $ 17.06 and $ 16.24.
Now let's move from the resistance line as the first resistance is $ 19.35, if you can break it the next resistance will be $ 20.77 and $ 21.94 plus $ 23.09.
Looking at the CHOP indicator, we can see that in the 1-day range we are starting to gain more and more energy, and the MACD indicator shows that an uptrend has started.
Bitcoin - Key levelsAs stated on a previous Idea, BTC/ USDT is trading on a Modified Schiff Pitchfork since 2020.
BTC/ USDT is currently trading inside an ascending channel (White). The Upper Channel Line is the multi month trendline (Bold Yellow) that we broke in January.
If we reclaim the 0.236 Fibo and the level 1.5 (Purple Trend) of the Modified Schiff Pitchfork as support, we could expect a move to the upside, the first stop would be the 0.382 Fibo and we should be very cautious around this level, a huge Overlap is waiting us as resistance, combined with the 200 SMA Daily and the multi month trendline / Upper Channel Line.
If BTC can't reclaim the 0.236 Fibo and the level 1.5 (Purple Trend) of the Modified Schiff Pitchfork, we could expect a rejection to the lower level of the Modified Schiff Pitchfork (Pink Trend and Red Trend)

Mahindra & Mahindra Positional Trade IdeaWe are at the end of March and M&M's monthly chart has formed a huge pin bar which suggests bullishness.
I'm buying M&M at current market price (793) for a target of 979 in the next 3-4 months. This is a Positional trade, so no stop loss. NSE:M_M

AAVAS looks like reversal Showing strong sign of reversal from Area of Support, RSI - Oversold.
Watch for tomorrow movement - if closes green with confirmation - go long.
Good opportunity stock.
Follow for more ideas and share your thoughts in comment box.

That looks like great support to me... Many touches and support at this price from last consolidation, always wait for confirmation and then attack.
We can see the daily MACD giving us a good entry after this consolidation over the support line, last time price was at this levels and the MACD gave us this signal ADA when nuts doing over 180% in 40 days.
We always try to look for the trap in our own analysis, as we had a fakeout MACD signal last october, and, although it wasn't at the same levels or resistance, it might be our bear signal if it develops the same.
You can start DCA'ing from this resistance or wait for confirmation if breaks from this reversal pattern
"Don't trade withouth an strategy"

GBPUSD LONG IDEAHey guys, this pair has been on a strong bearish trend. However, after the run on stops seen on the daily chart, i expect it to go up.

NEOUSD Target Price 60.05NEOUSD Pin Bar EMA 10 EMA 20 Horizontal Support Level and 50% Fibonacci Retracement Level

EURUSD long position eurusd is making double bottom at 1.18500 demand zone and its also the daily pivot point and very strong support area
look for bullish confirmation on lower time frames and enter long with your own money management
always remember that patience is the key to become a successful trader in financial world

S&P 500 Key Levels to Lookout ForAfter a strong sell off -59pts or -1.39% (supply) for S&P 500 on last Friday, 18 June 2021, this is a potential start of a market correction.
Here are 2 key support levels to mark on the charts if index continues to fall.
1st Level: 3,850
High Volume Area
Fibo Retracement of 23.6%
10% fall from Peak
2nd Level: 3,400
High Volume Area
Fibo Retracement of 38.2%
20% fall from Peak

USDJPY in buyers controllBased on the chart, price previously broke a major resistance area and now a pull back (or maybe a correction) has completed. We can clearly see that the power of sellers at this area decreased and today a good rejection is about to happening (which can be a good sign of buyers power at this area). So based on the mention scenarios, I prefer to be buyer at this area with a good risk reward ratio(1:3.5).
Note: As always please take risk management rules into consideration before opening any position on the market.
Good Luck!

TWITTER ADD TWITTER AT 53$/43.5$
WE SEEN 59$/64$/73$/78$
VIEW INVALID BELOW37.5$ CB SL
NOTE : VIEW ONLY FOR EDUCATION PURPOSE.

bulls push the EJ up...price is under monthly and weekly historical resistance.if resistance hold the price then can expect price to test the 131.00 support zone.but if price break the resistance then we can expect it to go to next level at 133.50 then 137.00 as a strong resistance.
in daily time frame support zone at 131.00 keep the price and push it up so we are bullish on EJ for now.

Peloton is waiting for a rebound The $100 seems to be a good support level for this stock, which, in turn, is anchored at the 252 EMA.
If it respects it and reacts, it can go back to at least $120 on a rebound.
NASDAQ:PTON

USDCAD - Sideway bounceA buying opportunity on USDCAD presents itself as a sideway bounce setup. Trade has engaged.
