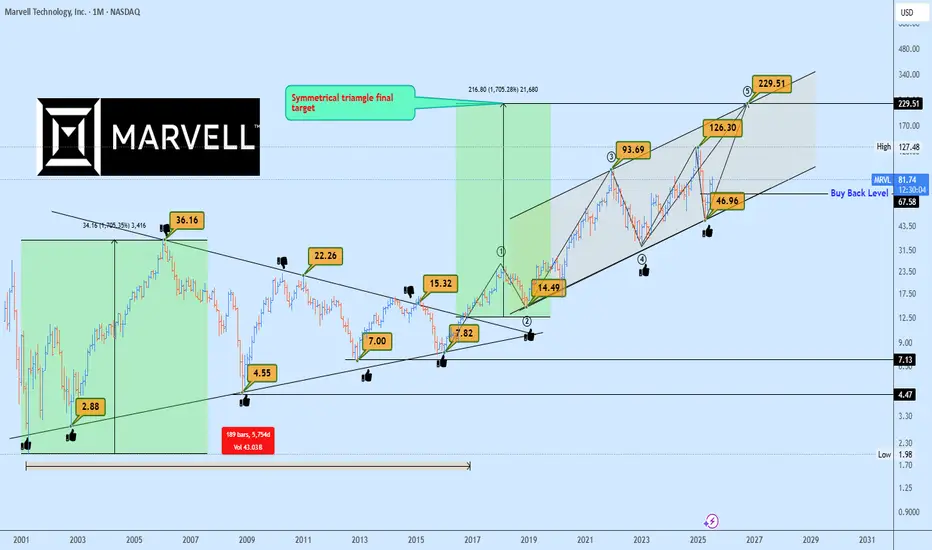
MRVL Massive 15-Years Symmetrical Breakout Targets AheadMarvell Technology (MRVL) has just completed a monumental breakout from a 15-years symmetrical triangle, a rare and powerful long-term accumulation structure. This type of macro consolidation typically precedes a major directional expansion, and in this case, the breakout confirmed bullish continuation.
Currently, MRVL is forming a rising channel structure, with price bouncing cleanly from the lower boundary confirming demand and the continuation phase of the macro move.
The 1:1 projection from the symmetrical triangle gives us a clear target trajectory, with the final leg potentially extending to $229, aligning perfectly with the upper boundary of the rising channel.
In the short to mid-term, the ideal buyback opportunity rests near $67.50, should the market retest previous breakout support or the lower boundary of the channel once more. This zone offers asymmetric risk-to-reward potential for long-term investors and swing traders alike.
Key Targets
📈 $67.50 – Buyback Opportunity Zone
📈 $229 – Rising Channel Top / 1:1 Expansion Target
A breakout this large is no coincidence, it’s backed by years of price compression and institutional positioning. Now is the time to watch closely.
📩 Drop your view in the comments and share your stock requests for quick analysis.
Only stock assets will be accepted under this post.
Support and Resistance
Bitcoin stop loss hunting end, entry for Long is now!!Hi on this chart that may happen with more than 70% possibility we have one of the easy setups and strategy which i call it FAKEOUT&LIQUIDTY this happen usually near trendline support or range zone support or even resistance and after a possible fakeout usually market kick sellers or Buyers and then with high volume market reverse.
I saw High volume and Fake breakout in my mind and i think it can be one of those times so we open long and lets now wait for this 1:2(Risk:Reward) signal to play.
DISCLAIMER: ((trade based on your own decision))
<<press like👍 if you enjoy💚

Gold Rejected at 3315 – But Bulls Might Not Be Done Yet📌 What happened yesterday?
During the Asian session, Gold printed a fresh local low at 3268, continuing the downtrend that already dropped over 1700 pips in just one week. However, that move quickly reversed, and we saw a natural corrective bounce.
📈 Resistance holds firm
The correction took price back up into the 3310 zone, which acted as confluence resistance. After two taps into that area, price failed to sustain above 3300, indicating sellers are still active there.
❓ Is the upside correction over?
I don't think so. The recent drop has been choppy, lacking the strong momentum of previous legs. This type of price action often signals that we are still within a correction, not in a clean continuation.
📊 What am I watching?
I’m actively monitoring for:
• Exhaustion signs on the downside
• Upside reversal signals
My plan is to open long trades only when I see confirmation, aiming for a move back toward the 3330 zone, which could act as resistance.
Disclosure: I am part of TradeNation's Influencer program and receive a monthly fee for using their TradingView charts in my analyses and educational articles.

CADCHF: Bullish Continuation After Consolidation📈 CADCHF was consolidating for almost a month in a horizontal range on the daily chart.
Following a significant bullish surge, it broke above resistance yesterday.
The price is likely to continue rising, with targets set at 0.5913 and 0.5940.

GOLD - Price can fall to support level and then start to riseHi guys, this is my overview for XAUUSD, feel free to check it and write your feedback in comments👊
The price was consolidating for an extended period inside a wide, horizontal range.
A strong bullish impulse eventually broke the price out above the resistance of that flat channel.
This breakout move created a new significant high before sellers forcefully rejected the price downwards.
This rejection marked the beginning of the current falling wedge pattern, which has guided the price lower since.
The decline within the wedge has now brought the asset down to a critical historical support zone at $3285.
I expect that this key support will hold, causing a reversal and a new rally that targets the $3345
If this post is useful to you, you can support me with like/boost and advice in comments❤️
Disclaimer: As part of ThinkMarkets’ Influencer Program, I am sponsored to share and publish their charts in my analysis.

Mechanical vs. Anticipation Trades: The Fine LineWhen traders talk about discipline, they often refer to following rules — sticking to a plan, being methodical, and avoiding emotional decisions. But there's a subtle and powerful difference between being rule-based and being blindly mechanical. And even more, there's a moment in every trader’s process where discipline demands adaptation.
Let’s look at a recent trade on Gold to understand this better.
On Thursday, I published an analysis on Gold stating that the recent breakdown of support had turned that zone into resistance. A short entry from that level made sense.
It was mechanical, clean, and aligned with what the chart was showing at the time.
And, at first, it worked. Price rose into the resistance area and dropped. Perfect reaction. Textbook setup. Confirmation. The kind of trade you want to see when following a rule-based system.
But then something changed.
Price came back. Quickly.(I'm talking about initial 3315-3293 drop and the quick recover)
So, the very next rally pushed straight back into the same resistance area, hmmm...too simple, is the market giving us a second chance to sell?
That was the first sign that the market might not respect the previous structure anymore.
It dipped again after, but the second drop was different: slower, weaker, choppier.
That told me one thing: the selling pressure was fading.
So I shifted. From mechanical execution to anticipatory mindset.
This is where many traders struggle — not because they don’t have a system, but because they don’t know when to let go of it. Or worse: they abandon it too quickly without cause.
In this case, the evidence was building. The failed follow-through. The loss of momentum. The compression in structure. All signs that a reversal was brewing.
Rather than continuing to blindly short, referring to a zone that no longer held the same weight, I started looking for the opposite: an upside breakout and momentum acceleration.
That transition wasn’t based on emotion. It was based on market behavior.
________________________________________
Mechanical vs. Anticipation: What’s the Real Difference?
A mechanical trade is rule-based:
• If X happens, and Y confirms, then enter.
• No need for interpretation, no second guessing.
• It can (in theory) be automated.
An anticipatory trade is different:
• It’s about reading intent in price action before confirmation.
• Higher risk usually, but higher reward if you’re right.
• Can’t be automated. It requires presence, experience, and context.
And the tricky part? Often, we lie to ourselves. We say we’re "mechanical" while actually guessing. Or we think we’re being smart and intuitive, when in fact, we’re being impulsive.
The key is awareness.
In my Gold ideas, the initial short was mechanical. But the invalidation came quickly — and I was alert enough to switch gears. That shift is not a betrayal of discipline. It’s an upgrade of it.
________________________________________
Final Thoughts:
Discipline is not doing the same thing no matter what. Discipline is doing what the market requires you to do, without emotional distortion.
And that, often, means walking the fine line between the setup you planned for, and the reality that just showed up.
Disclosure: I am part of TradeNation's Influencer program and receive a monthly fee for using their TradingView charts in my analyses and educational articles.

THE KOG REPORT - NFPTHE KOG REPORT – NFP
This is our view for NFP, please do your own research and analysis to make an informed decision on the markets. It is not recommended you try to trade the event if you have less than 6 months trading experience and have a trusted risk strategy in place. The markets are extremely volatile, and these events can cause aggressive swings in price.
Following on from the FOMC KOG Report which worked quite well, we’ll stick with the same chart and for today suggest caution. It’s the first day of the month and the last day of the weekly candle. The close here for gold is important and will give us further clues to the next few months.
We’ve shared the red boxes and the red box targets are below. There is a key level above 3306-10 which will need to be breached to correct the move back up to the 3330-34 region for the weekly close. However, we now have an undercut low which is potential if there is more aggressive downside to come and that level is sitting around the 3240-50 region which for us may represent an opportunity for a swing low. We’re a bit low and stretched here to short and as we’ve already hit our target for the day so we’ll wait for the extreme levels and if hit and our indicators line up, we may take some scalps. Otherwise, as usual on these events, the ideal trade will come next week.
RED BOXES:
Break above 3290 for 3295, 3306, 3310 and 3320 in extension of the move
Break below 3275 for 3267, 3260, 3255 and 3250 in extension of the move
Please do support us by hitting the like button, leaving a comment, and giving us a follow. We’ve been doing this for a long time now providing traders with in-depth free analysis on Gold, so your likes and comments are very much appreciated.
As always, trade safe.
KOG

AUDUSD Potential UpsidesHey Traders, in today's trading session we are monitoring AUDUSD for a buying opportunity around 0.64000 zone, AUDUSD is trading in an uptrend and currently is in a correction phase in which it is approaching the trend at 0.64000 support and resistance area.
Trade safe, Joe.

EURUSD - New Bearish Move!Hello Traders !
The EURUSD broke the support level (1.14810 - 1.14463).
This key level becomes new resistance!
So, I expect a bearish move📉
_______________
TARGET: 1.12955🎯

GBPUSD shows signs of a potential recoveryGBPUSD shows signs of a potential recovery towards the resistance zone. This price action indicates a possible short-term reversal or consolidation phase. We are currently observing for confirmation signals such as:
These could signal a build-up for a move back toward the key resistance at 1.34400. Traders should stay alert for price behaviour near this level as it may act as a turning point or breakout trigger.
You may find more details in the chart.
Trade wisely best of luck buddies.
Ps: Support with like and comments like for better analysis.

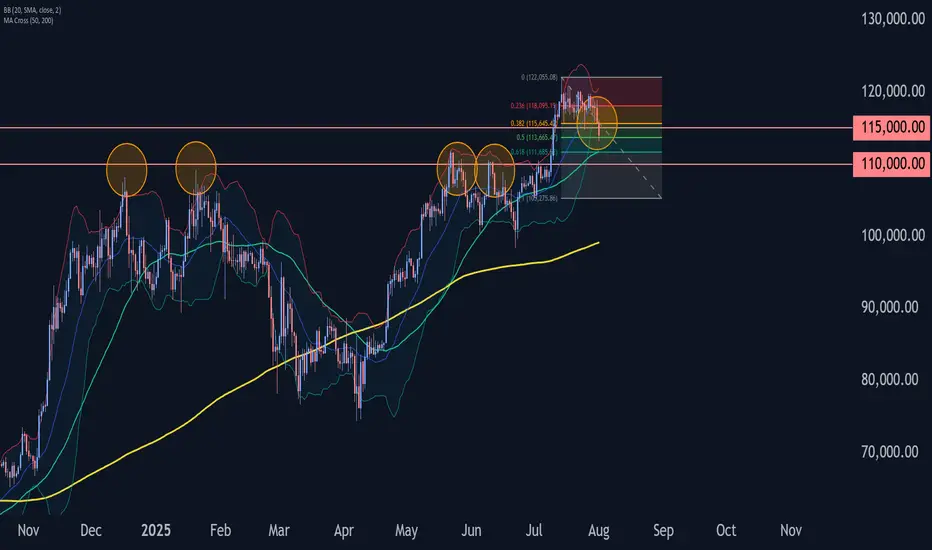
Bitcoin Wave Analysis – 1 August 2025- Bitcoin broke the pivotal support level 115000.00
- Likely to fall to support level 110000.00
Bitcoin cryptocurrency recently broke below the pivotal support level 115000.00, coinciding with the 50% Fibonacci correction of the sharp upward impulse from the start of July.
The breakout of the support level 115000.00 strengthened the bearish pressure on Bitcoin.
Given the bearish sentiment seen across the cryptocurrency markets today, Bitcoin can be expected to fall to the next support level at 110000.00 (former resistance from May and June).
Those daily +20% to +30% candles soon will appear!!Those Fibonacci levels which are last supports for healthy & #Bullish market are all touching i mean the 0.218$(0.5 #Fibonacci) & 0.202(0.61 #Fibonacci) and i think these supports are strong enough to stop the correction and soon again it will pump and even can break daily high near 0.42$ and hit targets like 0.5$ and 0.75$.
DISCLAIMER: ((trade based on your own decision))
<<press like👍 if you enjoy💚

AUD/JPY LONG AUD/JPY LONG " break of a resistance area and retest it + 38.2% fib retracement + 50 and 200 ema dynamic support + risk on environment "

GOLD (XAUUSD): Bearish Continuation Ahead?!
Gold retested a recently broken significant liquidity cluster.
I see a clear sign of strength of the sellers after its test
with multiple intraday confirmation.
I think that the price will retrace to day to 3276 level.
❤️Please, support my work with like, thank you!❤️
I am part of Trade Nation's Influencer program and receive a monthly fee for using their TradingView charts in my analysis.

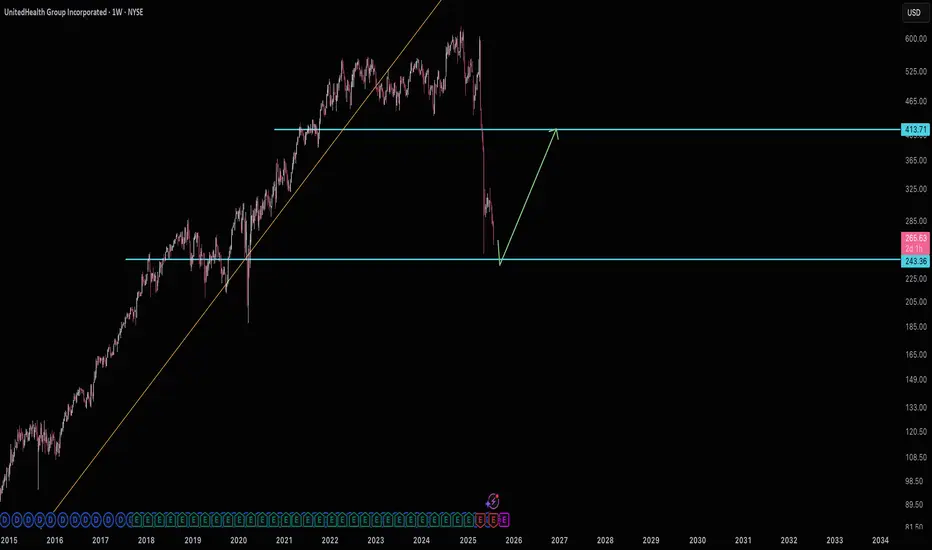
Waiting for $243 United HealthUNH has obviously taken a beating. It's managed to get so close to support many a few times now, yet hasn't hit yet. So if $243 does hit, then plan on targeting $410.
Good luck!
Bitcoin: New All-Time High — What’s Next?Bitcoin had an incredible run, breaking the old all-time high ($111,980) with strong bullish momentum and setting a fresh ATH at $123,218 (Binance). We just witnessed the first major corrective move of ~6% and a decent bounce so far — but the big question is:
What’s next? Will Bitcoin break higher over the summer or form a trading range here?
Let’s dive into the technicals.
🧩 Higher Timeframe Structure
May–June Range:
BTC was stuck between $110K–$100K, forming an ABC corrective pattern. Using trend-based Fib extension (TBFE) from A–B–C:
✅ C wave completed at $98,922 (1.0 TBFE)
✅ Upside target hit at $122,137 (-1 TBFE)
Full Bull Market TBFE:
➡️ 1.0 → $107,301 → previously rejected
➡️ 1.272 → $123,158 → recent rejection zone
Pitchfork (log scale):
➡️ Tapped the upper resistance edge before rejecting.
Previous Bear Market Fib Extension:
➡️ 2.0 extension at $122,524 hit.
2018–2022 Cycle TBFE:
➡️ 1.618 at $122,011 tapped.
Macro Fibonacci Channel:
➡️ Connecting 2018 low ($3,782), 2021 ATH ($69K), 2022 low ($15,476) →
1.618–1.666 resistance band: $121K–$123.5K.
✅ Conclusion: Multiple fib confluences mark the $122K–$123K zone as critical resistance.
Daily Timeframe
➡️ FVG / Imbalance:
Big daily Fair Value Gap between the prior ATH and $115,222 swing low.
BTC broke the prior ATH (pATH) without retest → a pullback to this zone is likely.
Lower Timeframe / Short-Term Outlook
We likely saw a completed 5-wave impulse up → now correcting.
The -6% move was probably wave A, current bounce = wave B, next leg = wave C.
➡ Wave B short zone: $120K–$121K
➡ Wave C target (1.0 TBFE projection): ~$113,326
➡ Confluence at mid-FVG + nPOC
Trade Setups
🔴 Short Setup:
Entry: $120,300–$121,000
Stop: Above current ATH (~$123,300)
Target: $113,500
R:R ≈ 1:2.3
🟢 Long Setup:
Entry: Between Prior ATH and $113,000
Stop: Below anchored VWAP (~$110,500)
Target: Higher, depending on bounce confirmation.
🧠 Educational Insight: Why Fibs Matter at Market Extremes
When markets push into new all-time highs, most classic support/resistance levels disappear — there’s simply no historical price action to lean on. That’s where Fibonacci extensions, channels, and projections become powerful tools.
Here’s why:
➡ Fibonacci extensions (like the 1.272, 1.618, 2.0) help estimate where trend exhaustion or profit-taking zones may appear. They are based on the psychology of crowd behavior, as traders anchor expectations to proportional moves from previous swings.
➡ Trend-Based Fib Extensions (TBFE) project potential reversal or continuation zones using not just price levels, but also the symmetry of prior wave moves.
➡ Fibonacci channels align trend angles across multiple market cycles, giving macro context — like how the 2018 low, 2021 ATH, and 2022 low project the current 1.618–1.666 resistance zone.
In short:
When you don’t have left-hand price history, you lean on right-hand geometry.
That’s why the $122K–123K zone wasn’t just random — it’s a convergence of multiple fib levels, cycle projections, and technical structures across timeframes.
⚡ Final Thoughts
Bitcoin faces major resistance around $122K–$123K backed by multiple fib and structural levels. A retest of the prior ATH zone (~$112K–$113K) looks probable before the next big directional move. Watch lower timeframe structure for signs of completion in this corrective phase.
_________________________________
💬 If you found this helpful, drop a like and comment!
Want breakdowns of other charts? Leave your requests below.

Solana coin Long setupIn this video I go through the current price action and talk about how the 126$ target level was recently reached for a clean long entry and on the daily timeframe we printed a higher low .
I expand on my thoughts for a continuation to the upside and to retest some higher levels of resistance 180$s and time will tell if we print a higher high at the 180$s before retesting the $200 zone .

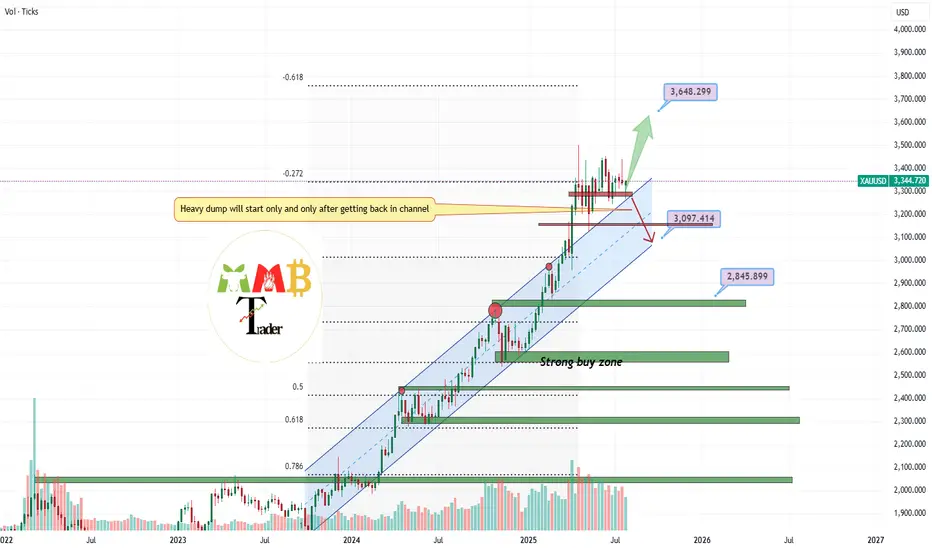
GOLD channel breakout retest complete more pump ahead As we can see the blue channel resistance is gone and also now it turn to strong and valid support and retest is also complete and gold is now targeting 3600$ easy.
DISCLAIMER: ((trade based on your own decision))
<<press like👍 if you enjoy💚
DeGRAM | GBPUSD is forming the falling wedge📊 Technical Analysis
● GBPUSD is attempting a reversal from the lower boundary of a descending channel after forming a short-term double-bottom near 1.3138.
● Price is now climbing toward 1.3258 resistance, supported by bullish divergence and a break of the local falling wedge.
💡 Fundamental Analysis
● The USD is under pressure ahead of key NFP data, as ISM manufacturing misses weighed on Treasury yields.
● Positive UK PMI and consumer lending data have supported GBP, with BoE policy expectations firming above neutral.
✨ Summary
Long bias above 1.3138. Breakout targets 1.3258 ➜ 1.3423. Setup valid while price holds above 1.3110 support.
-------------------
Share your opinion in the comments and support the idea with a like. Thanks for your support!

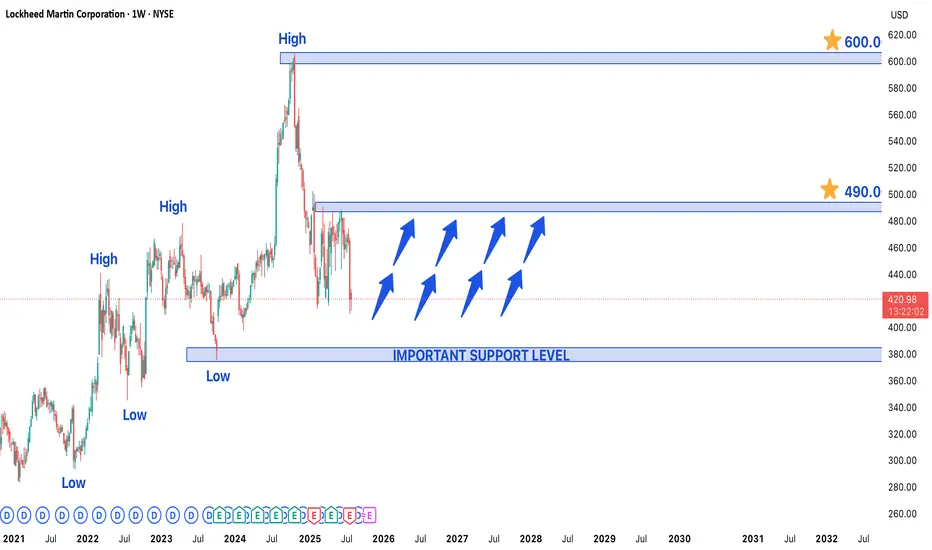
Lockheed Martin Stock in Bullish Trend - Key Levels to watchLockheed Martin (LMT) Stock in Strong Bullish Trend - Key Levels to Watch
Lockheed Martin's (LMT) stock is currently exhibiting a well-defined bullish trend, trading near a recent higher low that may serve as a crucial support level for the next upward move. The defense giant continues to benefit from robust global military spending and a strong contract pipeline, positioning the stock for potential further gains.
Technical Structure & Key Levels
- Higher Low Support: The current price zone represents a critical support area where buyers have previously stepped in, maintaining the upward trajectory
- Upside Targets:
- Near-term: $490 (previous resistance zone)
- Long-term: $600 (potential breakout extension)
- Major Support: $375 would act as strong demand zone if any deeper pullback occurs
Bullish Catalysts Supporting the Trend
1. Defense Sector Strength:
- Record US defense budget allocations for 2024-2025
- Increased NATO military spending amid global tensions
2. Contract Backlog:
- F-35 program continues to drive revenue
- Hypersonic weapons and space systems development
3. Technical Momentum:
- Price trading above key moving averages (50/200 DMA)
- Higher highs and higher lows confirm uptrend structure
Trading Strategy Considerations
- Optimal Entry:
- On bounces from current support level
- On breakout above $460 confirmation
- Risk Management:
- Stop-loss below $375 for longer-term positions
- Partial profit-taking near $490 resistance
- Confirmation Signals:
- Volume increase on upside moves
- Sustained closes above $460
Potential Risks to Monitor
- Geopolitical shifts affecting defense budgets
- Program delays (particularly in F-35 production)
- Broader market corrections impacting defense sector
Long-Term Outlook:
The combination of fundamental strength and technical positioning suggests LMT could progress toward $490 near-term, with $600 as a viable long-term target if the bullish structure holds. Traders should watch price action around current levels for continuation signals while remaining mindful of the $375 support as a critical level for the bullish thesis.
DeGRAM | USDJPY fixed above the descending channel📊 Technical Analysis
● Dollar-yen has punched through the 16-month descending channel top and twice retested it as support (false-break tags), carving a rising trend line that now guides price away from 144.90.
● Inside the break zone a smaller pennant is forming; a 4 h close above 147.18 completes the pattern and activates the channel-height target at 150.80 near the November swing cap.
💡 Fundamental Analysis
● US 2-yr yields pushed to a three-month high after hotter CPI core-services and Barkin’s “inflation progress has stalled”, while the BoJ July minutes flagged only “gradual” QT—widening the policy gap and reviving carry demand for yen shorts.
✨ Summary
Long 145.2-146.2; pennant break >147.18 targets 150.80. Bias void on a 4 h close below 142.80.
-------------------
Share your opinion in the comments and support the idea with like. Thanks for your support!

SP500 → Countertrend correction before growthFX:SPX500 is correcting against an upward trend. In the second half of the week, the market received fairly positive fundamentals during the reporting period.
S&P 500 futures found support after strong reports from Meta and Microsoft, which exceeded earnings expectations and forecasts thanks to AI. The rise in futures supported demand for the “Magnificent Seven” despite Powell's hawkish comments. The focus is on Apple and Amazon reports in the evening, which could strengthen the tech rally. On Friday, we are seeing a countertrend correction in which the market is testing the 6288 zone of interest.
Support levels: 6288.4, 6262.6
Resistance levels: 6342, 6371
Most likely, the market will form a false breakout of support during the correction. If the bulls keep the index above the key level, we can expect continued growth in the short and medium term.
Best regards, R. Linda!

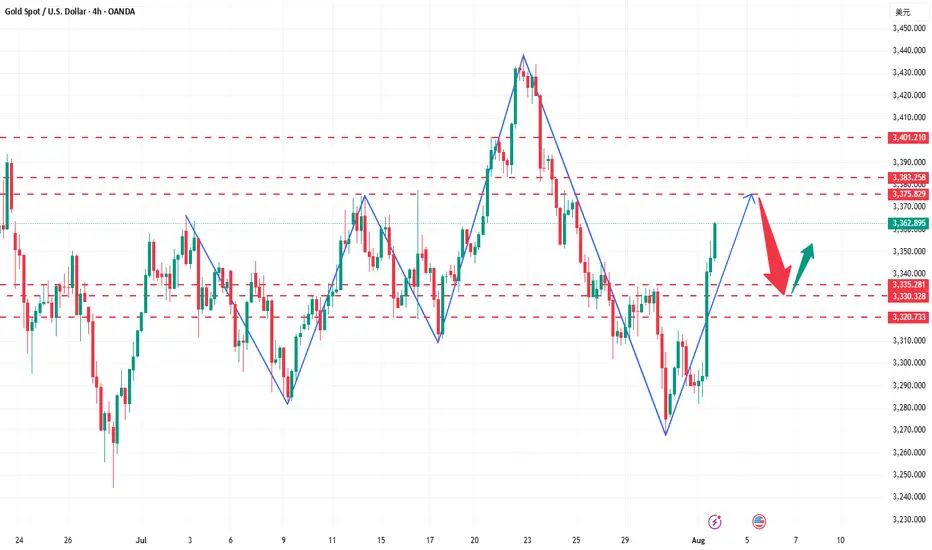
The trend is clear, why do I choose to be firmly bullish on goldGold Trend Analysis: Yesterday, the gold market demonstrated strong upward momentum, opening near 3290 before falling slightly to a low of 3281 before fluctuating upward. Boosted by the non-farm payroll data, the gold market surged during the US trading session, reaching a single-day gain of 2.02%, reaching a high of 3363 and closing there. The daily chart formed a long bullish candlestick with a long lower shadow, forming a Morning Star pattern, reinforcing the bullish trend. From the perspective of the cycle structure, the daily level is clearly in the 5-wave upward stage, and the upward trend of the large cycle has not changed. At the indicator level, the daily MACD momentum column (the column below the zero axis) represents the short-selling momentum. Its "gradual shortening" means that the short-selling force is weakening and the downward momentum is gradually fading. It is a potential signal of stopping the decline or rebounding. KDJ is about to form a golden cross between 20-50, which is a signal that short-term bullish power is beginning to increase, and the overall trend is bullish.
The 4-hour level shows typical bullish characteristics: the moving average system is arranged in a bullish pattern, but there is a certain deviation between the short-term price and the moving average. The technical side needs to correct the deviation rate through a callback before continuing to rise. The short-term support below is focused on the line near 3330-3335. This position is both the relay support level in the previous rise and the intersection of the 4-hour moving averages MA10 and MA20, which has strong support strength; the short-term resistance above is focused on the line near 3370-3383. This area is a pressure-intensive area near the previous high point. If it can be effectively broken through, it will further open up upward space. A successful breakout would open up further upside potential. A breakout would further open up the 3400 mark.
For gold trading, the short-term strategy is to buy on dips. If the price pulls back to the 3330-3335 support level, consider entering a long position with a target of 3355-3365. If it reaches 3370-3380, consider a short-term short position with a target of 3350-3340.