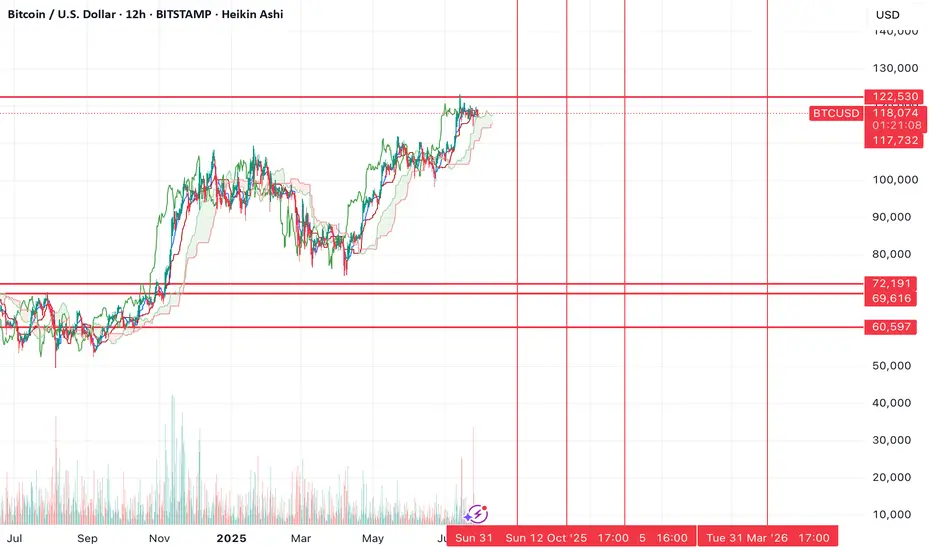
BTC highs in, new lows coming soon?~$122.5k was the top of the range. Now we'll need to go test the lows before we can continue higher.
Alts are clearly not confirming a trend change .
Many still bearish on HTFs (including ETH), I think the reason is because Bitcoin goes lower before we see a continued run and that will drag down alts with it. I think people holding alts here with hopes for new highs (in the near future) are about to have their hopes crushed, that also goes for people long crypto miners.
I don't think the real run starts until end of 2025 or 2026.
Time will tell.
Support and Resistance
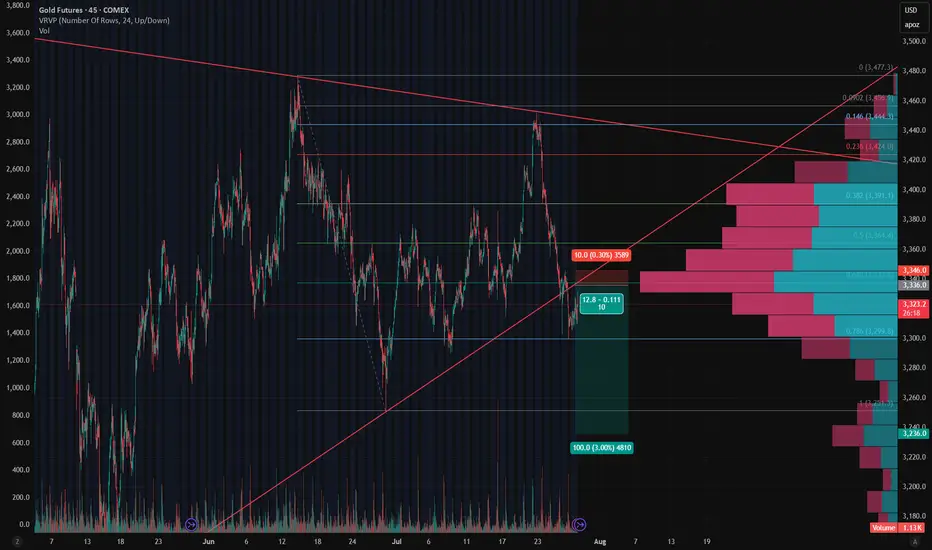
Gold - Short Setup Off Major Trendline Rejection📉 Gold - Short Setup Off Major Trendline Rejection
Gold has broken down through the rising trendline and is now retesting it — the moment of truth! 🧐
🔻 Short Entry: 3,336
🎯 Target: 3,236 (Fib 1.0 + HVN gap fill)
🛑 Stop: 3,346 (Above trendline retest)
⚖️ Risk/Reward: ~1:10
📊 Bonus: High volume node above adds resistance. Bearish volume profile structure confirms the breakdown bias.
Watching for volume to pick up on the move down. Let's see if GC bleeds into August. 🩸📆
XAGUSD | Silver Rebounds from 37.50 After 39.50 RejectionSilver pulled back sharply after failing at the 39.50 resistance zone. Price is currently consolidating just above the 37.50 support area, which has held firm on the initial retest.
Support at: 37.50 / 37.00 🔽
Resistance at: 39.50 🔼
🔎 Bias:
🔼 Bullish: A clean breakout above 39.50 could resume the uptrend.
🔽 Bearish: A break below 37.50 opens room toward 37.00 and 36.00.
📛 Disclaimer: This is not financial advice. Trade at your own risk.

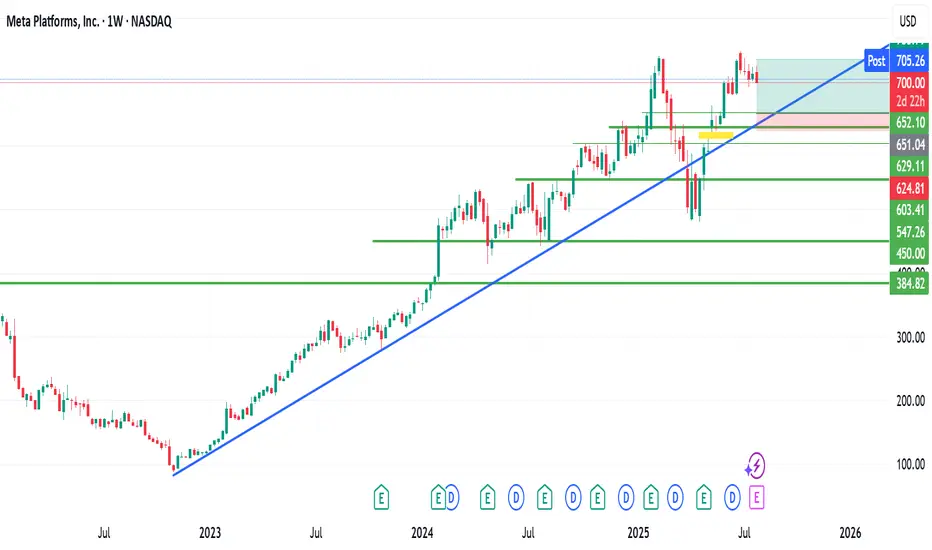
Is this possible with METAIs this possible with META?
META stock is currently trading at $700.
My technical view as shown on the chart, is looking at a possible retracement to around $650.
The question is ''Is this possible?
If it ever gets to this forecasted zone, I will accumulate massively.
Nikkei 225 Wave Analysis – 29 July 2025- Nikkei 225 reversed from the resistance zone
- Likely fall to support level 40000.00
Nikkei 225 index recently reversed from the resistance zone between the resistance levels 42000.00 (which started the sharp sell-off in 2024) and 41285.00.
This resistance zone was further strengthened by the upper daily and the weekly Bollinger Bands.
Given the strength of the aforementioned resistance zone and the overbought weekly Stochastic, Nikkei 225 index can be expected to fall to the next round support level 40000.00.

XAUUSD BUYS PROJECTION Hey everyone wow is been long since I posted here I can say for sure trading has never been so tougher for me cuz am tryna refine my edge and I miss posting and sharing my ideas here so this is my analysis on Gold after seeing Gold rejected a strong resistance zone and price keeps pushing down tho I missed the sells but market is always full of opportunity and here are my zones to take buys from,mind you these zone are very strong support zones that mostly buyers get in the market so I will be waiting for price to get to the first zone which is the green and the second is for scaling in after placing the first on breakeven and yes I will update you guys…..

NZDUSD to form a higher low?NZDUSD - 24h expiry
Pivot support is at 0.5935.
We expect a reversal in this move.
Risk/Reward would be poor to call a buy from current levels.
A move through 0.5975 will confirm the bullish momentum.
The measured move target is 0.6000.
We look to Buy at 0.5935 (stop at 0.5910)
Our profit targets will be 0.5985 and 0.6000
Resistance: 0.5975 / 0.5985 / 0.6000
Support: 0.5935 / 0.5925 / 0.5910
Risk Disclaimer
The trade ideas beyond this page are for informational purposes only and do not constitute investment advice or a solicitation to trade. This information is provided by Signal Centre, a third-party unaffiliated with OANDA, and is intended for general circulation only. OANDA does not guarantee the accuracy of this information and assumes no responsibilities for the information provided by the third party. The information does not take into account the specific investment objectives, financial situation, or particular needs of any particular person. You should take into account your specific investment objectives, financial situation, and particular needs before making a commitment to trade, including seeking, under a separate engagement, as you deem fit.
You accept that you assume all risks in independently viewing the contents and selecting a chosen strategy.
Where the research is distributed in Singapore to a person who is not an Accredited Investor, Expert Investor or an Institutional Investor, Oanda Asia Pacific Pte Ltd (“OAP“) accepts legal responsibility for the contents of the report to such persons only to the extent required by law. Singapore customers should contact OAP at 6579 8289 for matters arising from, or in connection with, the information/research distributed.

AMD: Potential Mid-Term Reversal from Macro SupportPrice has reached ideal macro support zone: 90-70 within proper proportion and structure for at least a first wave correction to be finished.
Weekly
As long as price is holding above this week lows, odds to me are moving towards continuation of the uptrend in coming weeks (and even years).
1h timeframe:
Thank you for attention and best of luck to your trading!

PEPE/ETH Weekly longPEPE against ETH is nearing a nice support level,
I will buy PEPE here and sell it at the tops against ETH to gain more ETH

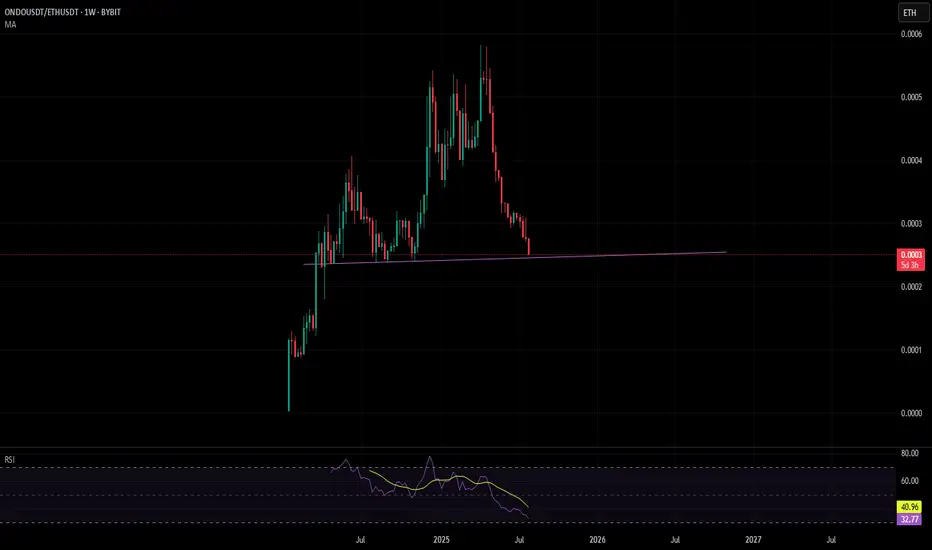
ONDOETH WeeklyOndo-ETH is nearing a nice clean support level.
I will buy ondo here and sell it at the top against ETH
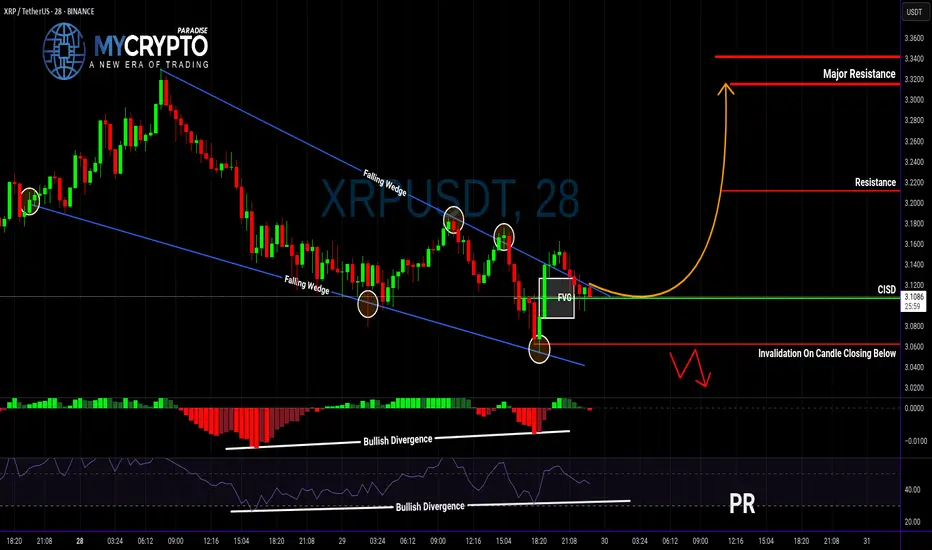
XRP Breakout Could Be a Trap… Or the Start of Something Big?Yello, Paradisers — are you about to buy into a fake breakout or position yourself right before a major move? Let’s break it down before emotions take over.
💎XRPUSDT has officially broken out of a falling wedge — a classic bullish reversal structure. What makes this breakout even more interesting is that it's supported by bullish divergence on both MACD and RSI, plus a Change In State of Delivery (CISD). All these technical signals combined significantly increase the probability of a bullish continuation.
💎Now, if you’re a disciplined trader looking for a safer entry with a higher risk-to-reward ratio, the smart move is to wait for a potential pullback to the CISD level. That would set up an opportunity offering a risk-to-reward of over 1:2.55 — not something you want to ignore.
💎But don’t get too comfortable…
💎If the price breaks down and closes below our invalidation level, the entire bullish idea is off the table. In that case, it’s wiser to stay patient and wait for clearer price action to develop. No emotional entries — only strategic moves.
🎖Strive for consistency, not quick profits. Treat the market as a businessman, not as a gambler. That’s how you’ll get inside the winner circle.
MyCryptoParadise
iFeel the success🌴
Dow Jones Wave Analysis – 29 July 2025
- Dow Jones reversed from the long-term resistance level 45000.00
- Likely fall to support level 44000.00
Dow Jones index recently reversed down from the resistance zone between the long-term resistance level 45000.00 (which has been reversing the price from the end of 2024) and the upper daily Bollinger Band.
The downward reversal from this resistance zone created the daily Japanese candlesticks reversal pattern, Bearish Engulfing.
Given the strength of the resistance level 45000.00 and the bearish divergence on the daily Stochastic, Dow Jones index can be expected to fall to the next support level 44000.00 (which reversed the price earlier in July).

EURGBP Wave Analysis – 29 July 2025- EURGBP reversed from the resistance zone
- Likely fall to support level 0.8635
EURGBP currency pair recently reversed down from the resistance zone between the multi-month resistance level 0.8735 (which stopped sharp wave (A) in April) and the upper daily Bollinger Band.
The downward reversal from this resistance zone created the daily Japanese candlesticks reversal pattern Dark Cloud Cover.
Given the strength of the resistance level 0.8735, EURGBP currency pair can be expected to fall to the next support level 0.8635 (low of the previous minor correction ii).

XAUUSD Short1. Market Structure Overview
The overall market structure on this 15-minute chart is bearish. A clear Break of Structure (BOS) occurred at $3,307.765, confirming that previous support failed and sellers are in control. After the BOS, price formed a lower high near $3,328, maintaining bearish momentum and setting the stage for potential continuation downward.
2. Supply & Demand Zones
The chart reveals two notable supply zones where sellers have been active. The first is a minor zone just above the current price, which has already triggered a rejection and shows signs of short-term bearish control. The second, positioned higher, marks the origin of a strong sell-off and represents a significant resistance level. On the demand side, the closest support zone lies just beneath the current price, but it appears weak due to prior tests. A stronger demand zone is located further down, where price previously saw an aggressive bullish reaction, indicating solid buyer interest. If bearish momentum continues, price may drop even lower into a deeper liquidity pocket—an area likely to attract strong institutional buying.
3. Price Action within the Current Region
Price is currently hovering around $3,325, inside a narrow range between the minor supply and weak local demand. After rejecting the upper supply zone, price is showing bearish intent. If the market maintains this rejection pattern, a drop toward the $3,293–$3,301 demand area is likely. This zone is expected to offer a bounce or at least temporary reaction due to the strong response seen there previously.
4. Trade Bias & Plan
The active bias is bearish. Short opportunities are favored while price remains below $3,328. Ideal short entries are from the rejection of the minor supply zone, targeting $3,301 and possibly $3,293. A clear break and hold above $3,329 would invalidate the short bias and shift focus toward higher liquidity levels. Until then, structure supports downside continuation.
5. Momentum & Confirmation
Momentum is currently favoring sellers. The lower highs and strong rejections near supply reinforce the bearish bias. Confirmation for continuation comes from bearish engulfing candles and sharp rejections from supply zones. A clean break below the nearest demand zone would further validate the move toward deeper targets.

KKR Short1. Market Structure Context
Trend Prior to CHoCH: Bullish structure with higher highs and higher lows.
CHoCH (Change of Character): Occurred at $136.83 — a key higher low broke, indicating a possible trend reversal from bullish to bearish.
BOS (Break of Structure): Confirmed at $153.85, marking a shift to lower highs and supporting bearish continuation.
2. Key Supply & Demand Zones
🟥 Supply Zone (Resistance):
$153.05 – $153.85
Price previously distributed here before dropping.
Acts as a liquidity trap for late buyers and resistance for pullbacks.
🟩 Demand Zones (Support):
Zone 1: $147.00 – $148.00 → Minor demand; short-term reaction likely.
Zone 2: $144.50 – $146.00 → Historical pivot with volume; moderate demand.
Zone 3: $138.00 – $142.00 → Consolidation base; strong prior bullish impulse.
Zone 4: $134.00 – $137.00 → Final defense; includes the CHoCH at $136.83 and expected reaction if deeper retracement occurs.
3. Current Price Action (Bordered Region Focus)
Price currently trades around $151.06, beneath the key supply zone.
The market rejected supply and showed a bearish reaction.
Expectation: A pullback to ~$153 may occur, targeting trapped liquidity, before resuming bearish movement.
Next targets:
Primary: $147.50 (Demand Zone 1)
Secondary: $144.50 if breakdown intensifies.

XLU Long1. Market Structure Overview
A notable Change of Character (CHoCH) occurred at 84.09, breaking below a prior higher low and signaling a shift from bullish to bearish momentum. This was followed by a clear Break of Structure (BOS) at 83.40, confirming the bearish sentiment and initiating a new lower low sequence.
2. Supply and Demand Zones
Supply Zones (Resistance):
85.00–85.55: Strongest supply zone where multiple bearish rejections originated.
84.75–85.00: Closest overhead supply zone—price is expected to react if it reaches this area.
Demand Zones (Support):
84.00–84.20: Local demand that initiated the recent bullish push; possible short-term support.
83.10–83.40: Major demand zone that sparked the latest upward move; strong buyer interest observed.
3. Current Price Action & Expectation
Price is currently trading at 84.46, moving upward from the 84.00–84.20 demand zone. The near-term outlook suggests a continued push toward the 84.75–85.00 supply zone. If price can decisively break above 84.99, bullish momentum could extend toward 85.30–85.55.
However, if price rejects from 84.75–85.00, a pullback into 84.00–84.20 is expected before another attempt higher. A breakdown below 84.00 would open downside risk toward the stronger demand at 83.10–83.40.
4. Momentum & Risk Outlook
Momentum is gradually shifting bullish after forming a swing low near 83.40. Maintaining structure above that level is crucial for a bullish continuation. Watch for a clean break and retest of the CHoCH level at 84.99 to confirm strength.

Bitcoin is getting Ready for 143K$ nowMajor red resistance trendline is now broken also last week the retest is completed now price is range for a while for new week to start and fresh volume and buys that make path easier to reach above 140K$.
Get ready and take a look at important zones at chart and possible scenarios which are all mentioned.
DISCLAIMER: ((trade based on your own decision))
<<press like👍 if you enjoy💚

GOLD awaiting confirmation of a bullish zone formation.Gold has confirmed support at 3310, with the price rebounding and returning to the buying side. We are now awaiting confirmation of a bullish zone formation.
Gold remains under pressure ahead of key market-moving events, including the US GDP data release and the Federal Reserve’s interest rate decision. However, the pause in Dollar strength is offering some support to the gold price. As long as the price holds above this level, the bullish scenario remains valid. A sustained move above this zone may open the path toward the next resistances: 3360 / 3385 we can expect Growth more.
You May find more Details in the Chart.
Trade wisely best of Luck Buddies.
Ps: Support with like and comments for more insights Thanks for Supporting.

NFLX Short1. Market Structure Overview
The broader market structure has shifted bearish following a Change of Character (CHoCH) around 1277.42, where price broke below a prior higher low, suggesting a possible trend reversal. This was later confirmed by multiple Breaks of Structure (BOS) at lower levels, especially the key BOS at 1162.8, which solidified bearish intent. Each BOS has been followed by continued selling, showing strong bearish momentum and weakening buyer control.
2. Supply and Demand Zones
Several major supply zones (resistance) are present, especially at 1340–1330, 1300–1290, 1277–1260, and most immediately at 1185–1175, where price is currently reacting. These zones have previously shown strong rejections and are likely to cap bullish retracements.
On the demand side (support), the primary demand zone lies at 1130–1110, which acted as a prior accumulation base. A deeper demand area also exists near 1100–1090, which could serve as a last-resort support if price breaks lower.
3. Price Action Within Key Border
Currently, price is hovering around 1173.99, inside the lower supply zone of 1185–1175. The structure suggests a potential short-term retracement to this zone before continuation lower. If price rejects here again, the expectation is for a move toward the 1130–1110 demand zone. However, a strong breakout and hold above 1185 could open the path for retesting higher supply levels like 1225–1245.

GOLD → Formation of a trading range. 3345?FX:XAUUSD confirms support for the local range. A false breakdown has formed and the price has returned to the buying zone. We are waiting for the bulls to take the initiative...
Gold is trying to recover after falling to $3302, remaining under pressure ahead of key events in the US: the publication of GDP data and the Fed's decision on interest rates. Support is provided by a pause in the dollar's growth, expectations of an extension of the US-China trade truce, and growing demand for safe-haven assets amid a surge in oil prices due to the threat of new sanctions against Russia. However, the sustainability of growth is in question: the dollar may strengthen thanks to optimism about the US economy and progress in negotiations.
A false breakdown of the support range is forming. Focus on 3310-3320. If the bulls keep the price above this zone, gold will have a chance to grow. BUT! If the price starts to contract and stick to 3310, we can expect the decline to continue...
Resistance levels: 3345, 3375
Support levels: 3320, 3310, 3287
The two-day movement has most likely exhausted its potential, or the market has decided to recover slightly due to the unpredictability factor. A false breakdown of support could trigger a pullback to the strong level of 3345, from which a rebound could form (either before growth or before the continuation of the decline; it is necessary to monitor the reaction and the market background...).
Best regards, R. Linda!

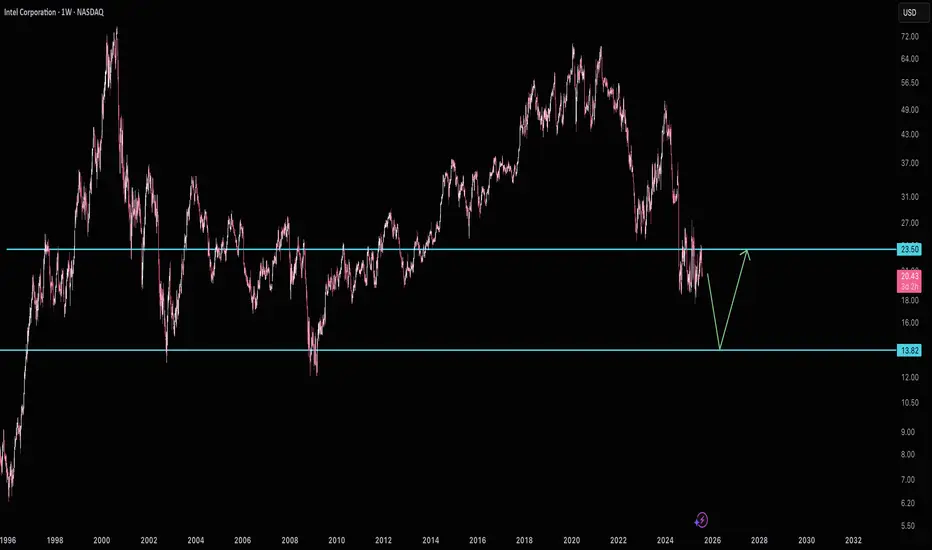
Intel looks to want $13Intel looks to be waiting below $24 resistance for $13 support. I wouldn't short it at it's current price, but I would be patient and wait for $13 if you're looking to buy. Good luck!
XAUUSD go for long!Hi all
After hitting the support zone its quite obvious that XAUUSD will increase! and we can go for long!!
Currently its double bottom, but it may go for third!
Note: am new trader and not an expert!! Please stick with your thoughts and analysis if its against mine!
Am sharing my thoughts and all depend on my analysis!
Please let me know if you agree or disagree with me!

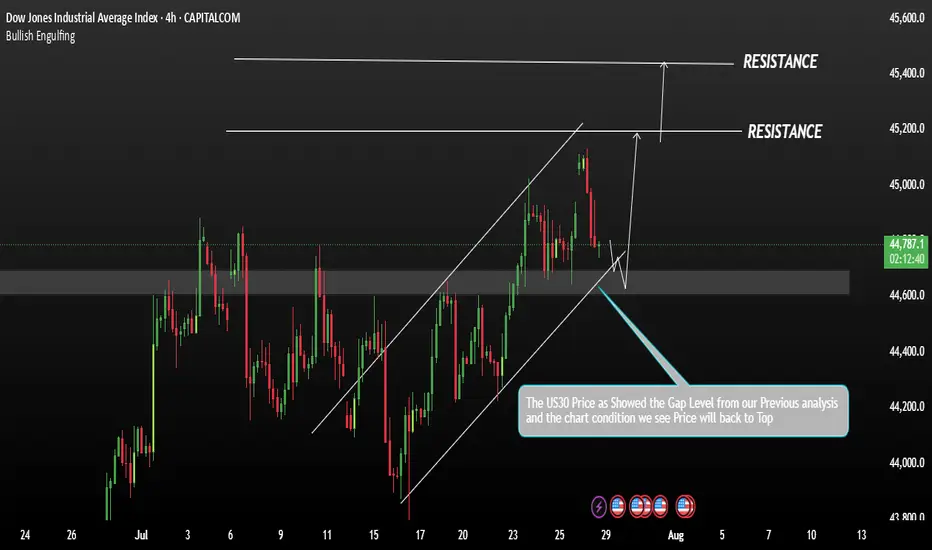
US30 Correction with in a Downtrend ChannelUS30 is currently in a consolidation phase within a broader bullish trend. From our previous analysis, the index has shown strong upward momentum. However, to confirm a potential bearish shift, the price would need to break back below key support levels, potentially leading to a deeper correction.
If the price stabilizes above 44,000 on the 4H timeframe, this would strengthen the bullish momentum. A sustained move above this level could open the path towards the next targets at 45,200 and 45,400.
You May find more details in the chart.
Ps: Support with like and comments for better analysis