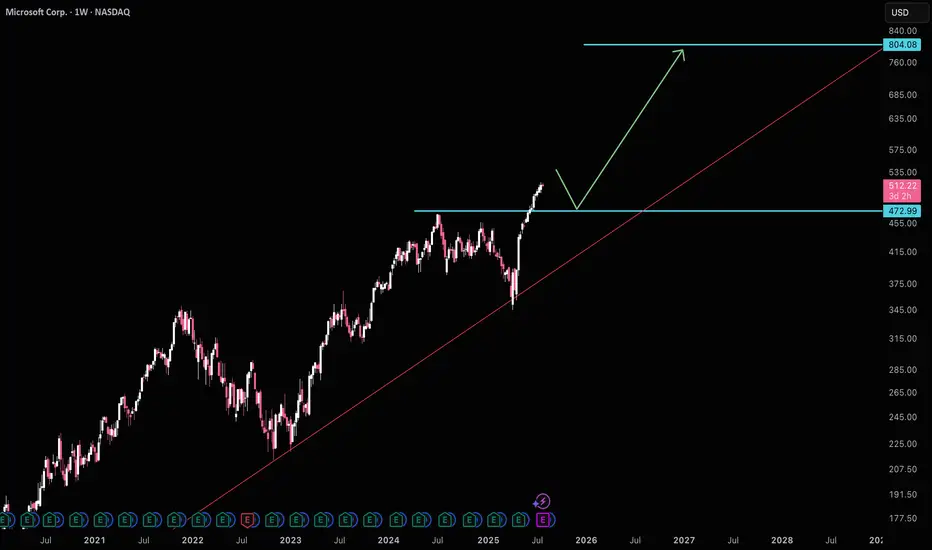
Mircrosoft wants to pullback to $470MSFT is likely to test $470 support before making it's move to $800. Another thing to be weary about is ratio MSFT/AAPL is at historical avg highs, which usually signals a bias towards AAPL. Waiting for $470 is a good idea before getting long again.
Good luck!
Support and Resistance
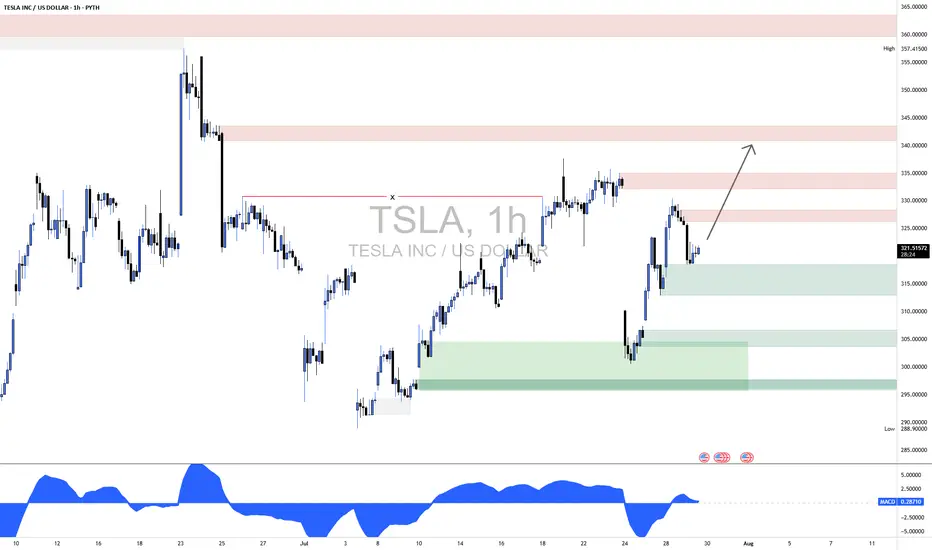
TSLA Long1. Market Structure Overview
1.1 Previous High Sweep (Fakeout) – ~357.41
Price made a strong push above previous highs but was sharply rejected.
Indicates potential liquidity grab and institutional selling.
1.2 Change of Character (CHoCH) – ~333
Price broke below the previous higher low structure, signaling the end of bullish momentum.
Marks a bearish shift after an extended uptrend.
1.3 Break of Structure (BOS) – ~317
Confirms bearish continuation after CHoCH.
Price closed below support, validating the downtrend.
2. Supply & Demand Zones
2.1 Supply Zones (Resistance)
Zone A (343–357)
Major Supply from the last distribution before the drop.
High volume selling occurred; strong resistance expected.
Zone B (328–336)
Local Supply formed after CHoCH.
Price may react here before testing higher levels.
2.2 Demand Zones (Support)
Zone C (315–319)
Price bounced from here twice; active buyer interest.
Critical zone for near-term bullish continuation.
Zone D (299–306)
Strong Demand and origin of the last large impulse up.
Institutional footprints likely; strong support if retested.
3. Price Action Analysis (Inside Bordered Region)
Current Price (~321.68) is rebounding from Zone C.
Price is forming higher lows intraday, showing bullish intent.
Expected Move:
Short-term bounce toward Zone B (328–336).
If sellers overpower, potential reversal from this supply.
If buyers maintain momentum and break above Zone B, move toward Zone A (343–357) is likely.
4. Momentum & Confirmation
MACD on the 1-hour shows a bullish crossover, suggesting short-term buying pressure.
Structure remains bearish to neutral unless price closes above 336.
A break and hold above 336 would shift bias back to bullish continuation.
5. Financial Context Supporting Price Zones
Recent Tesla Catalysts (July 2025):
Earnings Reported July 24: Mixed results. Strong delivery numbers but concerns about margins due to price cuts.
Investor Sentiment: Divided. Some bullish based on long-term EV growth; others cautious due to margin compression.
Macroeconomic Factors:
Fed policy indecision is increasing volatility.
Tech-heavy indexes (like Nasdaq) are pulling back slightly, causing large-cap techs to see choppy moves.
These events support the supply zone near 328–336 acting as resistance until new bullish data or technical breakouts occur.
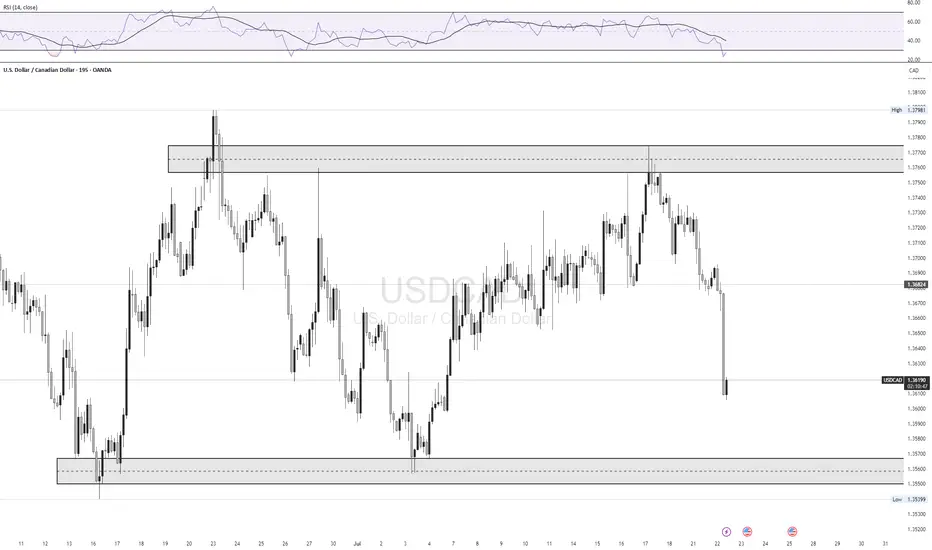
USD/CAD LongLooking for a retest of 1.35600 zone for a bounce back up to 1.37650 supply zone
FX:USDCAD
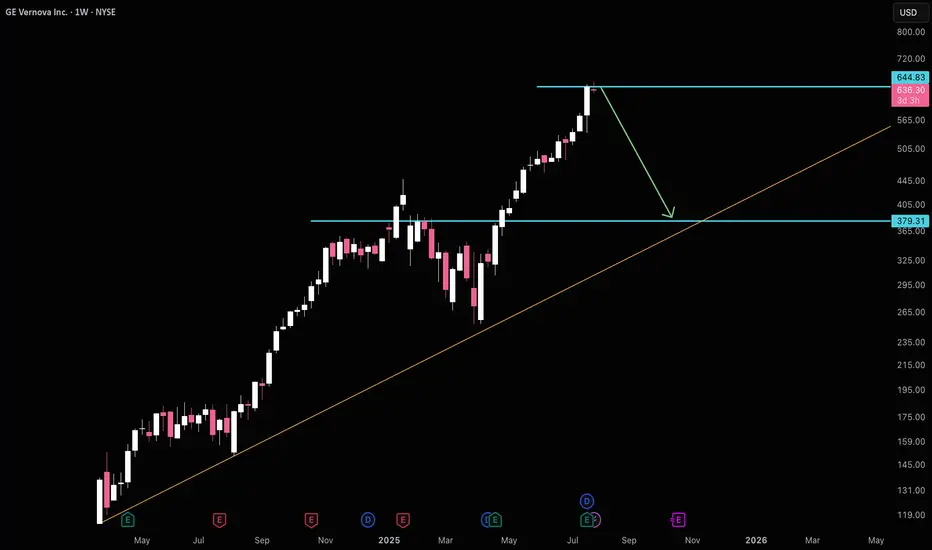
GEV High Risk $380GEV has a high risk of $380 at the moment. Obviously don't bet against the trend, especially while the S&P still has a lot of room to run, but it's an easy area to open some insurance for a potential fall to $380.
Good luck!
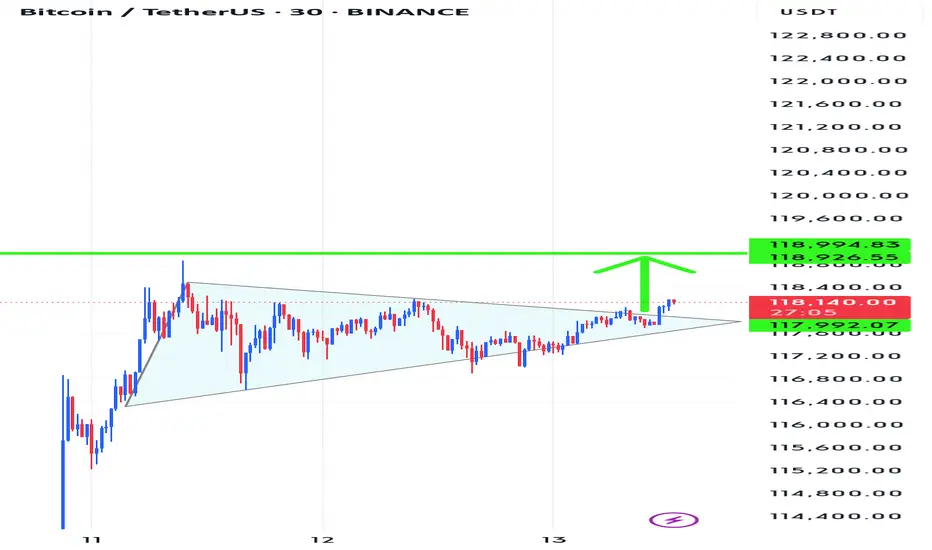
BTC's latest trading strategy and analysis layout#BTCUSD
BTC's current technical signals show a bull-bear tug-of-war situation.If a golden cross is formed near the zero axis, it may indicate a new wave of rise; if it falls below the zero axis, we need to be wary of a deep correction.
There are certain opportunities for both bulls and bears in the current market, but global regulatory policies have not yet been unified. Policies such as the US "GENIUS Act" may affect BTC and require continued attention. BTC is currently facing significant buying support around 117,500, but the hourly chart shows that there is still potential for a continued pullback. The current trend has not yet finished. Pay attention to the support level of 116,000 below. If it falls below, it may fall into the consolidation range of 116,000-114,000. For aggressive traders, consider going long at 117,500-116,500, with a target of 118,500-119,500. A break above this level could lead to 120,000.
🚀 117500-116500
🚀 118500-119500

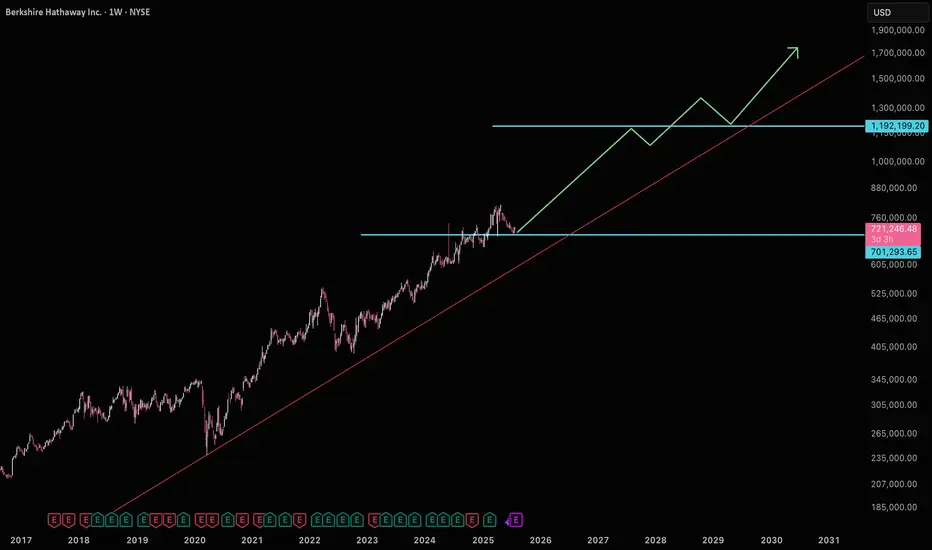
BRK.A on it's way to $1.2mm sitting on strong supportBerkshire is not far off it's long term trend sitting near major support. It's poised to start it's move to $1.2mm where next resistance is. Good luck!
Novo Nordisk on Fire Sale!This megaphone pattern below support makes me think this 20pe ratio stock is looking to reclaim support and run back up to $158.
Good luck!

GBPAUD Reverses from Key Zone – Long Setup in Play!Today I want to share with you a Long position on GBPAUD ( OANDA:GBPAUD ).
GBPAUD started to rise well from the Important Support line , Support zone(2.032 AUD-1.987 AUD) , and Potential Reversal Zone(PRZ) and managed to close the 4-hour candle above 2.053 AUD (important) .
In terms of Elliott wave theory , GBPAUD seems to have completed the main wave 4 . The main wave 4 structure was a Double Three Correction(WXY) .
Also, along the way, we can see a Bullish Marubozu candle , which could indicate a continuation of the uptrend .
I expect GBPAUD to break the Resistance lines soon and attack the Resistance zone(2.078 AUD-2.066 AUD) .
First Target: 2.065 AUD
Second Target: 2.076 AUD
Note: Stop Loss(SL): 2.040 =Worst SL
Please respect each other's ideas and express them politely if you agree or disagree.
British Pound/ Australian Dollar Analyze (GBPAUD), 4-hour time frame.
Be sure to follow the updated ideas.
Do not forget to put a Stop loss for your positions (For every position you want to open).
Please follow your strategy and updates; this is just my Idea, and I will gladly see your ideas in this post.
Please do not forget the ✅' like '✅ button 🙏😊 & Share it with your friends; thanks, and Trade safe.

BTCUSD IS still bullish? Yes sure
Hi dears
I think Bitcoin is continuing to rise. The first target is probably $120,000 and then $140,000.
What do you think?
If you agree with me, please like and comment.
Thank you.
ACET TOKEN (ACTBUSD): Bullish Outlook ExplainedThe ACET TOKEN appears to be gearing up for a bullish trend, making it an ideal time to invest.
Upon examining the daily chart, I identified a symmetric triangle pattern and a confirmed breakout above the resistance line.
The final hurdle for buyers lies within the 0.10155 - 0.09256 resistance range.
If the bulls manage to break and close above this level, it will signal a significant bullish indication, likely leading to a continuation towards at least 0.14000.

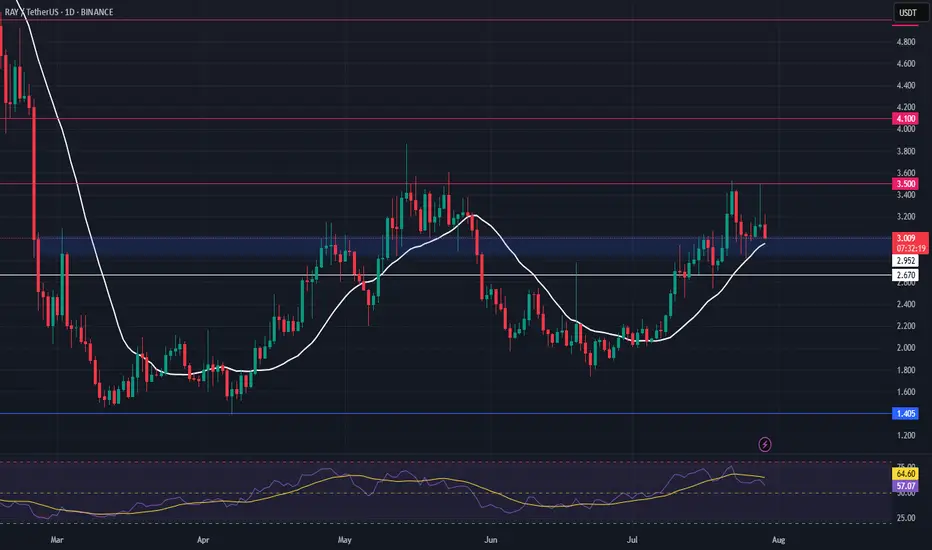
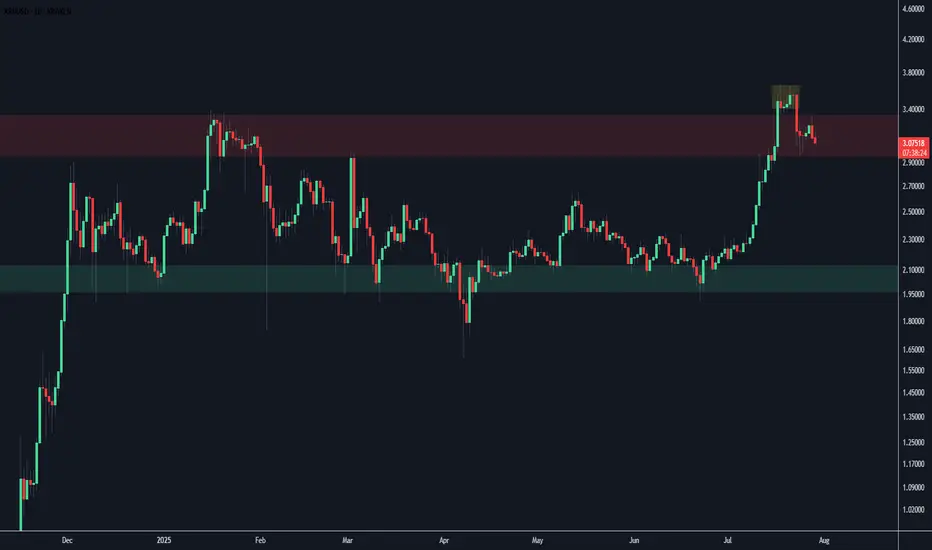
RAY Swing Trade – Key Support Retest in PlayRAY is pulling back toward a major support zone, offering a solid opportunity to position for a bounce as market structure remains constructive.
📌 Trade Setup:
• Entry Zone: $2.85 – $3.02
• Take Profit Targets:
o 🥇 $3.50
o 🥈 $4.10
• Stop Loss: $2.67
XRP Daily ChartReally starting to move down after ranging between this resistance this week.
Could easily make all time lows as easily as all time highs, not a bad price to take some profit.
TON Swing Trade – Support Zone in FocusTON is holding a major support level, setting up for a potential bounce. With structure intact, this offers a favorable long entry for swing traders looking to capitalize on the next leg up.
📌 Trade Setup:
• Entry Zone: $3.20 – $3.35
• Take Profit Targets:
o 🥇 $3.60
o 🥈 $4.00
• Stop Loss: $3.088

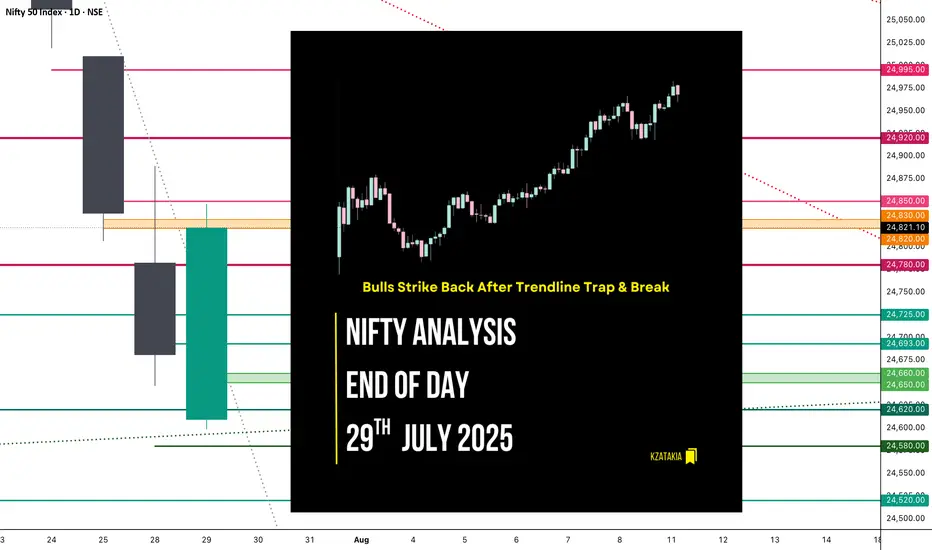
Nifty Analysis EOD – July 29, 2025 – Tuesday🟢 Nifty Analysis EOD – July 29, 2025 – Tuesday 🔴
Bulls Strike Back After Trendline Trap & Break
Nifty started below the previous day's low, and after marking day low at 24,598.60, it rose to 24,725 where it faced the trendline and CPR zone. A sharp rejection from there quickly pushed Nifty back to the day's open level. A base-building process began, characterized by a low-range but high-volatility phase.
Gradually, Nifty crossed the VWAP and the trendline again, breaking the day's high and CPR zone, ultimately reaching R1 and closing near the highest point at 24,830.40.
In the first half, both long and short traders got trapped in fast swings—refer to the chart for visual cues.
🕯 5 Min Time Frame Chart with Intraday Levels
🔄 Trend & Zone Update
📈 Resistance Zone Shifted To: 25,110 ~ 25,090
📉 Support Zone Shifted To: 24,520 ~ 24,480
🕯 Daily Time Frame Chart with Intraday Levels
🕯 Daily Candle Breakdown
Open: 24,609.65
High: 24,847.15
Low: 24,598.60
Close: 24,821.10
Change: +140.20 (+0.57%)
🕯Candle Structure Breakdown:
Real Body: Green candle (Close > Open):
24,821.10 − 24,609.65 = 211.45 pts (large bullish body)
Upper Wick: 26.05 pts (small)
Lower Wick: 11.05 pts (very small)
🕯Interpretation:
Market opened lower but found strong buying support, rallying to nearly 24,850.
Closed near the day’s high—bulls dominated.
Tiny lower wick shows hardly any selling pressure after the open.
🕯Candle Type:
Bullish Marubozu-type — strong signal of reversal or continuation, indicating control by buyers.
🕯Key Insight:
Strong bounce from sub-24,600 back above 24,800 has improved short-term sentiment.
If 24,830–24,850 breaks in the next session, potential upside till 24,920–24,995.
Support now shifts to 24,700–24,720.
🛡 5 Min Intraday Chart
⚔️ Gladiator Strategy Update
ATR: 202.98
IB Range: 128.5 → Medium
Market Structure: Balanced
Trades Triggered:
🕒 11:10 AM – Long Entry → Target Hit 🎯 (1:3 Risk:Reward)
🧱 Support & Resistance Levels
Resistance Zones:
24,815 ~ 24,830
24,850
24,920
24,995
Support Zones:
24,725
24,693
24,660 ~ 24,650
🧠 Final Thoughts
“Volatility shakes the weak hands; structure empowers the patient.”
Today’s session was a textbook example of how the market tests conviction. After trapping early traders with sharp intraday swings, Nifty rewarded those who respected structure and waited for confirmation. The reclaim of the trendline, VWAP, and CPR zone reinforced the strength of bullish intent. If the momentum continues above 24,850, we may be entering a fresh leg of the uptrend—stay nimble, but don't lose sight of the bigger picture.
✏️ Disclaimer
This is just my personal viewpoint. Always consult your financial advisor before taking any action.
GBPJPY BUY SETUPGBPJPY is bullish on the daily timeframe and is currently retracing to continue buying. I want to see structural liquidity taken and tap my entry before continuing to the upside.

Solana maintains its upward structure ┆ HolderStatBINANCE:SOLUSDT is bouncing from the $170–172 zone, building higher lows just below resistance at $180. The structure is shaping into a rounded bottom with signs of accumulation. If SOL clears $180 with volume, targets lie at $188 and beyond. Trend remains bullish as long as price stays above the local demand zone.

Where to next for EURUSD? With Monday's opening, we saw price sell off at a great force and attacked the previous week's low, taking it out, with short term liquidity taken, will price reverse and start moving up or is there no end in sight for this bearishness?

Trendline Liquidity Taken Watching for MSS at Support in EUR/USDEUR/USD has taken liquidity above the previous trendline resistance during the New York session and is now declining. The pair is approaching a key support zone. If it reaches this level and shows a market structure shift (MSS) or any other bullish confirmation, there is potential for a reversal from this zone. In that case, price could move upward toward the marked bearish Fair Value Gap (FVG). Always conduct your own research (DYOR) before making any trading decisions.

European session under pressure 3321 continue to shortI reminded everyone last night that if gold holds the 3300 mark, it will consolidate in the 3300-3345 range in the short term. The current gold price basically fluctuates narrowly between 3320-3310. Judging from the daily chart, the short-term upper pressure is at 3330. Only if the daily line stands firmly above 3330, there is a possibility of a rebound upward in the short term. Judging from the hourly chart, gold is still in a downward trend, and the hourly line is blocked near 3321. In the short term, if it cannot break through 3320-3330, gold will continue to fall. You can consider shorting, with the target at 3310-3300. If the European session is still volatile, maintain high shorts and low longs to participate in the cycle.
My premium privileges are about to expire, and subsequent trading strategies and analysis will be published in the group.

USDJPY 60/15 Pullback LongOverall bull trend. Waiting for pullback. If it pass the market shift and stay below, no go. Else will wait for long singal to go long.

Hindustan Unilever looks strong. Hindustan Unilever Ltd. engages in the manufacture of consumer goods. It operates through the following segments: Home Care, Beauty and Personal Care, Foods and Refreshments, and Others. It is one of leading company in FMCG sector.
Hindustan Unilever Closing price is 2453.60. Dividend Yield @CMP = 1.78%. The positive aspects of the company are Stocks Outperforming their Industry Price Change in the Quarter, Companies with Zero Promoter Pledge, Company able to generate Net Cash - Improving Net Cash Flow for last 2 years, FII / FPI or Institutions increasing their shareholding and MFs increased their shareholding last quarter. The Negative aspects of the company are high Valuation (P.E. = 53.9), Increasing Trend in Non-Core Income, Declining Revenue every quarter for the past 2 quarters and PEG greater than Industry PEG.
Entry can be taken after closing above 2460 Historical Resistance in the stock will be 2498 and 2534. PEAK Historic Resistance in the stock will be 2571 and 2601. Stop loss in the stock should be maintained at Closing below 2391 or 2369 depending upon your risk taking ability.
Disclaimer: The above information is provided for educational purpose, analysis and paper trading only. Please don't treat this as a buy or sell recommendation for the stock or index. The Techno-Funda analysis is based on data that is more than 3 months old. Supports and Resistances are determined by historic past peaks and Valley in the chart. Many other indicators and patterns like EMA, RSI, MACD, Volumes, Fibonacci, parallel channel etc. use historic data which is 3 months or older cyclical points. There is no guarantee they will work in future as markets are highly volatile and swings in prices are also due to macro and micro factors based on actions taken by the company as well as region and global events. Equity investment is subject to risks. I or my clients or family members might have positions in the stocks that we mention in our educational posts. We will not be responsible for any Profit or loss that may occur due to any financial decision taken based on any data provided in this message. Do consult your investment advisor before taking any financial decisions. Stop losses should be an important part of any investment in equity.

The trend is your friend...BTC is moving within a clear range on the daily timeframe. Since we are in an underlying uptrend, the current range is bullish. A downside fakeout would be typical and could potentially fill the CME gap, but we would remain bullish.
