Hindustan Unilever looks strong. Hindustan Unilever Ltd. engages in the manufacture of consumer goods. It operates through the following segments: Home Care, Beauty and Personal Care, Foods and Refreshments, and Others. It is one of leading company in FMCG sector.
Hindustan Unilever Closing price is 2453.60. Dividend Yield @CMP = 1.78%. The positive aspects of the company are Stocks Outperforming their Industry Price Change in the Quarter, Companies with Zero Promoter Pledge, Company able to generate Net Cash - Improving Net Cash Flow for last 2 years, FII / FPI or Institutions increasing their shareholding and MFs increased their shareholding last quarter. The Negative aspects of the company are high Valuation (P.E. = 53.9), Increasing Trend in Non-Core Income, Declining Revenue every quarter for the past 2 quarters and PEG greater than Industry PEG.
Entry can be taken after closing above 2460 Historical Resistance in the stock will be 2498 and 2534. PEAK Historic Resistance in the stock will be 2571 and 2601. Stop loss in the stock should be maintained at Closing below 2391 or 2369 depending upon your risk taking ability.
Disclaimer: The above information is provided for educational purpose, analysis and paper trading only. Please don't treat this as a buy or sell recommendation for the stock or index. The Techno-Funda analysis is based on data that is more than 3 months old. Supports and Resistances are determined by historic past peaks and Valley in the chart. Many other indicators and patterns like EMA, RSI, MACD, Volumes, Fibonacci, parallel channel etc. use historic data which is 3 months or older cyclical points. There is no guarantee they will work in future as markets are highly volatile and swings in prices are also due to macro and micro factors based on actions taken by the company as well as region and global events. Equity investment is subject to risks. I or my clients or family members might have positions in the stocks that we mention in our educational posts. We will not be responsible for any Profit or loss that may occur due to any financial decision taken based on any data provided in this message. Do consult your investment advisor before taking any financial decisions. Stop losses should be an important part of any investment in equity.
Support and Resistance

The trend is your friend...BTC is moving within a clear range on the daily timeframe. Since we are in an underlying uptrend, the current range is bullish. A downside fakeout would be typical and could potentially fill the CME gap, but we would remain bullish.

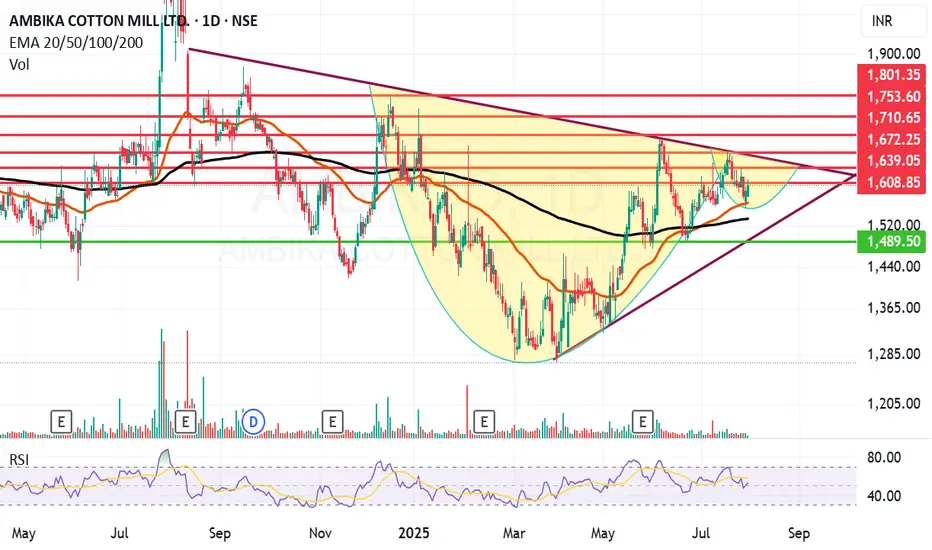
Ambika Cotton looking ambitious on the charts and fundamentally.Ambika Cotton Mills Ltd. engages in the provision of manufacturing and selling of cotton yarn catering to the needs of manufacturers of premium branded shirts and t-shirts.
Ambika Cotton Mills Ltd. Closing price is 1603.20 Dividend Yield @CMP = 2.35%. The positive aspects of the company are attractive Valuation (P.E. = 13.9), Stocks Outperforming their Industry Price Change in the Quarter, Companies with Zero Promoter Pledge, Companies with Low Debt, Rising Net Cash Flow and Cash from Operating activity and FII / FPI or Institutions increasing their shareholding. The Negative aspects of the company are Increasing Trend in Non-Core Income, Fall in Quarterly Revenue and Net Profit (YoY) and Companies with growing costs YoY for long term projects.
Entry can be taken after closing above 1609 Historical Resistance in the stock will be 1631, 1672 and 1710. PEAK Historic Resistance in the stock will be 1753 and 1801. Stop loss in the stock should be maintained at Closing below 1533 or 1489 depending upon your risk taking ability.
Disclaimer: The above information is provided for educational purpose, analysis and paper trading only. Please don't treat this as a buy or sell recommendation for the stock or index. The Techno-Funda analysis is based on data that is more than 3 months old. Supports and Resistances are determined by historic past peaks and Valley in the chart. Many other indicators and patterns like EMA, RSI, MACD, Volumes, Fibonacci, parallel channel etc. use historic data which is 3 months or older cyclical points. There is no guarantee they will work in future as markets are highly volatile and swings in prices are also due to macro and micro factors based on actions taken by the company as well as region and global events. Equity investment is subject to risks. I or my clients or family members might have positions in the stocks that we mention in our educational posts. We will not be responsible for any Profit or loss that may occur due to any financial decision taken based on any data provided in this message. Do consult your investment advisor before taking any financial decisions. Stop losses should be an important part of any investment in equity.
PII eyes on $59.27: Golden Genesis may give a Dip-to-Fib entryPII earnings report spiked it into Golden Genesis at $59.27
Looking for a dip to enter on the strength of earnings.
Golden Covid below at $56.59 or green zone around $54

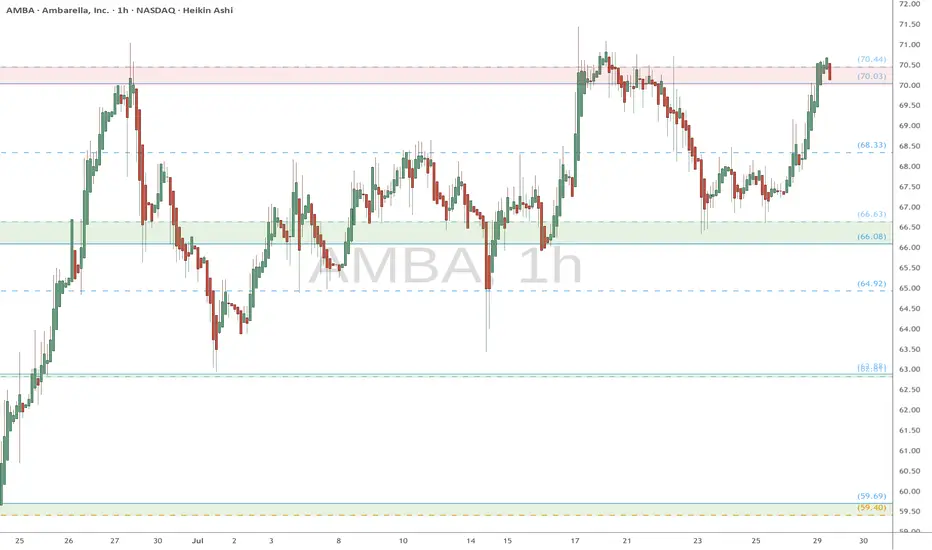
AMBA watch $70.03-70.44: Proven resistance holding up new highs AMBA has been trying to float upwards with the market tide.
Currently struggling against a proven resistance $70.03-70.44
Looking for a Break-n-Retest ideally or Dip-to-Fib for entries.
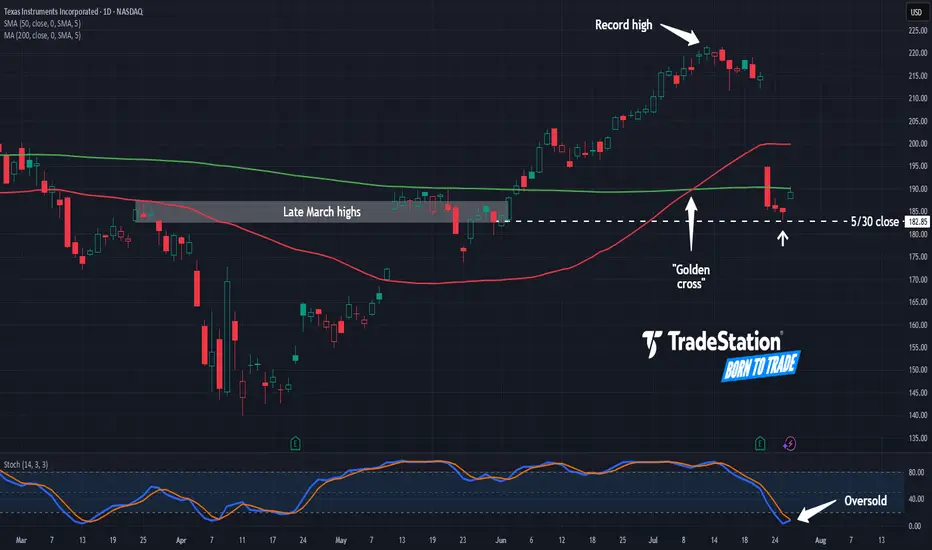
Texas Instruments May Be OversoldTexas Instruments fell sharply last week, and now it may be oversold.
The first pattern on today’s chart is the price zone on either side of $185. It’s near the peaks in late March and a consolidation zone in late May. (The May 30 weekly close is in a similar area.)
TXN held near that level last week, which may confirm old resistance has evolved into new support.
Next, stochastics are turning up from an oversold condition.
Third, the 50-day simple moving average (SMA) had a “golden cross” above the 200-day SMA earlier this month. That could indicate the semiconductor company’s longer-term trend has gotten more bullish.
TradeStation has, for decades, advanced the trading industry, providing access to stocks, options and futures. If you're born to trade, we could be for you. See our Overview for more.
Past performance, whether actual or indicated by historical tests of strategies, is no guarantee of future performance or success. There is a possibility that you may sustain a loss equal to or greater than your entire investment regardless of which asset class you trade (equities, options or futures); therefore, you should not invest or risk money that you cannot afford to lose. Online trading is not suitable for all investors. View the document titled Characteristics and Risks of Standardized Options at www.TradeStation.com . Before trading any asset class, customers must read the relevant risk disclosure statements on www.TradeStation.com . System access and trade placement and execution may be delayed or fail due to market volatility and volume, quote delays, system and software errors, Internet traffic, outages and other factors.
Securities and futures trading is offered to self-directed customers by TradeStation Securities, Inc., a broker-dealer registered with the Securities and Exchange Commission and a futures commission merchant licensed with the Commodity Futures Trading Commission). TradeStation Securities is a member of the Financial Industry Regulatory Authority, the National Futures Association, and a number of exchanges.
TradeStation Securities, Inc. and TradeStation Technologies, Inc. are each wholly owned subsidiaries of TradeStation Group, Inc., both operating, and providing products and services, under the TradeStation brand and trademark. When applying for, or purchasing, accounts, subscriptions, products and services, it is important that you know which company you will be dealing with. Visit www.TradeStation.com for further important information explaining what this means.
GBPUSD - 28/7/25 - Bearish continuationI do have a bullish trade open current from this zone, but will move the SL to breakeven or take a small loss.
The new idea if the equal low liquidity is swept is to take a bearish trade as shown.

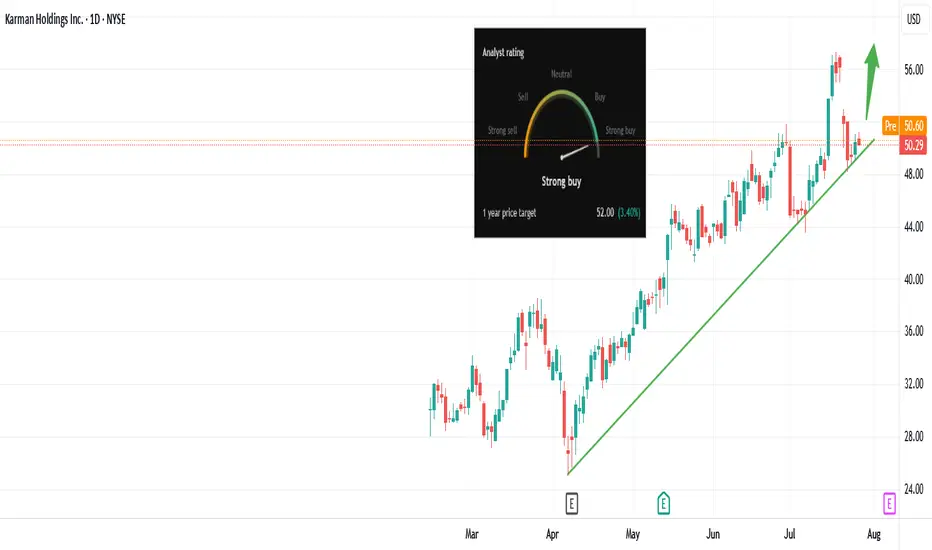
Bullish Momentum Building: KARMAN Eyes Powerful Upside Break!Trade Summary
Setup: Bullish trendline support + “Strong Buy” analyst rating + Eyeing breakout above recent high
Entry: Buy on breakout above $52.05 (Wednesday’s high)
Stop-loss: Below trendline support at $49.80
Targets: Gap fill at $55.00
Risk/Reward: ~1:1.9
Technical Rationale
📈 Uptrend Intact: Price holding higher lows above rising trendline since April
⭐ Strong Buy Rating: Analysts set 1-year target at $52.00 (+3.4%), signaling upside confidence
🔍 Pattern: Ascending triangle, breakout trigger at $52.05 on daily timeframe
Catalysts & Context
📰 “Strong Buy” consensus, price target upgrade by analysts
🔔 Sector strength in large-cap holding companies
📊 Macro backdrop: Market rotation into value/growth names, risk appetite rising
Trade Management Plan
Entry: Triggered on daily close above $52.05
Stop-loss: Hard stop at $49.80; trail to breakeven if price closes above $53
Scaling: Take 50% profit at $54.00, hold rest for full gap fill at $55.00
Poll
What’s your view? Are you watching KARMAN? Comment below or vote:
🔼 Bullish
🔽 Bearish
🔄 Waiting for confirmation
Follow us for more high-conviction trade ideas & daily setups! 🚨
Disclaimer: Not financial advice. Trade at your own risk.
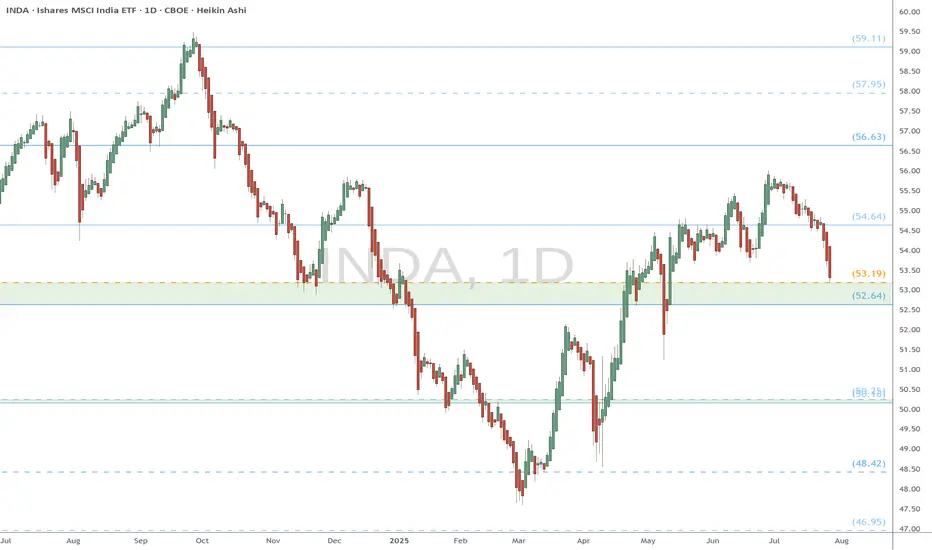
INDA eyes on $52.64-53.19: Major support could mark the BottomINDA painting a bottom with an inverted Head-n-Shoulders.
The neckline happens to be a fib confluence $52.64-53.19
Good spot to consider longs with stop loss just below zone.

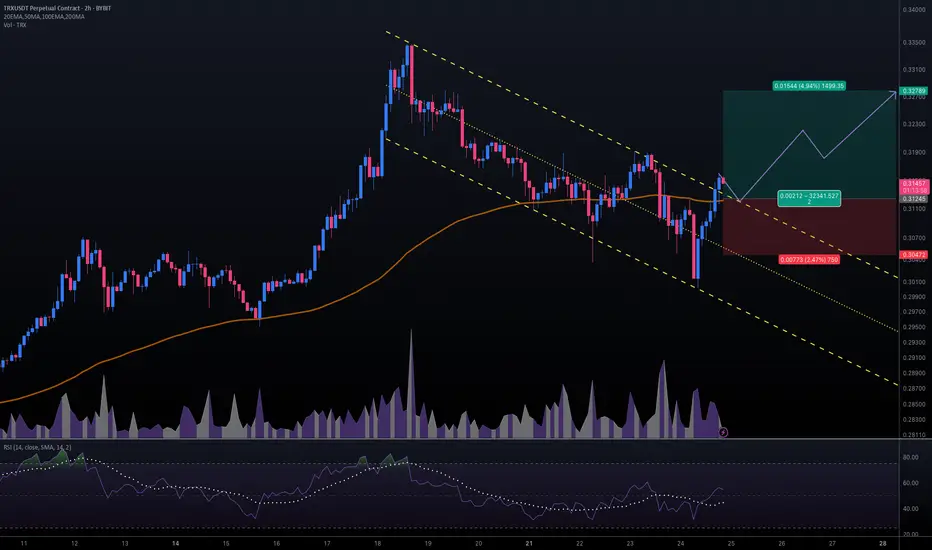
#TRXUSDT #2h (ByBit) Descending channel breakout and retestTron just regained 100EMA support and seems ready for bullish continuation after a pullback to it.
⚡️⚡️ #TRX/USDT ⚡️⚡️
Exchanges: ByBit USDT
Signal Type: Regular (Long)
Leverage: Isolated (16.0X)
Amount: 5.1%
Entry Targets:
1) 0.31245
Take-Profit Targets:
1) 0.32789
Stop Targets:
1) 0.30472
Published By: @Zblaba
CRYPTOCAP:TRX BYBIT:TRXUSDT.P #2h #TRON #DPoS #L1 #Web3 trondao.org tron.network
Risk/Reward= 1:2.0
Expected Profit= +79.1%
Possible Loss= -39.6%
SUNUSDT – One Chart, Three Opportunities☀️ In SUN/USDT, three distinct blue box zones stand out. Each offers its own kind of opportunity — but only if you approach them with structure and discipline.
🎯 Here's How to Use Them
📍 Zone 1 → potential for short-term gains
📍 Zone 2 → better suited for medium-term positioning
📍 Zone 3 → promising long-term risk:reward
But don’t place blind orders — instead:
✅ Set alerts for each zone
✅ When price reaches one, switch to 1H chart
✅ Look for an upward breakout
✅ Confirm with positive & rising CDV
If these conditions align, then — and only then — execute a trade.
"The market pays those who are patient and prepared — not those who guess."
Without confirmation, you're trading hope, not setup.
Let’s stay smart. Let’s stay strategic.
UmutTrades 💙
📌I keep my charts clean and simple because I believe clarity leads to better decisions.
📌My approach is built on years of experience and a solid track record. I don’t claim to know it all but I’m confident in my ability to spot high-probability setups.
📌If you would like to learn how to use the heatmap, cumulative volume delta and volume footprint techniques that I use below to determine very accurate demand regions, you can send me a private message. I help anyone who wants it completely free of charge.
🔑I have a long list of my proven technique below:
🎯 ZENUSDT.P: Patience & Profitability | %230 Reaction from the Sniper Entry
🐶 DOGEUSDT.P: Next Move
🎨 RENDERUSDT.P: Opportunity of the Month
💎 ETHUSDT.P: Where to Retrace
🟢 BNBUSDT.P: Potential Surge
📊 BTC Dominance: Reaction Zone
🌊 WAVESUSDT.P: Demand Zone Potential
🟣 UNIUSDT.P: Long-Term Trade
🔵 XRPUSDT.P: Entry Zones
🔗 LINKUSDT.P: Follow The River
📈 BTCUSDT.P: Two Key Demand Zones
🟩 POLUSDT: Bullish Momentum
🌟 PENDLEUSDT.P: Where Opportunity Meets Precision
🔥 BTCUSDT.P: Liquidation of Highly Leveraged Longs
🌊 SOLUSDT.P: SOL's Dip - Your Opportunity
🐸 1000PEPEUSDT.P: Prime Bounce Zone Unlocked
🚀 ETHUSDT.P: Set to Explode - Don't Miss This Game Changer
🤖 IQUSDT: Smart Plan
⚡️ PONDUSDT: A Trade Not Taken Is Better Than a Losing One
💼 STMXUSDT: 2 Buying Areas
🐢 TURBOUSDT: Buy Zones and Buyer Presence
🌍 ICPUSDT.P: Massive Upside Potential | Check the Trade Update For Seeing Results
🟠 IDEXUSDT: Spot Buy Area | %26 Profit if You Trade with MSB
📌 USUALUSDT: Buyers Are Active + %70 Profit in Total
🌟 FORTHUSDT: Sniper Entry +%26 Reaction
🐳 QKCUSDT: Sniper Entry +%57 Reaction
📊 BTC.D: Retest of Key Area Highly Likely
📊 XNOUSDT %80 Reaction with a Simple Blue Box!
📊 BELUSDT Amazing %120 Reaction!
📊 Simple Red Box, Extraordinary Results
📊 TIAUSDT | Still No Buyers—Maintaining a Bearish Outlook
📊 OGNUSDT | One of Today’s Highest Volume Gainers – +32.44%
📊 TRXUSDT - I Do My Thing Again
📊 FLOKIUSDT - +%100 From Blue Box!
📊 SFP/USDT - Perfect Entry %80 Profit!
📊 AAVEUSDT - WE DID IT AGAIN!
I stopped adding to the list because it's kinda tiring to add 5-10 charts in every move but you can check my profile and see that it goes on..

BANANAS31USDT – Smart Entries, Not Chasing Pumps🍌 BANANAS31USDT – Smart Entries, Not Chasing Pumps
Although price has seen a remarkable rise, I believe the uptrend could still have fuel left in the tank.
I’ve marked two blue boxes as potential entry zones. These are not magic reversal levels — they’re simply areas where I’m willing to observe and possibly take action.
🎯 My Strategy
When price reaches a blue box:
I switch to the 5-minute chart
I watch for an upward breakout
I confirm with a rising CDV (Cumulative Delta Volume)
If it all aligns, I spend one bullet — just one, not the whole magazine. Risk is managed, emotion stays out.
These entries might not flip the market, but they can deliver solid, smart profits if executed with discipline.
“You don’t win by predicting the market — you win by preparing for it.”
As always, don’t chase, don’t rush.
Wait for the plan to meet the price.
— UmutTrades 💙
📌I keep my charts clean and simple because I believe clarity leads to better decisions.
📌My approach is built on years of experience and a solid track record. I don’t claim to know it all but I’m confident in my ability to spot high-probability setups.
📌If you would like to learn how to use the heatmap, cumulative volume delta and volume footprint techniques that I use below to determine very accurate demand regions, you can send me a private message. I help anyone who wants it completely free of charge.
🔑I have a long list of my proven technique below:
🎯 ZENUSDT.P: Patience & Profitability | %230 Reaction from the Sniper Entry
🐶 DOGEUSDT.P: Next Move
🎨 RENDERUSDT.P: Opportunity of the Month
💎 ETHUSDT.P: Where to Retrace
🟢 BNBUSDT.P: Potential Surge
📊 BTC Dominance: Reaction Zone
🌊 WAVESUSDT.P: Demand Zone Potential
🟣 UNIUSDT.P: Long-Term Trade
🔵 XRPUSDT.P: Entry Zones
🔗 LINKUSDT.P: Follow The River
📈 BTCUSDT.P: Two Key Demand Zones
🟩 POLUSDT: Bullish Momentum
🌟 PENDLEUSDT.P: Where Opportunity Meets Precision
🔥 BTCUSDT.P: Liquidation of Highly Leveraged Longs
🌊 SOLUSDT.P: SOL's Dip - Your Opportunity
🐸 1000PEPEUSDT.P: Prime Bounce Zone Unlocked
🚀 ETHUSDT.P: Set to Explode - Don't Miss This Game Changer
🤖 IQUSDT: Smart Plan
⚡️ PONDUSDT: A Trade Not Taken Is Better Than a Losing One
💼 STMXUSDT: 2 Buying Areas
🐢 TURBOUSDT: Buy Zones and Buyer Presence
🌍 ICPUSDT.P: Massive Upside Potential | Check the Trade Update For Seeing Results
🟠 IDEXUSDT: Spot Buy Area | %26 Profit if You Trade with MSB
📌 USUALUSDT: Buyers Are Active + %70 Profit in Total
🌟 FORTHUSDT: Sniper Entry +%26 Reaction
🐳 QKCUSDT: Sniper Entry +%57 Reaction
📊 BTC.D: Retest of Key Area Highly Likely
📊 XNOUSDT %80 Reaction with a Simple Blue Box!
📊 BELUSDT Amazing %120 Reaction!
📊 Simple Red Box, Extraordinary Results
📊 TIAUSDT | Still No Buyers—Maintaining a Bearish Outlook
📊 OGNUSDT | One of Today’s Highest Volume Gainers – +32.44%
📊 TRXUSDT - I Do My Thing Again
📊 FLOKIUSDT - +%100 From Blue Box!
📊 SFP/USDT - Perfect Entry %80 Profit!
📊 AAVEUSDT - WE DID IT AGAIN!
I stopped adding to the list because it's kinda tiring to add 5-10 charts in every move but you can check my profile and see that it goes on..

Dollar Index - Expecting Bullish Continuation In The Short TermH4 - Strong bullish momentum followed by a pullback.
No opposite signs.
Until the two Fibonacci support zones hold I expect the price to move higher further.
If you enjoy this idea, don’t forget to LIKE 👍, FOLLOW ✅, SHARE 🙌, and COMMENT ✍! Drop your thoughts and charts below to keep the discussion going. Your support helps keep this content free and reach more people! 🚀
--------------------------------------------------------------------------------------------------------------------

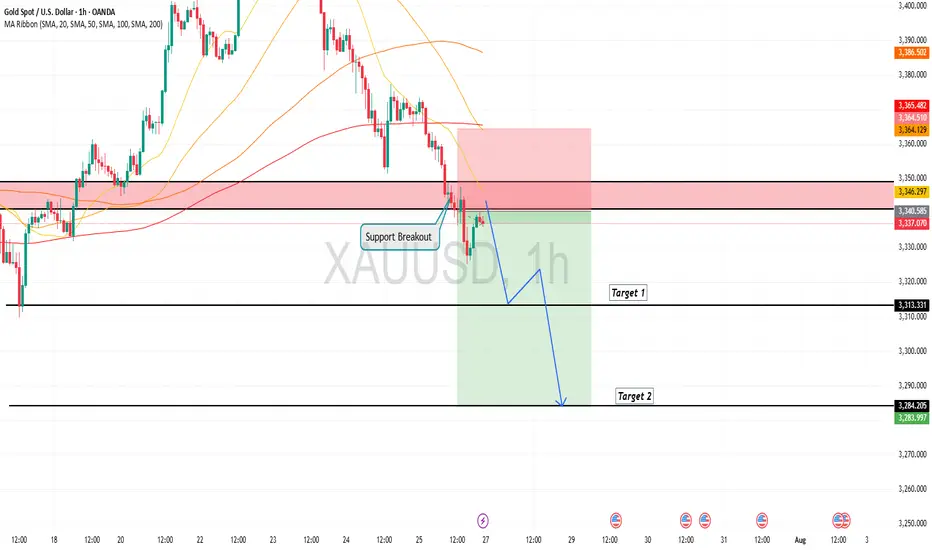
Gold is in the Bearish Direction after Breaking SupportHello Traders
In This Chart GOLD HOURLY Forex Forecast By FOREX PLANET
today Gold analysis 👆
🟢This Chart includes_ (GOLD market update)
🟢What is The Next Opportunity on GOLD Market
🟢how to Enter to the Valid Entry With Assurance Profit
This CHART is For Trader's that Want to Improve Their Technical Analysis Skills and Their Trading By Understanding How To Analyze The Market Using Multiple Timeframes and Understanding The Bigger Picture on the Charts
GBPJPY is Holding above the SupportHello Traders
In This Chart GBPJPY HOURLY Forex Forecast By FOREX PLANET
today GBPJPY analysis 👆
🟢This Chart includes_ (GBPJPY market update)
🟢What is The Next Opportunity on GBPJPY Market
🟢how to Enter to the Valid Entry With Assurance Profit
This CHART is For Trader's that Want to Improve Their Technical Analysis Skills and Their Trading By Understanding How To Analyze The Market Using Multiple Timeframes and Understanding The Bigger Picture on the Charts

GBPAUD is Holding above the Support , All Eyes on BuyingHello Traders
In This Chart GBPAUD HOURLY Forex Forecast By FOREX PLANET
today GBPAUD analysis 👆
🟢This Chart includes_ (GBPAUD market update)
🟢What is The Next Opportunity on GBPJPY Market
🟢how to Enter to the Valid Entry With Assurance Profit
This CHART is For Trader's that Want to Improve Their Technical Analysis Skills and Their Trading By Understanding How To Analyze The Market Using Multiple Timeframes and Understanding The Bigger Picture on the Charts

Natural Gas is in the Buying DirectionHello Traders
In This Chart NATGAS HOURLY Forex Forecast By FOREX PLANET
today NATGAS analysis 👆
🟢This Chart includes_ (NATGAS market update)
🟢What is The Next Opportunity on NATGAS Market
🟢how to Enter to the Valid Entry With Assurance Profit
This CHART is For Trader's that Want to Improve Their Technical Analysis Skills and Their Trading By Understanding How To Analyze The Market Using Multiple Timeframes and Understanding The Bigger Picture on the Charts

GOLD Slips as Dollar Gains on Trade Deal – Bearish Below 3349
Gold Pares Gains as USD Strengthens on Trade Deal Ahead of Fed
Gold gave up early gains, pressured by a stronger U.S. dollar after the announcement of the US–EU trade agreement.
Meanwhile, attention shifts to upcoming U.S.–China negotiations later today, as both sides aim to extend the current trade truce and avoid new tariffs.
Investors are also closely watching the Federal Reserve’s policy decision on Wednesday, seeking signals on future interest rate moves.
TECHNICAL OUTLOOK:
Gold maintains a bearish trend while trading below 3349, with potential downside toward 3320.
A 1H candle close below 3320 – 3312 would confirm extended bearish pressure targeting 3285, driven in part by ongoing geopolitical risks.
⚠️ To shift back to a bullish structure, the price must stabilize above 3349.
Key Levels:
• Support: 3320 – 3285 – 3256
• Resistance: 3365 – 3375

The latest trend analysis and layout of the day,flexible adoptio#XAUUSD
⚠️News focus on the Sino-US trade talks, which may affect the gold trend.
Since the opening of the market today, gold has been fluctuating in a narrow range in the short term, without giving a clear trading direction🤔, and the short-term trend has not changed much.📊
🚦It remains constrained by resistance and a downward trend. In the short term, we need to pay attention to the 3300 mark below and the support of 3295-3285📈. On the upside, we should pay attention to the short-term suppression level of 3321-3333 and yesterday's high of 3345-3350.📉
In the short term, as long as it does not break through yesterday's high point, the volatile downward trend will not change. 🐂Once it breaks through, the short-term decline will stop, and the market will continue the bull rebound to test 3370~3380 or even 3400 before falling again.
Therefore, short-term trading focuses on the 3300 mark below and the long trading opportunities at 3295-3285. On the upside, defend the 3345-3350 highs and establish short positions.🎯
🚀 BUY 3310-3330
🚀 TP 3321-3333
🚀 BUY 3295-3285
🚀 TP 3310-3330
🚀 SELL 3320-3330
🚀 TP 3310-3300
🚀 SELL 3345-3350
🚀 TP 3330-3285

BankNifty levels - Jul 30, 2025Utilizing the support and resistance levels of BankNifty, along with the 5-minute timeframe candlesticks and VWAP, can enhance the precision of trade entries and exits on or near these levels. It is crucial to recognize that these levels are not static, and they undergo alterations as market dynamics evolve.
The dashed lines on the chart indicate the reaction levels, serving as additional points of significance. Furthermore, take note of the response at the levels of the High, Low, and Close values from the day prior.
We trust that this information proves valuable to you.
* If you found the idea appealing, kindly tap the Boost icon located below the chart. We encourage you to share your thoughts and comments regarding it.
Wishing you successful trading endeavors!

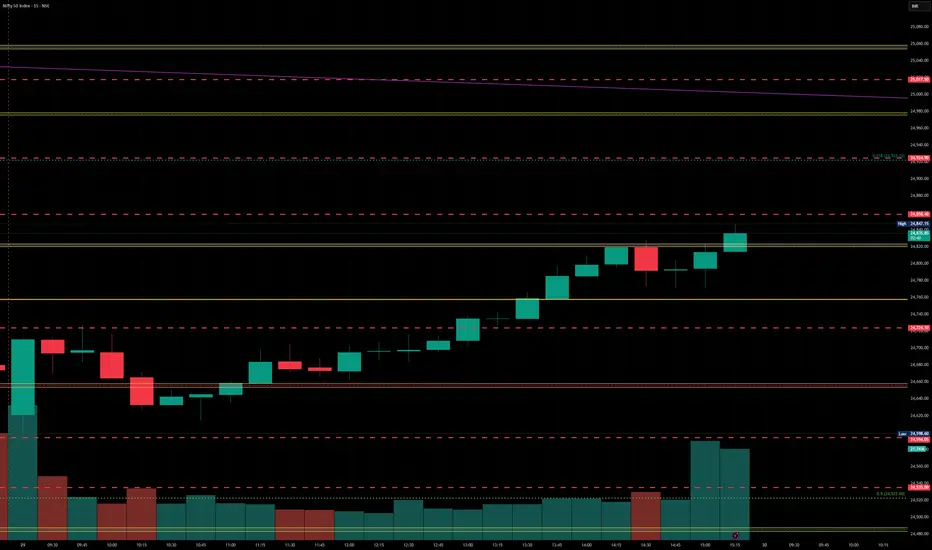
Nifty levels - Jul 30, 2025Nifty support and resistance levels are valuable tools for making informed trading decisions, specifically when combined with the analysis of 5-minute timeframe candlesticks and VWAP. By closely monitoring these levels and observing the price movements within this timeframe, traders can enhance the accuracy of their entry and exit points. It is important to bear in mind that support and resistance levels are not fixed, and they can change over time as market conditions evolve.
The dashed lines on the chart indicate the reaction levels, serving as additional points of significance to consider. Furthermore, take note of the response at the levels of the High, Low, and Close values from the day prior.
We hope you find this information beneficial in your trading endeavors.
* If you found the idea appealing, kindly tap the Boost icon located below the chart. We encourage you to share your thoughts and comments regarding it.
Wishing you success in your trading activities!
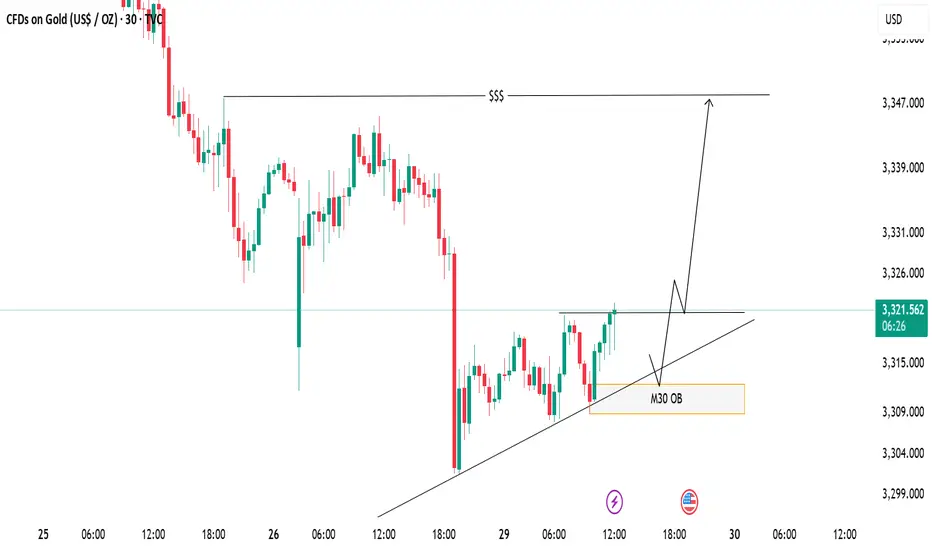
XAUUSD Eyeing Liquidity Grab – M30 OB Zone in PlayPrice is respecting the ascending trendline and consolidating near a key resistance level. A bullish breakout is expected, with a potential retest of the trendline and the M30 Order Block (OB) zone acting as a key demand area.
📈 Trade Plan:
Wait for a minor pullback into the OB and trendline confluence
Look for bullish confirmation to go long
Target the liquidity zone above (around 3347)
📌 A clean structure and bullish order flow hint at a continuation to the upside.