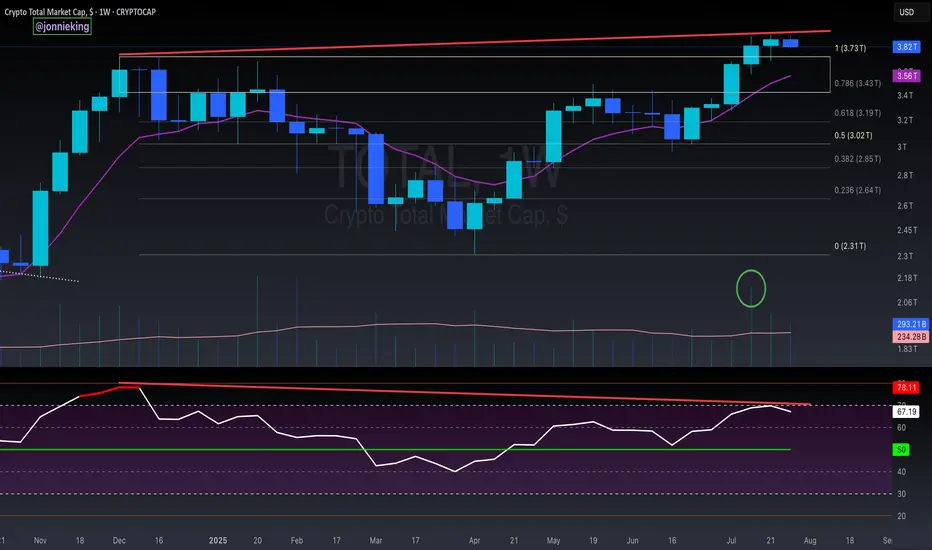
$TOTAL Market Cap Highest Weekly Close - Bearish Divergence?!Once again, highest Weekly Close on the Crypto CRYPTOCAP:TOTAL Market Cap ever.
PA continues to trend above the EMA9 and POI.
It’s worth noting Bearish Divergence on this local level.
I do not believe this is much to worry about however and have discussed this in prior analysis which I will post in the comments.
Strong Volume has shifted in the Bulls favor.
Bulls want to keep PA above $3.7T
Support and Resistance
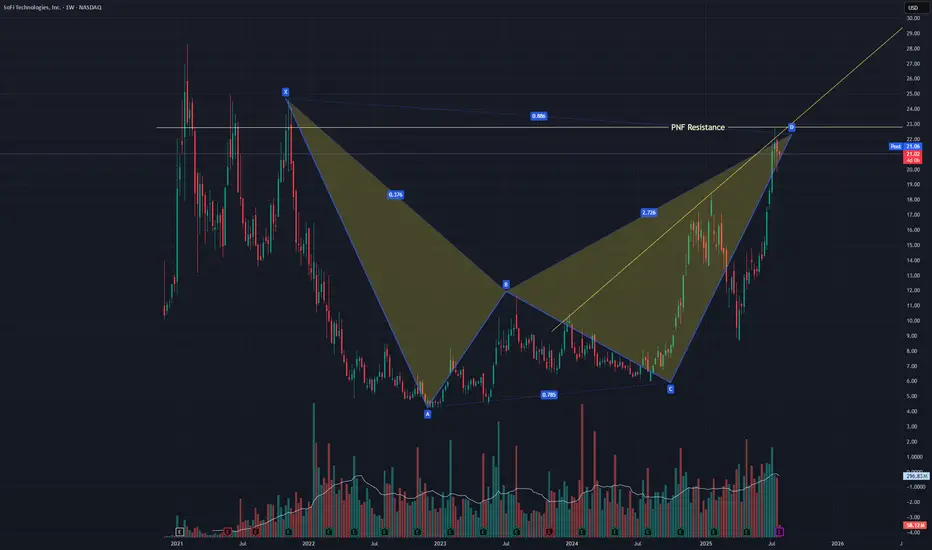
SOFI Pullback most likely comingNASDAQ:SOFI just finished a bearish bat harmonic and failed to break a resistance line I have from a PNF chart. It also failed a back test of a trendline of resistance in this uptrend. A pullback is likely but in this irrational market any thing could happen. I did a strangle +-5% just in case. I would not be surprised if I can close both with 20%+ profit.
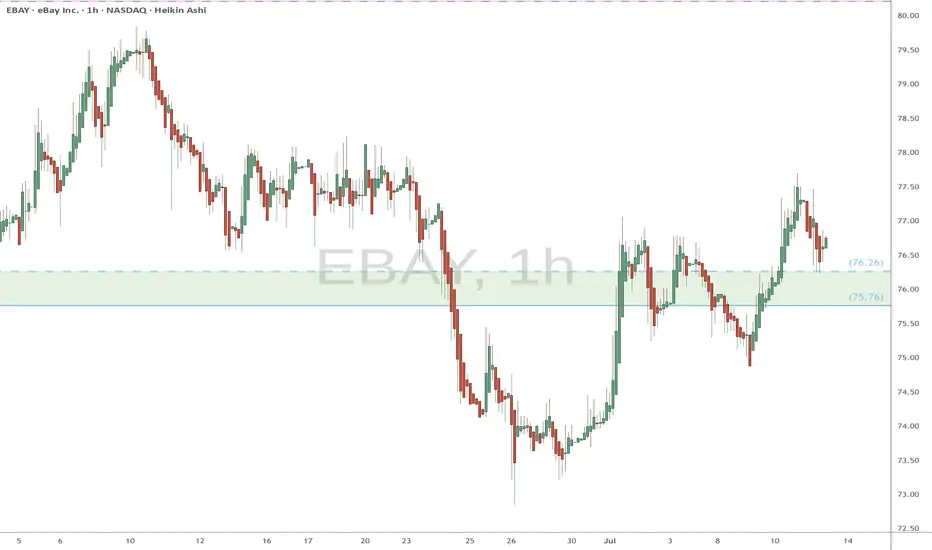
EBAY watch $75.76-76.26: Key Support zone to launch next Leg UP EBAY trying to get back above its ATH from 2021.
Now testing a key support zone at $75.76-76.26.
Good but late long entry with StopLoss just below.
.
See "Related Pubications" for previous charts such as THE BOTTOM call:
Hit the BOOST and FOLLOW for more PRECISE and TIMELY charts.
=========================================================
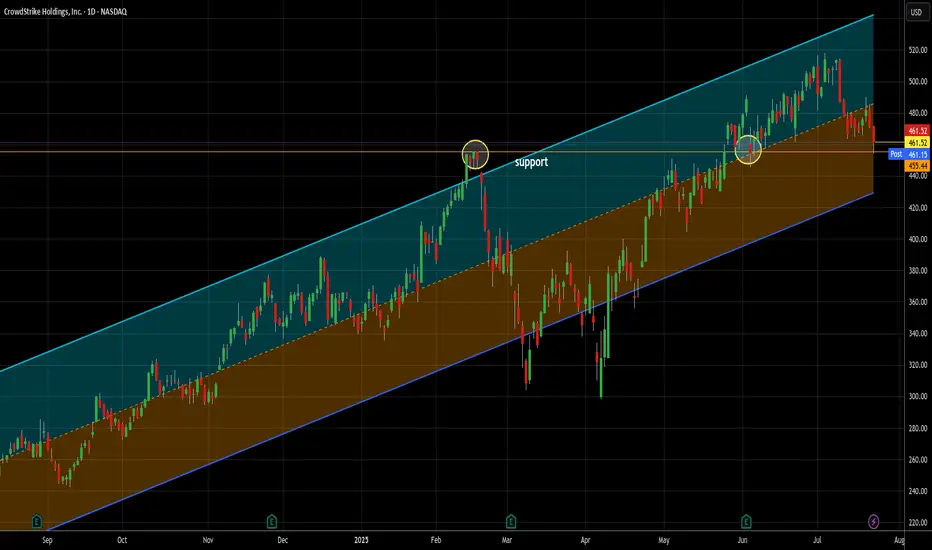
The only way to fight AI is with AI -- long at 461.52I love cybersecurity stocks generally. As our lives become ever more embedded in the electronic world, their necessity increases. As AI driven threats are sure to rise (Sam Altman, founder of OpenAI, spoke to a financial conference this week about the rising threat of AI driven banking fraud), the only way to combat it effectively is with AI. Crowdstrike, along with Palo Alto, are leading the charge in this area and I think will be another great example of AI ultimately being better than humans at the job they need to do here.
Yes, it's a story stock, but you know me - the story is the trading data. So here it is. In the last 12 months, 21 signals. 21 wins, 0 losses. Average trade length = 6.7 days (though that's misleading since all but 4 trades closed in less than that and 20 of 21 were 10 days or less). Average gain was 4.46% - that's an average of .67% per day held. That's almost 16x the long term daily rate of return of SPX and almost 10x the daily return of the Nasdaq 100 in the last year.
Additionally, it bounced off support near today's low and finished stronger. That's always good to see. I will happily add more if my signals suggest it, but of the 21 signals, only once did it produce 2 open lots at once. Nornally, it was one lot paying quickly. 2/3 of the trades closed in less than one week.
As always - this is intended as "edutainment" and my perspective on what I am or would be doing, not a recommendation for you to buy or sell. Act accordingly and invest at your own risk. DYOR and only make investments that make good financial sense for you in your current situation.
SPX500USD | Bulls Lose Steam at 6,424.5 ResistanceThe S&P 500 Index showed strong bullish momentum but is now pulling back after tagging resistance at 6,424.5. Price is currently hovering near 6,374.6, where previous structure may act as support.
Support at: 6,374.6 / 6,340.0 🔽
Resistance at: 6,424.5 🔼
🔎 Bias:
🔼 Bullish: Bounce from 6,374.6 and reclaim of 6,424.5 signals continuation.
🔽 Bearish: Break below 6,374.6 exposes 6,340.0 and lower zones.
📛 Disclaimer: This is not financial advice. Trade at your own risk.

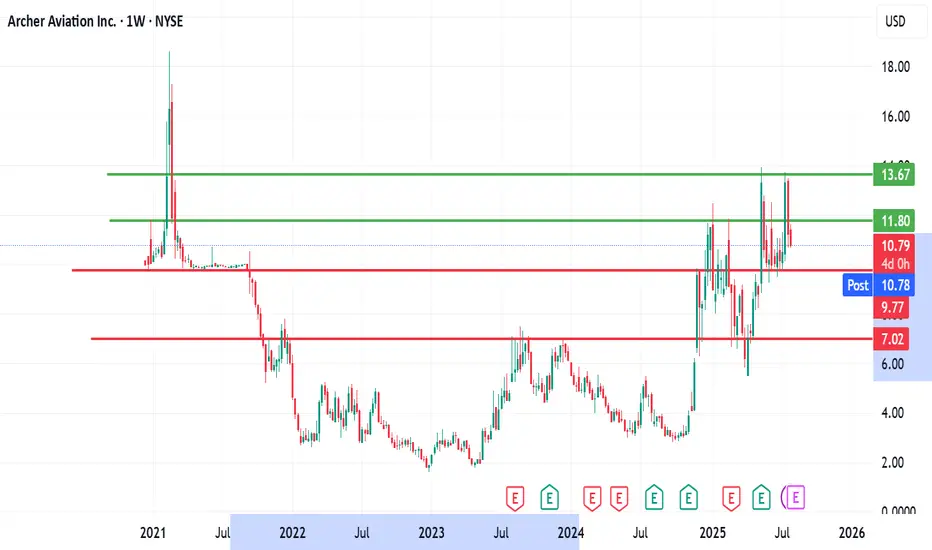
Archer Aviation (ACHR) Faces Continued Pressure – Key SupportArcher Aviation (ACHR) Faces Continued Pressure – Key Support Levels.
Archer Aviation (NYSE: ACHR) continues to face downward pressure, extending its decline after closing last week with a loss of over 18%.
As of the time of writing, the stock is down an additional 4.6%, trading around the $10.78 mark.
From a technical perspective, the $9.70 zone appears to be the next significant support level.
Should the stock reach this point, I intend to begin accumulating shares using a dollar-cost averaging (DCA) strategy.
It’s important to note that a break below this level remains possible, given that the eVTOL (electric Vertical Takeoff and Landing) industry is still in its early stages of adoption and remains highly speculative.
Caution and a long-term perspective are essential when approaching investments in emerging sectors like this.
I look forward to connecting with you.
Please, like, share, comment and follow me here
JOBy Aviation (JOBY) Price Action and Accumulation OutlookJOBy Aviation (JOBY) Price Action and Accumulation Outlook.
JOBy Aviation (NASDAQ: JOBY) has experienced a notable upward trend since its reversal on April 7, 2025, when it was trading around $4.96. The stock reached an all-time high of approximately $18.60 on July 25, 2025.
However, in today’s trading session, the stock declined by over 8%, testing a key support level at $17.00. From a technical standpoint, if this support level fails to hold, the next potential downside target could be around $14.00.
At this level, I plan to begin accumulating shares using a dollar-cost averaging (DCA) strategy. Should Fibonacci retracement levels become relevant in the correction, we may see the price retrace to the 50% level, which lies around $12.00 per share — a zone that could offer an attractive long-term entry point.
Given JOBY’s position as a frontrunner in the eVTOL (electric Vertical Takeoff and Landing) sector, this may represent a long-term investment opportunity worth considering.
I look forward to connecting with you.
Let's keep winning together

US100 (NASDAQ 100 Index) – Breakout with Clear Upside ProjectionUS100 has broken out cleanly above the key resistance at 22,097.1, indicating bullish continuation. The breakout is supported by strong upward momentum, targeting the next key level around 23,441.9, as illustrated by the projected range.
Support at: 22,097.1 🔽 | 20,750.0 🔽
Resistance at: 23,441.9 🔼
🔎 Bias:
🔼 Bullish: Sustained price action above 22,097.1 keeps the bullish breakout valid, aiming toward 23,441.9.
🔽 Bearish: A drop back below 22,097.1 would invalidate the breakout, possibly pulling price toward 20,750.0.
📛 Disclaimer: This is not financial advice. Trade at your own risk.

CCJ eyes on $45.37: semi-major Fib may dip to $42 for long entryCCJ trying to recover from the nuclear bubble burst.
Currently testing a semi-major Covid fib at $43.37
If it dips then watch the support zone $42.31-42.91

$CMG Approaching Major Support – Buy the Dip or Breakdown?Chipotle ( NYSE:CMG ) just reported earnings and missed on both revenue and same-store sales. Transactions fell 4.9%, and the company lowered its full-year outlook — triggering a sharp decline on elevated volume.
Technically, we’re approaching a major confluence of support near the $43 area (both diagonal trendline support and historical horizontal level).
🔻 Indicators currently suggest continued selling pressure, so traders looking to buy the dip should remain cautious.
Trade Setup Idea:
- Watch for bullish reversal patterns (engulfing, double bottom, trend shift) on 15min–1hr charts
- Avoid premature entries; trend reversals often take time
- NYSE:CMG Confirmation > prediction
📌 Keep alerts set. This one’s worth watching closely.
#CMG #Chipotle #TradingView #TechnicalAnalysis #SupportAndResistance #DipBuy #StocksToWatch

NASDAQ Potential UpsidesHey Traders, in today's trading session we are monitoring NAS100 for a buying opportunity around 23,140 zone, NASDAQ is trading in an uptrend and currently is in a correction phase in which it is approaching the trend 23,140 support and resistance area.
Trade safe, Joe.

EURUSD Potential UpsidesHey Traders, in today's trading session we are monitoring EURUSD for a buying opportunity around 1.16 zone, EURUSD is trading in an uptrend and currently is in a correction phase in which it is approaching the trend at 1.16 support and resistance area.
Trade safe, Joe.

NASDAQ Potential UpsidesHey Traders, in today's trading session we are monitoring NAS100 for a buying opportunity around 23,300 zone, NASDAQ is trading in an uptrend and currently is in a correction phase in which it is approaching the trend at 23,300 support and resistance area.
Trade safe, Joe.

ORCL heads up at $212 then 220: Double Golden Fibs may STOP runORCL has been flying off the last Earnings report.
About to hit DUAL Golden fibs at $212.67-220.21
Ultra-High Gravity objects in its price-continuum.
It is PROBABLE to consolidate within the zone.
It is POSSIBLE to reject and dip to a fib below.
It is PLAUSIBLE but unlikely to blow thru them.
.
My last Plot that caught the BreakOut EXACTLY:
=================================================
.

Gold Could Show there Potentially BearishGold is currently consolidating, but a downtrend range is forming based on the prevailing market setup. After erasing early gains, XAUUSD stabilized near 3340 on Monday, with downside pressure largely influenced by a stronger U.S. Dollar following the announcement of the US-EU trade agreement.
Price rejected sharply from the 3340 resistance zone, suggesting continued bearish momentum. A minor pullback was seen after testing the upper boundary, with sellers regaining control near resistance. Traders are closely watching the 3350–3362 resistance zone, where another rejection could fuel a fresh downside move A confirmed breakdown below 3312 could open the path toward 3282 in the short term.
Ps: Support with like and comments for more better analysis.

UK100 | Price Pulls Back After Testing 9,179.72 ResistanceThe FTSE 100 recently tagged 9,179.72, a fresh high, before pulling back slightly. Price remains above the 21-period SMA (blue), indicating the uptrend is still intact, though short-term weakness is surfacing. Immediate support sits at 9,036.17.
Support at: 9,036.17 / 8,889.95 🔽
Resistance at: 9,179.72 🔼
🔎 Bias:
🔼 Bullish: Bounce off the 21 SMA and reclaim 9,179.72 confirms continuation.
🔽 Bearish: Break below 9,036.17 opens room to 8,889.95.
📛 Disclaimer: This is not financial advice. Trade at your own risk.

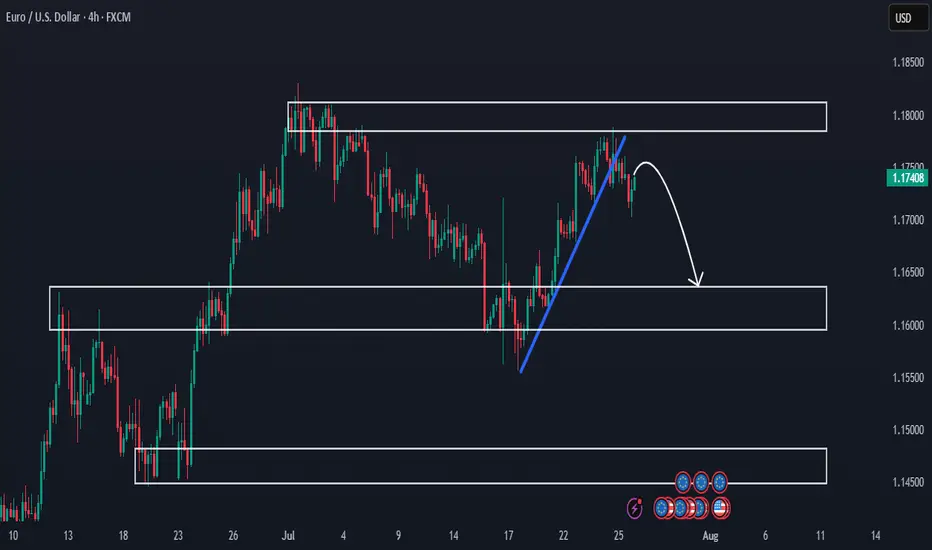
Premarket Analysis - Will Price Head Lower?Hello everybody!
We’re looking at three key areas on the chart.
Price has been rejected from a supply zone.
The clean upward trendline has been broken, and we expect the price to move lower this week.
If the drop continues, we’ll look to sell and aim for the more likely target around 1.16400.
Then we’ll see whether this first demand/support area holds or not.
Have a good trading week ahead!
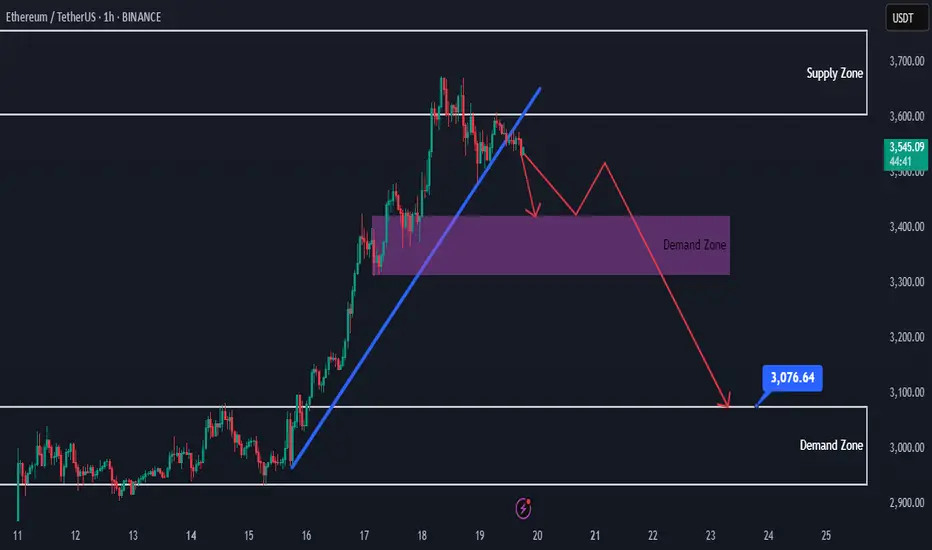
Ethereum at Key Supply — Short-Term Sell OpportunityHello everybody!
Ethereum has reached a strong supply/resistance area in the daily timeframe.
As we see on the chart, lower highs have started to forming.
In addition to that, an upward trendline has been broken.
Keeping in mind that overall trend is bullish, we can look to short time sell positions here.
The first target can be 3300-3400.
If the price breaks below 3300, we can expect it to go lower toward 3100 area.
Manage your risk and trade safe!
EUR/GBP sell opportunity confirmed!EURGBP plummeted over 0.76% today from its high. It’s now confirmed that we could experience a correction on the weekly high. A sell opportunity is envisaged from the H4 timeframe.

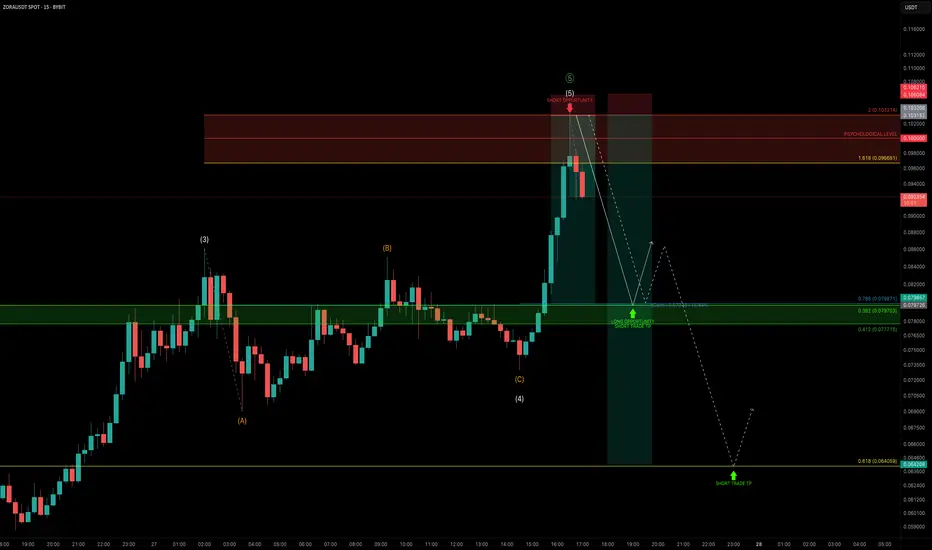
ZORA — Parabolic Rally Nearing ExhaustionZORA has been on an explosive run, pumping +1239% in just 20 days. But after such a vertical move, the question is:
Is this rally nearing exhaustion?
Let’s dive into the technicals 👇
🧩 Elliott Wave Structure
Looking at price action through the lens of Elliott Wave Theory, ZORA appears to be completing its 5th wave:
➡️ Wave 3–4 zone: Held around the $0.05 trading range
➡️ Wave 5: Now pushing into the $0.097–$0.103 zone
This area aligns with:
The 1.618–2.0 Fib extension pocket — a typical exhaustion zone for wave 5s
The $0.10 psychological level
🔴 Short Trade Setup
This zone between $0.097–$0.103 is the ideal reversal area to consider shorting, with clearly defined targets and confluence:
Entry: $0.097 – $0.103
Stop-Loss: Above the 2.0 Fib Extension
TP1: Around $0.08
TP2: Around $0.064
Confluence: TP1
Daily Open (dOpen)
0.786 Fib of the local move
0.382 Fib of the 5-wave structure
TP2 (Lower Target):
0.618 Fib retracement of the 5-wave move at $0.064
Risk-to-Reward:
TP1 gives an R:R of 1:8
TP2 offers potential 1:13+
Watch for signs of weakness.
_________________________________
💬 If you found this helpful, drop a like and comment!
Want breakdowns of other charts? Leave your requests below.
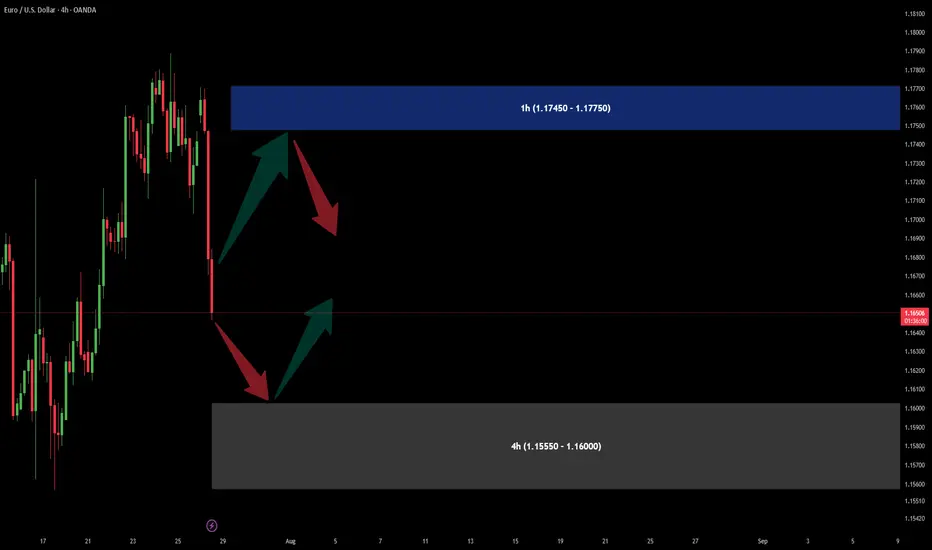
A Sell & A Buy OFFER for EURUSDThere is a Demand area in 4h time frame near (1.15550 - 1.16000) and a good support area in (1.17450 - 1.17750) zone.
S/L would be under (over in sell) zones which I have specified.
Nifty Analysis EOD – July 28, 2025 – Monday 🟢 Nifty Analysis EOD – July 28, 2025 – Monday 🔴
⚡️ Bears Bite Back After a Hopeful Morning Surge
📊 Nifty Summary
Nifty opened with a minor gap-down of 32 points and slipped an additional 67 points in the first 3 minutes, testing the critical support zone of 24,755 ~ 24,729. After marking a day low at 24,732.70, it witnessed a sharp recovery breaching key levels — CDO, Gap, PDC — and touched the CPR BC level. Rejection from there caused a retracement to the mean, followed by another successful attempt breaching CPR BC and IB High. However, it couldn’t sustain above, as profit booking and pressure from a higher time frame bearish trendline dragged the index below the CPR zone and even past the PDL.
Support at 24,780 offered brief relief, but a bearish triangle formed between the HTF trendline and that support and The breakdown at 12:40 led to a clean move, with the pattern target achieved.
🕯 5 Min Time Frame Chart with Intraday Levels
🔁 Trend & Zone Update
📍 Resistance Zone Shifted To: 25,100 ~ 25,120
📍 Support Zone Shifted To: 24,520 ~ 24,480
🧭 What If Plans – 29th July Outlook
🅰️ Plan A (Contra Long Setup)
If market opens inside the previous day range and finds support at 24,700 ~ 24,729,
→ Potential targets: 24,780, 24,815, 24,840
🅱️ Plan B (Trend is Friend – Short Continuation)
If market opens inside range and faces resistance around 24,830 ~ 24,815,
→ Aim for: 24,780, 24,720, 24,640, 24,580
🔄 On-the-Go Plan
If market Gaps Up/Down outside previous day’s range,
→ Wait for IB formation and act based on structure & S/R levels.
🕯 Daily Time Frame Chart with Intraday Levels
🕯 Daily Candle Breakdown
Open: 24,782.45
High: 24,889.20
Low: 24,646.60
Close: 24,680.90
Change: −156.10 (−0.63%)
🕯 Candle Structure Breakdown:
Real Body: 101.55 pts (Red candle, bearish)
Upper Wick: 106.75 pts (Long — rejection from highs)
Lower Wick: 34.30 pts (Defended slightly)
🕯 Interpretation:
Tried to rally above 24,880 but faced aggressive selling. Closed well below open, forming a bearish rejection candle resembling a shooting star. Bears clearly took control after the intraday bounce attempt.
🕯 Key Insight:
Selling pressure visible from 24,880–24,900 zone.
Close below 24,700 keeps bearish tone intact.
Next Support: 24,650–24,620.
Bulls' challenge: Reclaim and close above 24,850.
🛡 5 Min Intraday Chart
⚔️ Gladiator Strategy Update
ATR: 197.91
IB Range: 122 → Medium
Market Structure: Imbalanced
Trades Triggered:
09:27 – Long Entry → 🎯 Target Hit (1:1.5 R:R)
12:40 – Short Entry → 🎯 Target Hit (1:2.5 R:R)
🧱 Support & Resistance Levels
Resistance Zones:
📍 24,729
📍 24,780
📍 24,815 ~ 24,830
📍 24,850
📍 24,920
Support Zones:
📍 24,640
📍 24,580
📍 24,520 ~ 24,480
💭 Final Thoughts
🧠 “Every breakout starts with hesitation — but not every hesitation leads to a breakout.”
Today’s structure showed strong indecision, but sellers used it to dominate.
Monday’s triangle breakdown proved that structure plus patience = power. Keep your bias flexible and trust your levels.
✏️ Disclaimer
This is just my personal viewpoint. Always consult your financial advisor before taking any action.

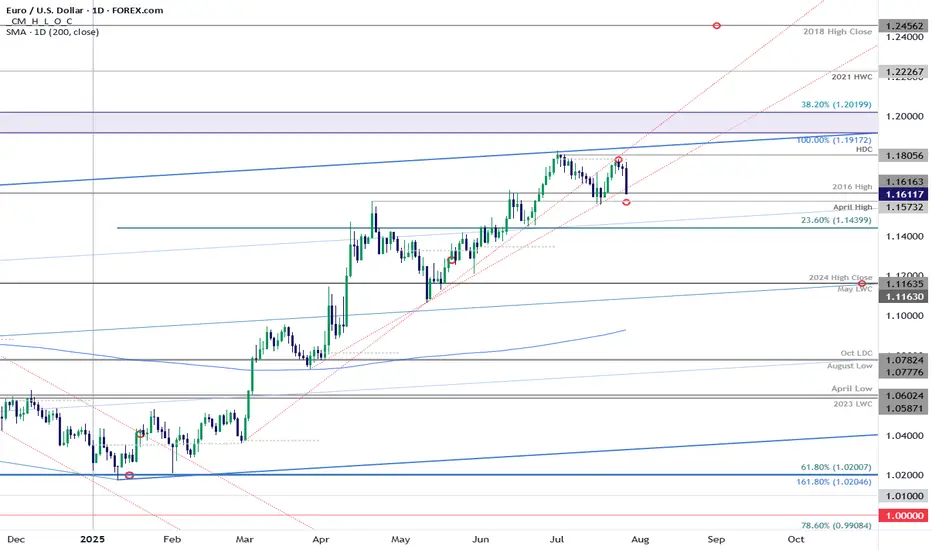
EUR/USD: Euro Poised for Monthly Range Breakout Ahead of FedEuro defended resistance at the monthly opening-range high / July open at 1.1787-1.1805 last week with price plunging back into support today at the late-February trendline / 2016 high at 1.1616.
Medium-term bullish invalidation rests with the April high at 1.1573 and a close below this level would suggest a more significant high is in place / a larger correction is underway. Stay nimble here into the monthly-cross and watch the weekly closes for guidance.
-MB