Solana (SOL) Revs Up Again — Fresh Breakout Above $200 in Sight?After months of consolidation, Solana (SOL) is once again showing signs of bullish momentum, trading near $176 and rapidly approaching a potential breakout level of $200. Investors and analysts alike are paying close attention, as on-chain activity and ecosystem development provide a compelling case for a renewed upward trajectory.
With growing demand for high-throughput blockchain infrastructure and new institutional integrations, Solana is positioning itself as more than just an Ethereum alternative—it’s emerging as a core infrastructure layer for high-performance Web3 applications.
Institutional Momentum Gathers Pace
In the last three weeks, several high-profile announcements have bolstered confidence in the Solana ecosystem. Fidelity Digital Assets revealed it is piloting tokenized bond products on Solana’s network, citing its fast settlement time and composability.
Meanwhile, Visa expanded its USDC settlement pilot on Solana across five countries, reinforcing the blockchain’s real-world financial use cases.
“Solana is no longer just retail-driven,” said Karla Nunez, digital asset strategist at ApexBridge. “Institutions are beginning to build directly on it—and that changes the dynamic.”
Ecosystem Growth and Developer Activity
The number of active developers on Solana has surged 38% quarter-over-quarter, according to Electric Capital’s Developer Report. Projects in DeFi, gaming, and NFTs continue to attract users, helped by extremely low transaction costs and sub-second finality.
Notably, the Solana Foundation recently launched a $100 million grant fund for AI-integrated crypto applications, which could catalyze the next wave of user adoption.
Technical Indicators Support Breakout Narrative
SOL has outperformed major altcoins this month, rising 21% in July. The token is now trading above its 50-day and 100-day moving averages, and momentum indicators suggest a potential breakout above the key psychological barrier at $200.
A confirmed break would likely open the door to $240–$260, with minimal historical resistance in that zone.
Macro Factors Provide Tailwind
The broader crypto market is recovering as inflation metrics cool and expectations for central bank easing rise. Solana, with its high beta to market movements, often leads altcoin rallies during bullish pivots.
Furthermore, the recent dip in Ethereum gas prices has had limited impact on Solana’s user base, suggesting its appeal is increasingly based on performance, not cost arbitrage.
Conclusion
While risks remain—from network outages to broader market volatility—Solana’s resurgence appears fundamentally supported. With institutional interest rising, technical signals aligning, and ecosystem momentum building, a clean break above $200 could mark the beginning of a new cycle for SOL.
For investors seeking exposure to high-speed smart contract platforms with real-world traction, Solana may be nearing another defining moment.
Support and Resistance
USDJPY Potential UpsidesHey Traders, in today's trading session we are monitoring USDJPY for a buying opportunity around 147.800 zone, USDJPY is trading in an uptrend and currently is in a correction phase in which it is approaching the trend at 147.800 support and resistance area.
Trade safe, Joe.

DeGRAM | DOGEUSD above the support level📊 Technical Analysis
● DOGE keeps printing higher swing-lows inside the 5-month rising channel; the latest pull-back bounced precisely at the mid-band/0.232 support, turning May’s flag roof into demand.
● A fresh micro bull-flag is unfolding above that rail; its pole height and channel geometry project follow-through toward the upper red supply 0.288-0.300 where the purple macro cap meets the channel crest.
💡 Fundamental Analysis
● Binance confirmed its late-July quarterly burn will include >150 M DOGE trading-fee tokens, trimming float, while reports of X testing DOGE micro-payments boosted social volume this week.
✨ Summary
Long 0.232-0.245; hold above 0.232 targets 0.272 → 0.288. Invalidate on a 16 h close below 0.214.
-------------------
Share your opinion in the comments and support the idea with a like. Thanks for your support!

EURUSD LOSSES BULLISH MOMENTUM. WHERE TO GO?EURUSD LOSSES BULLISH MOMENTUM. WHERE TO GO?
The asset didn't reach the local resistance of 1.18300 and started to consolidate before reaching this level. RSI shows weakness of the impulse on 4-h chart, as well as MACD is in the red zone. Therefore, we expect the price to slowly decline towards local trendline, where SMA200 is situated.

GBPUSD ANALYSIS After seeing the weekly find support at the low of the previous bullish candle we could be looking for a push up on this pair but waiting to see how the pair trades for the London session today and if there will be a break of resistance on the 4hr timeframe

EURUSD Did Not Like the EU–US DealThe heavily one-sided EU–US deal has put negative pressure on EURUSD. Ahead of a crucial week filled with major events, including GDP data from both the Eurozone and the US, the PCE report, payrolls, and meetings from the FOMC and BOJ, EURUSD has broken a short-term head and shoulders formation. The pattern's target is near 1.1610.
A retest of the broken support is possible and could even extend to 1.1725. However, unless sentiment changes due to some news, this move may offer only a selling opportunity. The downward trend could also continue without pause.
Options market activity suggests that the 1.16 to 1.18 range is viewed as a "safe zone," with large players likely aiming to keep EURUSD within this band for the week. If the head and shoulders target is reached, EURUSD might stabilize and bounce around the 1.16 level.

DeGRAM | EURUSD is correcting from the channel boundary📊 Technical Analysis
● A second rejection at the upper channel/1.1780 supply (red arrows) signals overextension; price is retracing toward the mid-July demand cluster where the rising-channel floor and prior swing base intersect near 1.1600.
● Momentum remains positive on higher-time-frame: each pull-back since May has held the channel support, and the current decline is unfolding as a corrective ABC that projects into 1.1585-1.1620 — a historically bid zone.
💡 Fundamental Analysis
● Softer US Q2-GDP deflator cooled 2-yr yields, while July Euro-area CPI flash is expected to stay sticky, trimming the Fed–ECB policy gap and limiting EUR downside.
✨ Summary
Buy 1.1585-1.1620; hold above 1.1594 targets 1.1687 → 1.1780. Long view invalidated on an H4 close below 1.1530.
-------------------
Share your opinion in the comments and support the idea with a like. Thanks for your support!

GBPAUD SHORT Market structure bearish on HTFs DH
Entry at both Weekly and Daily AOi
Weekly Rejection at AOi
Daily Rejection at AOi
Previous Structure point Daily
Around Psychological Level 2.05500
H4 EMA retest
H4 Candlestick rejection
Rejection from Previous structure
Levels 3.78
Entry 100%
REMEMBER : Trading is a Game Of Probability
: Manage Your Risk
: Be Patient
: Every Moment Is Unique
: Rinse, Wash, Repeat!
: Christ is King.

EURJPY → Retest support before growthFX:EURJPY has been correcting since the opening of the European session. The movement was triggered by yesterday's news related to the trade deal between the US and Europe...
EURJPY is reacting to news related to the deal between the US and Europe. A correction is forming amid the fall of the euro, but against the backdrop of the dollar's growth, the currency pair has a chance to rise if the bulls keep the price in the buying zone relative to the support level of 173.08.
The dollar is rising, and against this backdrop, the Japanese yen is falling. Bulls have every chance of holding their ground above the previously broken resistance. If the market confirms support, we will have chances for growth.
Resistance levels: 173.87
Support levels: 173.082, 172.47
The currency pair may form a liquidity trap relative to the previously broken consolidation resistance. A false breakdown of support and price consolidation in the buying zone (above 173.1) could trigger further growth.
Best regards, R. Linda!

BTCUSD IS READY TO BREAK THE DESCENDING CHANNELBTCUSD IS READY TO BREAK THE DESCENDING CHANNEL
In our latest report we wrote down that the asset may rebound from lower border of the descending channel and head toward local resistance level of 120,000.00. The forecast has successfully worked out, so what's next?
Currently the price consolidates slightly below the upper border of the descending channel and local resistance level of 120,000.00. Although, the RSI and MACD confirm bullish impulse and, in general, the asset is in mid-term bullish trend, still would be safer for long trade to wait for a breakout of the resistance with first target of 123,190.30 (ATH).

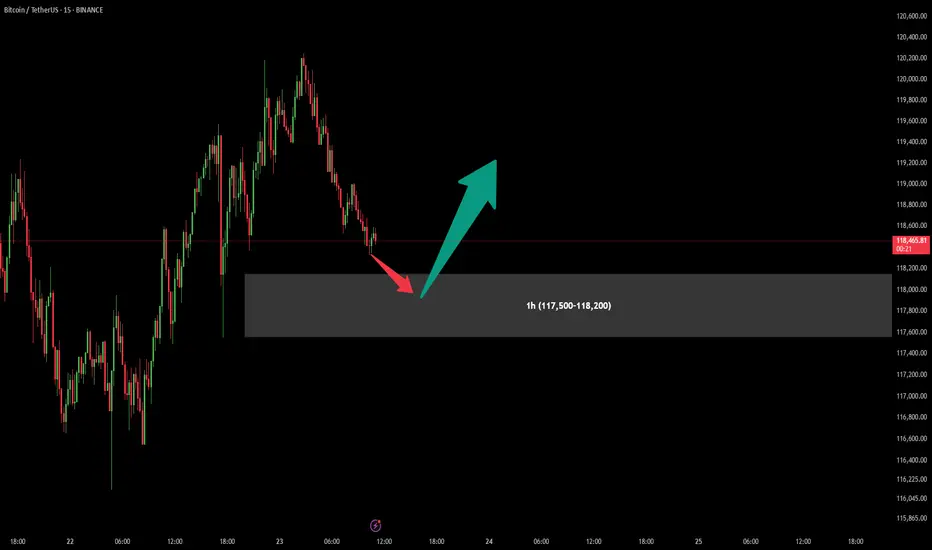
BitCoin BUY OfferAfter previous signal which have given us a good profit (more than 1:10 Risk to Reward), There is another chance for one more Buy position in specified are (117,500-118,200).
Attention : In my chart areas Stop Loss would be under the area (Over the area in Sell positions) and first Take Profit sets for at least R:R = 1:1
Let's see what will happen...
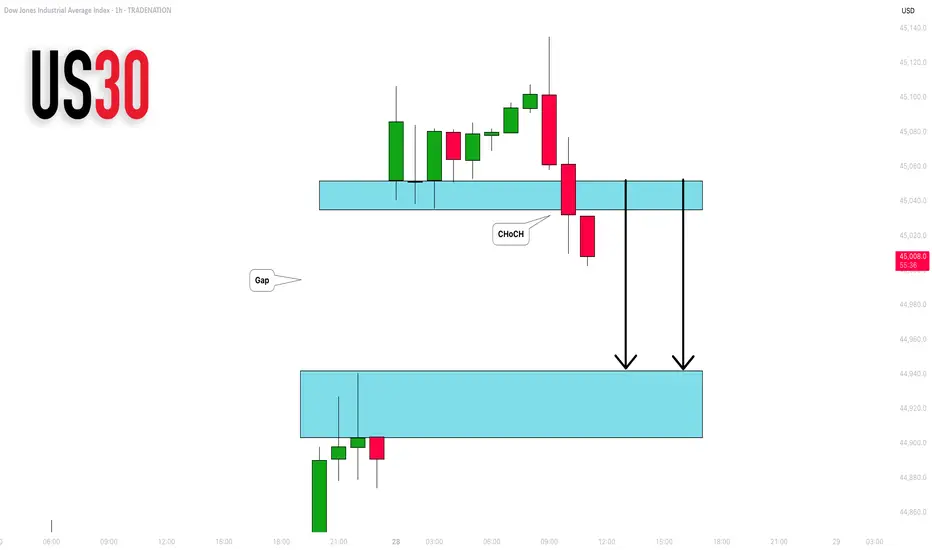
DOW JONES INDEX (US30): Another Gap For Today?
I see another gap up opening on US30 Index.
I think it will be filled today. A formation of an intraday
bearish CHoCH on an hourly time frame suggests
a highly probable bearish continuation.
Goal - 44943
❤️Please, support my work with like, thank you!❤️
I am part of Trade Nation's Influencer program and receive a monthly fee for using their TradingView charts in my analysis.
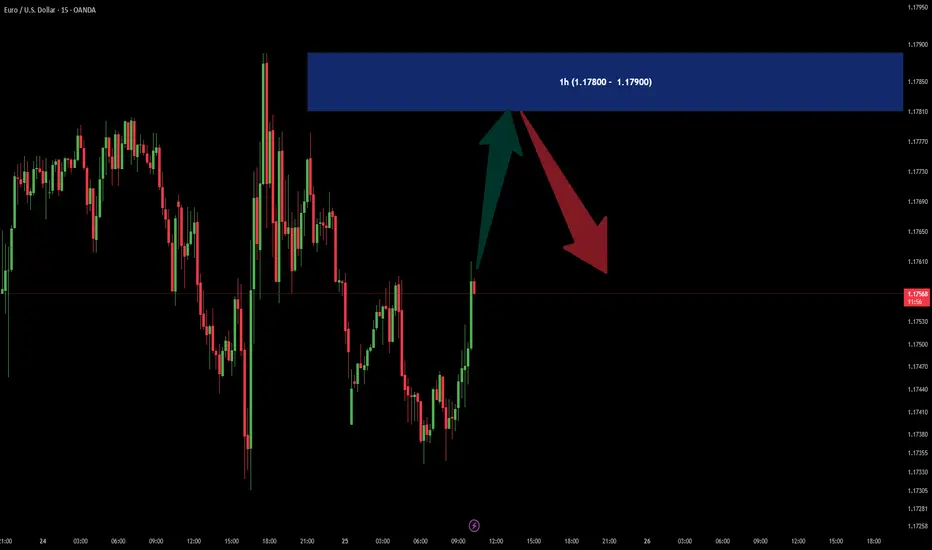
EURUSD SELL OFFERIn 1h time frame there is a SUPPLY area in (1.17800 - 1.17900) price zone.
It could be good for a SELL scalpers.
DeGRAM | BNBUSD above the support📊 Technical Analysis
● BNB is climbing a steep micro-channel nested in the long-term purple up-trend; the last dip stopped exactly at the $775 breakout shelf and printed a fresh higher-high, showing buyers still protect every pull-back.
● The old March resistance line has been broken and retested as support; its extension, plus the channel ceiling, converge at $835-840—matching the 1.618 flag-pole projection from July’s consolidation.
💡 Fundamental Analysis
● On-chain activity is surging: Yahoo Finance reports BNB Chain daily transactions and DEX volume just reached multi-month highs, underpinning spot demand.
✨ Summary
Long $775-790; hold above the green shelf targets $835 → $840. Invalidate on a 4 h close below $741.
-------------------
Share your opinion in the comments and support the idea with a like. Thanks for your support!

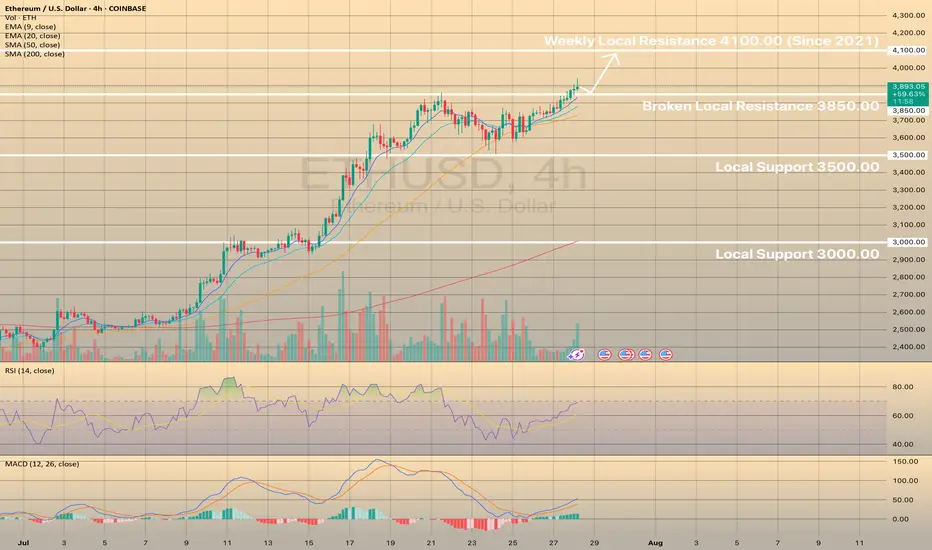
ETHUSD HEADS TOWARDS WEEKLY RESISTANCEETHUSD HEADS TOWARDS WEEKLY RESISTANCE
ETHUSD has broken local resistance of 3,850.00 and is currently heading towards weekly resistance of 4,100.00, the level, established in 2021. Last time the asset came close to this level at the end of last year and reversed from it afterwards. Same situation is expected here.
Price may retest the level of 3,850.00 and then head towards 4,100.00 level. No reversal signs on RSI or MACD. Vice a versa, RSI shows local strength of the asset, MACD is in the green zone. Buying volume highlights current bullish impulse.

DeGRAM | EURGBP exited the channel📊 Technical Analysis
● Breakout: price burst from the July descending wedge, reclaimed 0.8695 former cap, and is now riding a steep intraday channel of higher-highs; the channel mid-line aligns with the broken wedge roof, adding fresh support.
● A pennant is consolidating just above 0.8695; its measured pole and the outer channel top converge at the next horizontal barrier 0.8739.
💡 Fundamental Analysis
● Softer UK July composite-PMI (47.9 vs 50.2 prior) revived BoE cut bets, while ECB speakers flagged “premature to talk easing,” narrowing the rate gap in the euro’s favour.
✨ Summary
Long 0.8695-0.8705; pennant break targets 0.8739. Bias void on a 30 m close below 0.8648.
-------------------
Share your opinion in the comments and support the idea with like. Thanks for your support!

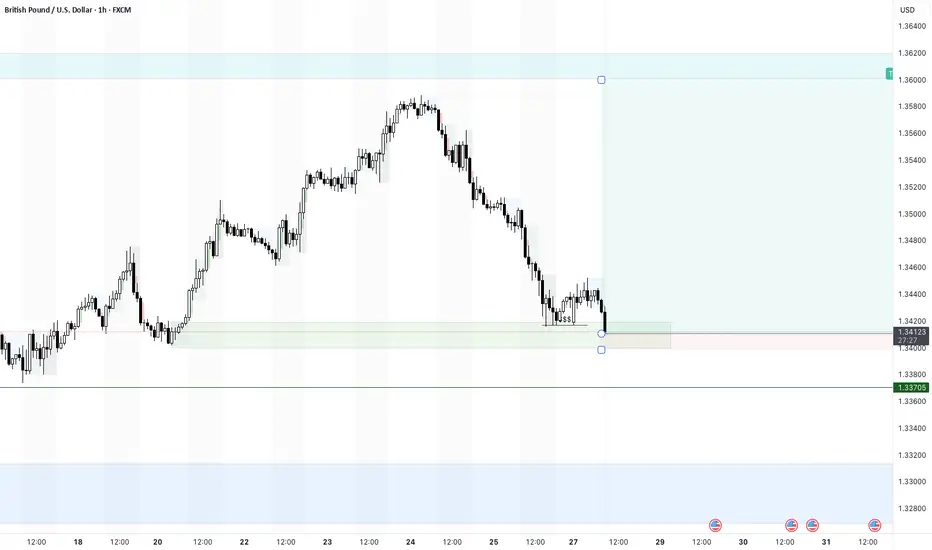
GBPUSD has formed a potential head and shoulders patternOn the daily chart, GBPUSD has formed a head and shoulders top pattern. The current support below is around 1.336. If it falls below, it is expected to continue to fall, with the downside target around 1.314. At present, you can pay attention to the short-selling opportunities around 1.345.

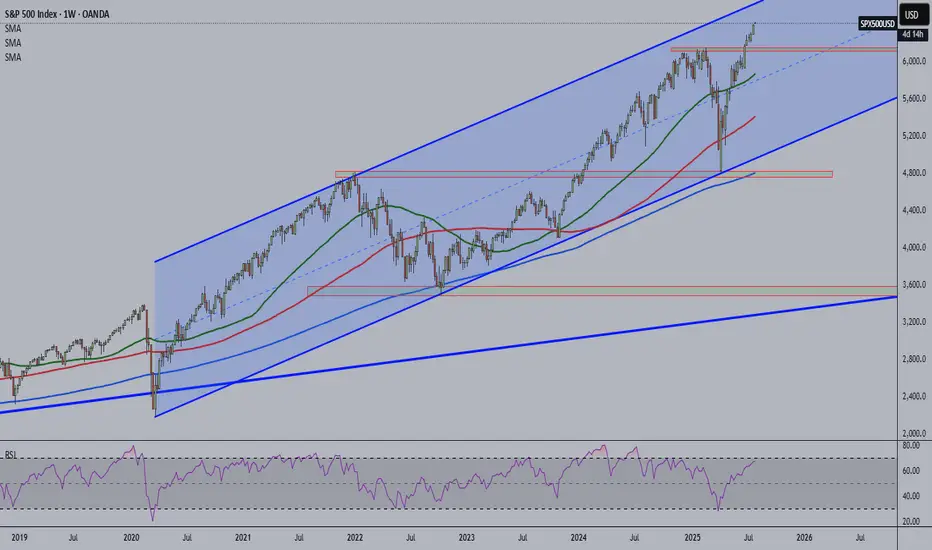
Overbought alert? The S&P500 is nearing weekly and monthly bullish channel resistance. Price has remained within this channel since 2020.
PEPPERSTONE:US500 VANTAGE:SP500
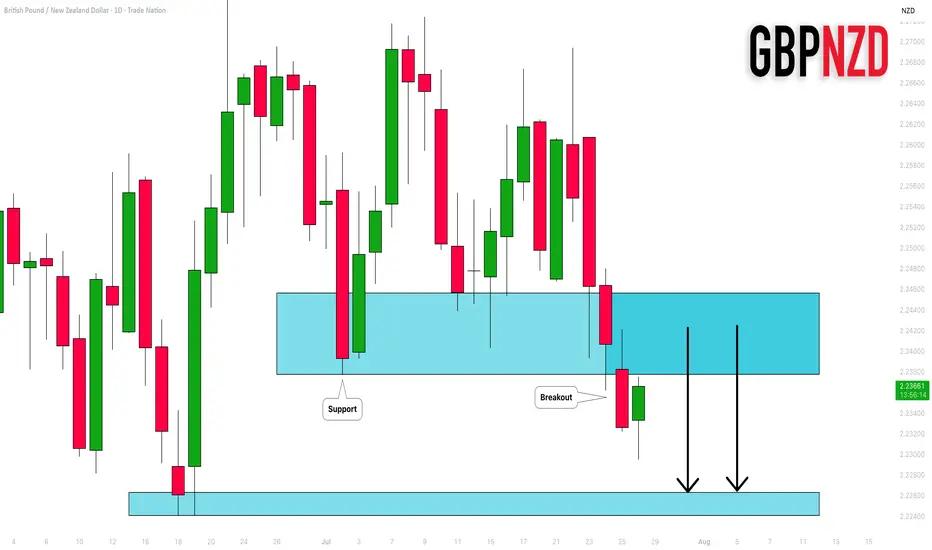
GBPNZD: Important Breakout 🇬🇧🇳🇿
GBPNZD broke and closed below a significant support cluster on a daily.
The broken structure turned into a strong resistance.
I will expect a bearish move from that.
Next support - 2.2264
❤️Please, support my work with like, thank you!❤️
I am part of Trade Nation's Influencer program and receive a monthly fee for using their TradingView charts in my analysis.
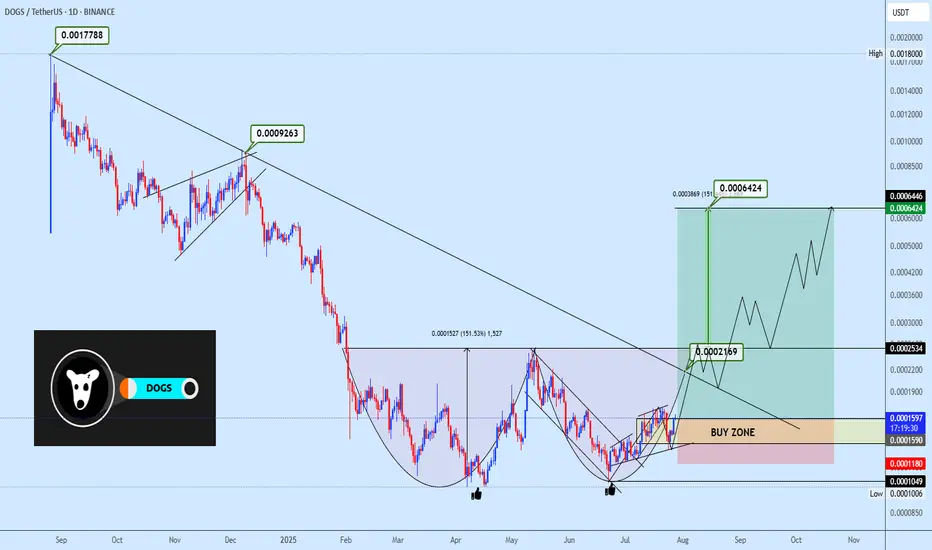
Dogsusdt double bottom formationDOGSUSDT is exhibiting a micro double bottom formation, with price rebounding from a previous support zone. The strategy is to accumulate within the highlighted area and monitor the neckline reaction around 0.0002534. A breakout above this level would validate the entire double bottom structure and set the stage for a move toward the projected targets. Enjoy.
Tesla Stock in Bearish Trend - Further Downside ExpectedTesla Stock in Bearish Trend - Further Downside Expected
Tesla's (TSLA) stock price continues to display a clear bearish trend structure, characterized by the formation of consistent lower lows and lower highs on the price chart. This technical pattern suggests sustained selling pressure and indicates the downtrend will likely persist in upcoming trading sessions.
Key Technical Observations:
- Established Downtrend: The consecutive lower highs and lows confirm the bearish price structure remains intact
- Weak Momentum: Each rally attempt has failed to gain traction, meeting selling pressure at progressively lower levels
- Critical Price Levels: The stock has established well-defined resistance and support zones for traders to monitor
Price Projections:
- Downside Target at $272: The bearish momentum could drive TSLA toward the $272 support level, representing a potential 15% decline from current levels
- Key Resistance at $370: Any recovery attempts will likely face strong selling pressure near the $370 level, which now serves as a major resistance barrier
Market Implications:
1. Bearish Continuation Expected: The prevailing trend structure favors further downside unless a significant reversal pattern emerges
2. Breakdown Risk: A decisive move below current support levels could accelerate selling momentum toward $272
3. Short-Term Rally Potential: While the overall trend remains down, temporary rebounds toward $370 may present selling opportunities
Trading Considerations:
- Short Positions: Consider maintaining bearish exposure while price remains below the $370 resistance level
- Stop Loss: A sustained break above $370 would invalidate the immediate bearish outlook
- Profit Targets: $272 serves as the primary downside objective, with potential support levels to watch along the way
Risk Factors to Monitor:
- Market sentiment shifts in the EV sector
- Changes in Tesla's production/delivery outlook
- Broader market conditions affecting tech/growth stocks
The technical setup suggests Tesla shares remain vulnerable to further declines, with $272 emerging as the next significant downside target. Traders should watch for either confirmation of the bearish continuation or potential reversal signals near key support levels. As always, proper risk management remains essential when trading in trending markets.

GBPUSD 28/7/25- Sweep and bullishI highlighted the equal liquidity zone and places a buy limit order.
This has been triggered and now will see if it holds.